Technical & Derivatives Report
February 01, 2016
Sensex (24871) / Nifty (7564)
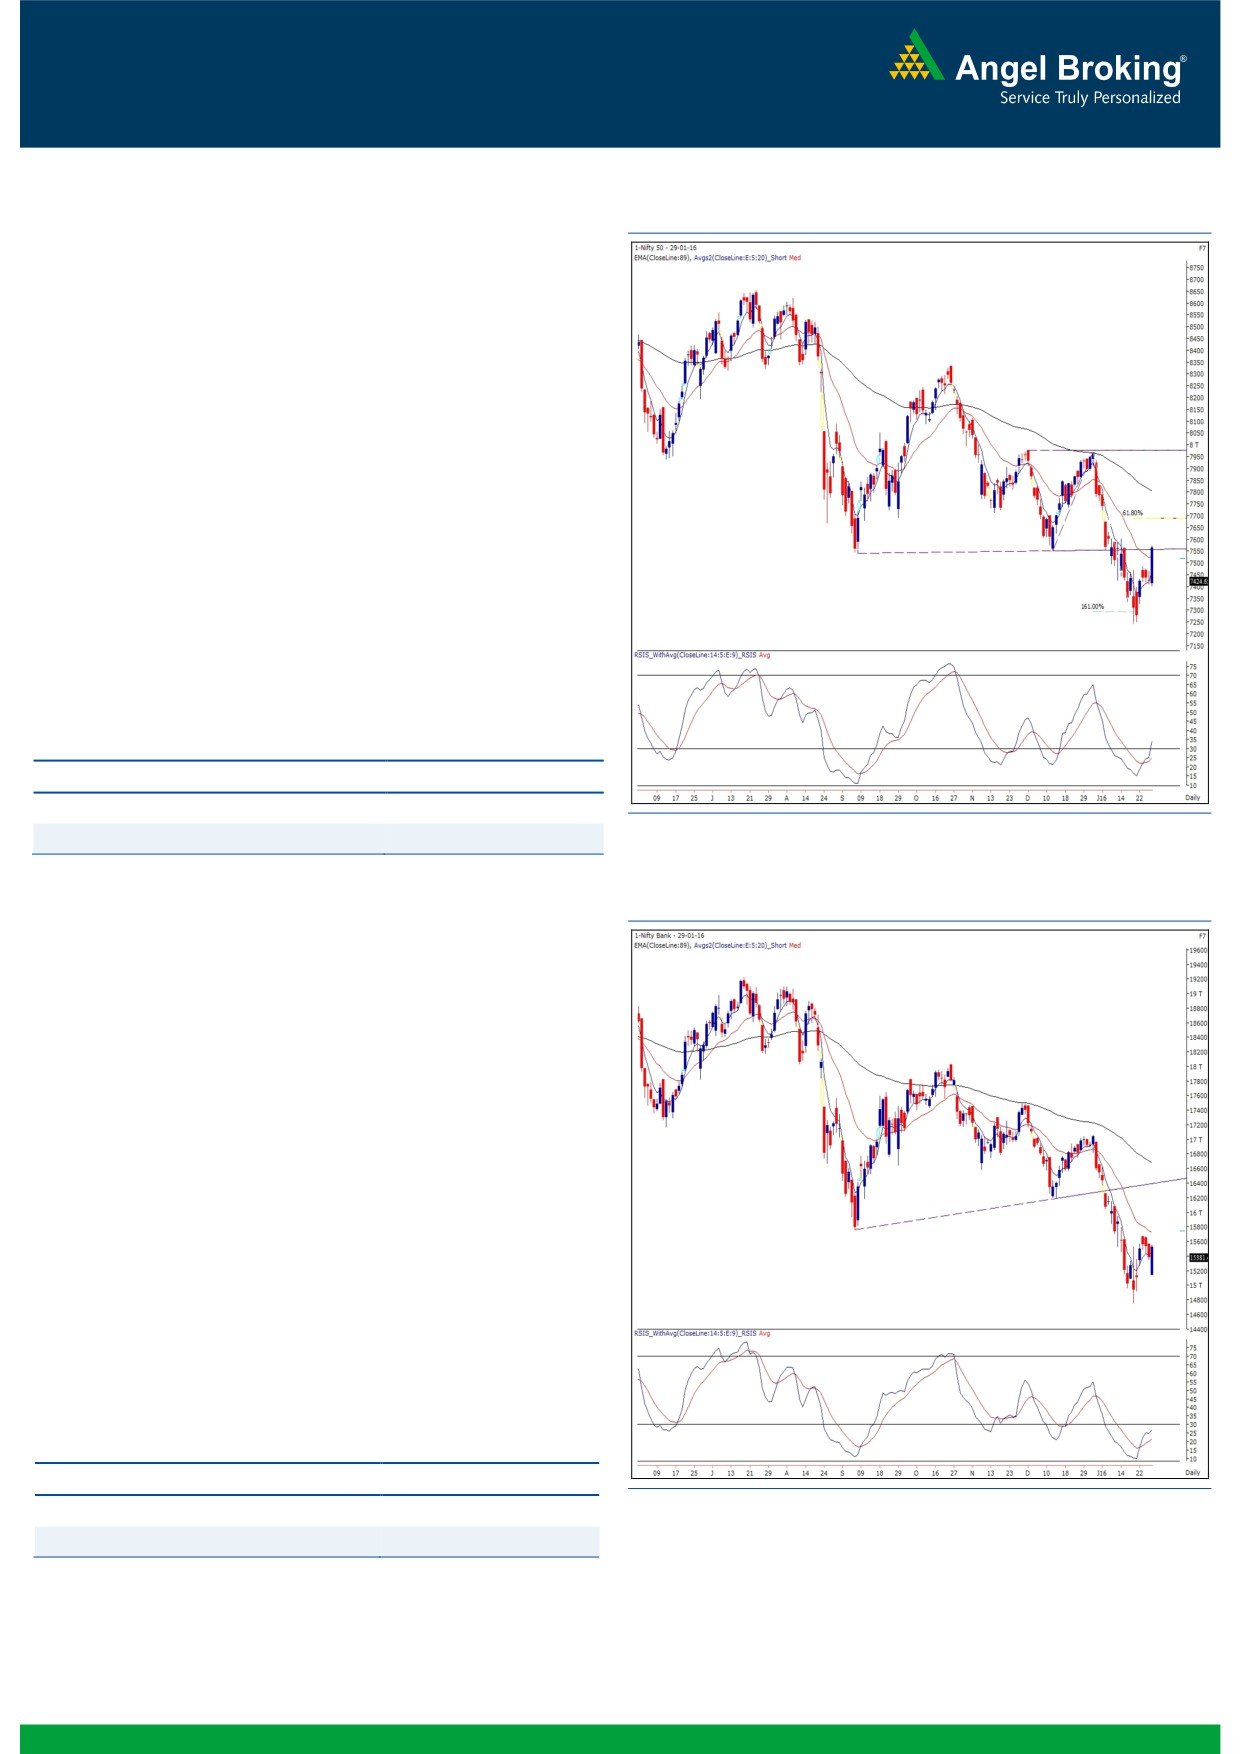
Exhibit 1: Nifty Daily Chart
Our recent strategy of covering short positions near 7300 and
buying in some of the heavyweight propositions has certainly
played out well. We have been mentioning about the ‘Falling
Wedge’ on the weekly chart since last couple of weeks. Last
week, Nifty managed to find a very good support around the
lower end of the pattern and went on to form a ‘Dragonfly
Doji’ pattern. This pattern is proving its significance now.
The Nifty has moved towards our mentioned levels of 7550 -
7600 and now, considering the positive placement of the ‘RSI-
Smoothened’ oscillator on the daily chart, we expect this move
to extend further towards
7650
-
7700 levels
(61.8%
retracement of the recent fall from 7972.55 to 7241.50). On
the flipside, the immediate support has now shifted higher to
7400. We maintain our view that traders should refrain from
shorting and rather, should focus on stock specific long ideas
with a proper exit strategy.
Key Levels
Support 1 - 7487
Resistance 1 - 7650
Support 2 - 7400
Resistance 2 - 7700
Exhibit 2: Bank Nifty Daily Chart
Bank Nifty Outlook - (15522)
Due to gap down opening in private sector heavyweight
banking conglomerates, ICICI Bank and Axis Bank, the Nifty
Bank index opened with a downside gap of around 240 points
on Friday. But, post the gap down opening, the banking index
continued to move higher and trimmed all its intraday losses
to post a close with gains of 0.92 percent over its previous
close.
With a good up move on the concluding session, the Nifty
Bank index managed to close inside the positive territory on
weekly chart. Going forward, the banking index has a strong
resistance around 15760 and a sustainable move above this
level may pull the index towards the 16000 mark. On the
flipside, immediate support for the index is placed at 15350
and 15130 levels. Traders can trade banking stocks with a
positive bias.
Key Levels
Support 1 - 15760
Resistance 1 - 15350
Support 2 - 16000
Resistance 2 - 15130
1
Technical & Derivatives Report
February 01, 2016
Comments
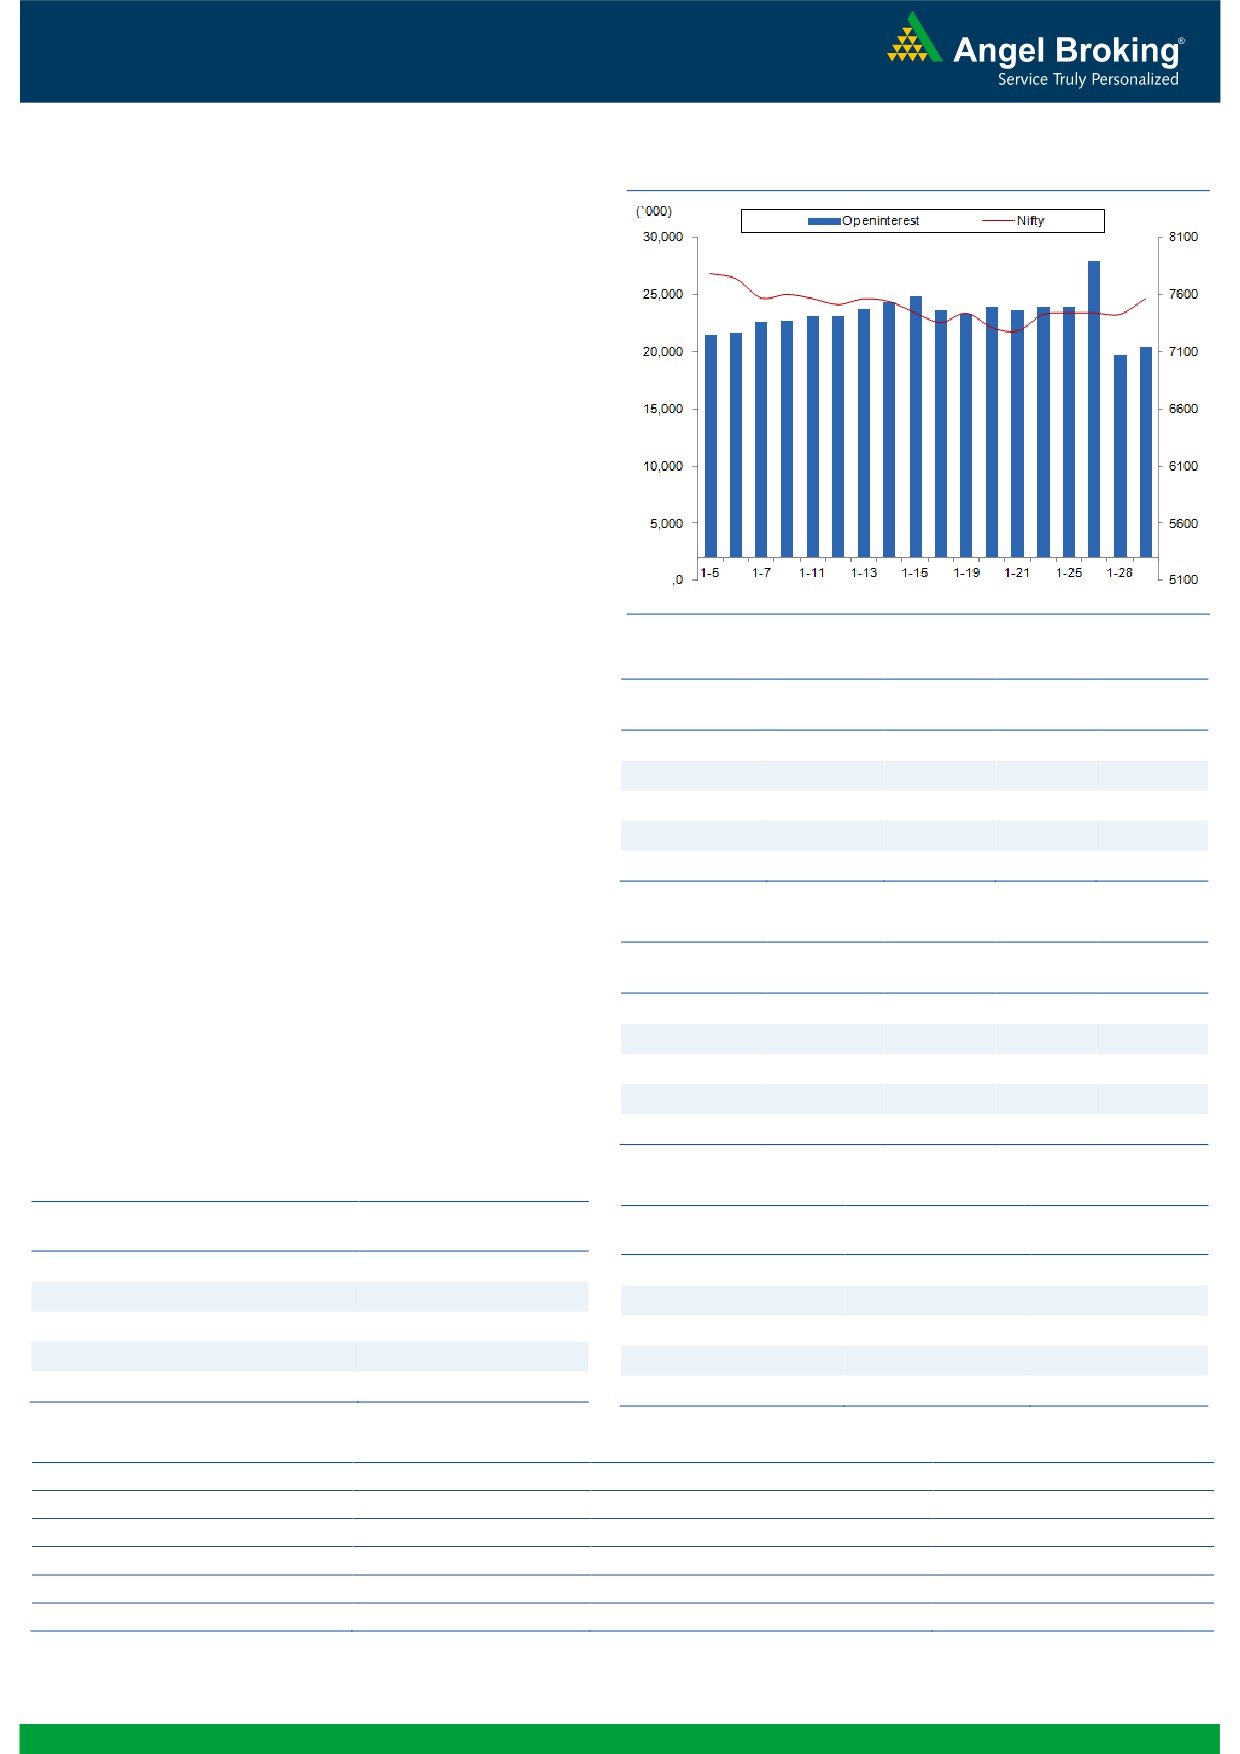
Nifty Vs OI
The Nifty futures open interest has increased by 3.33%
BankNifty futures open interest has increased by 1.10%
as market closed at 7563.55 levels.
The Nifty February future closed at a premium of 4.50
points against a premium of 23.70 points. The March
series closed at a premium of 18.20 points.
The Implied Volatility of at the money options has
decreased from 16.87% to 15.10%.
The total OI of the market is Rs. 1,77,409/- cr. and the
stock futures OI is Rs. 58,117/- cr.
Few of the liquid counters where we have seen high cost
of carry are UNITECH, GMRINFRA, IDFC, IFCI and
TATAPOWER.
Views
OI Gainers
After long time, FIIs were net buyers in both cash and
OI
PRICE
Index Futures. They bought equities to the tune of Rs. 572
SCRIP
OI
PRICE
CHG. (%)
CHG. (%)
crores. While in Index Futures, they bought of worth Rs.
ENGINERSIN
4756400
83.38
192.55
-1.05
1327 crores with significant rise in OI, indicating long
IRB
5869500
36.21
244.60
3.58
build-up in last trading session.
JUSTDIAL
2372000
33.60
605.15
-11.37
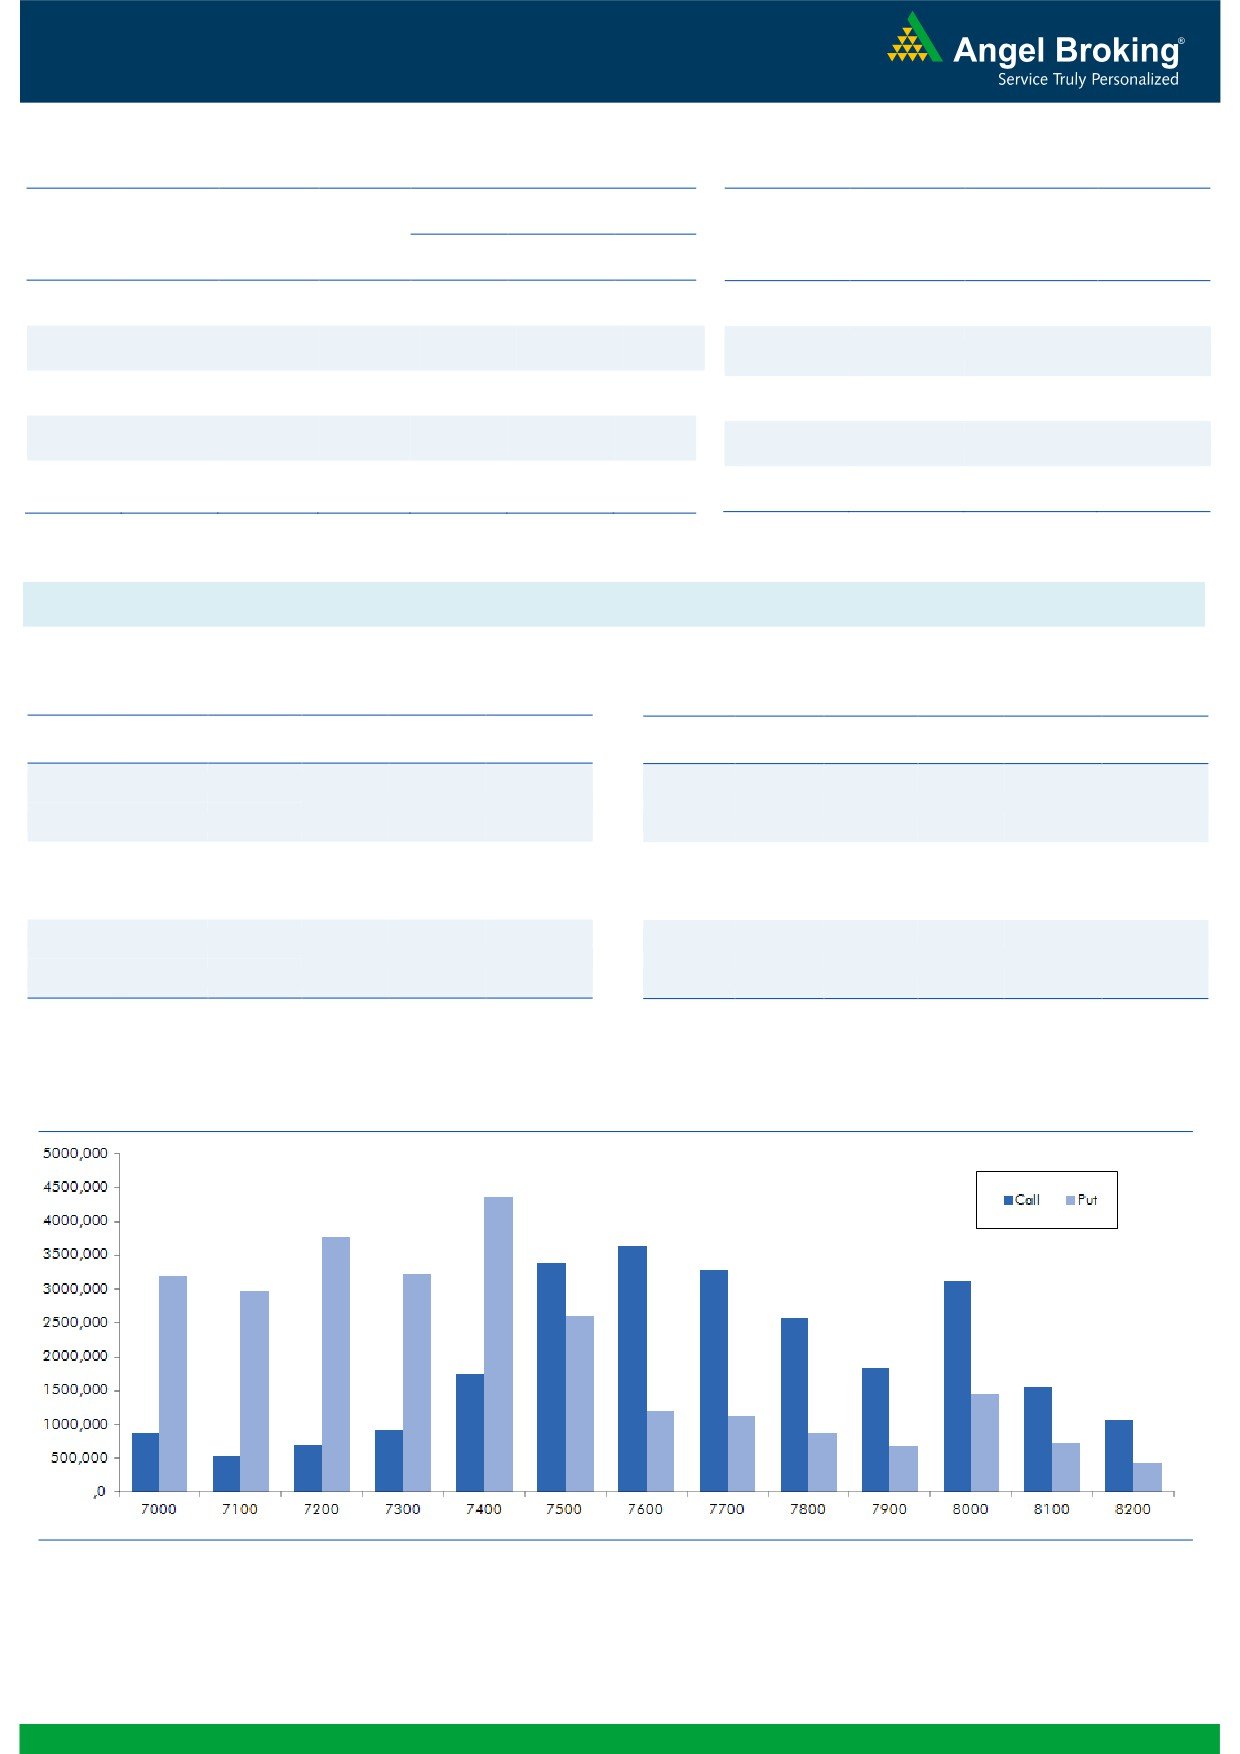
In Index Options front, FIIs were net buyers of Rs. 2276
BEML
579500
17.31
1049.45
-1.86
crores with good amount of rise in OI. In call options,
TVSMOTOR
3658000
17.09
290.20
-0.74
7700 and 7900 strikes added some fresh OI. While in
put options, good amount of build-up was witnessed in
OI Losers
7300-7500 strike prices. Maximum build-up in current
OI
PRICE
series is now visible in 7600 call and 7400 put options.
SCRIP
OI
PRICE
CHG. (%)
CHG. (%)
Yesterday, surprisingly we saw good amount of buying
LT
11749500
-10.48
1106.60
2.57
by FIIs, we would like to wait for their further moves
ASIANPAINT
4058400
-9.41
871.80
1.03
before forming any positions in Nifty. Trade stock specific
GODREJCP
257200
-8.40
1228.70
4.25
and be light in Nifty.
HINDZINC
2230400
-5.30
160.95
-0.68
BAJFINANCE
188125
-5.23
5937.00
2.34
Historical Volatility
Put-Call Ratio
SCRIP
HV
SCRIP
PCR-OI
PCR-VOL
JUSTDIAL
97.20
NIFTY
0.89
0.81
SRTRANSFIN
67.35
BANKNIFTY
1.00
0.69
TITAN
43.97
LT
0.75
0.60
YESBANK
65.79
SBIN
0.62
0.47
HEROMOTOCO
39.38
ICICIBANK
0.79
0.65
Strategy Date
Symbol
Strategy
Status
2
Technical & Derivatives Report
February 01, 2016
FII Statistics for 29-January 2015
Turnover on 29-January 2015
Open Interest
No. of
Turnover
Change
Detail
Buy
Sell
Net
Instrument
Value
Change
Contracts
( in Cr. )
(%)
Contracts
(in Cr.)
(%)
INDEX
INDEX
2929.21
1601.99
1327.23
213262
11638.71
8.70
341576
17946.45
-29.74
FUTURES
FUTURES
INDEX
INDEX
26586.38
24310.38
2276.00
896729
50441.99
12.65
2312648
128475.97
-69.19
OPTIONS
OPTIONS
STOCK
5248.26
4707.02
541.24
1037901
47154.36
2.41
STOCK
FUTURES
707653
32376.88
-54.01
FUTURES
STOCK
10350.
STOCK
2592.40
2483.27
109.13
26962
1205.67
OPTIONS
39
328528
15420.19
-30.44
OPTIONS
TOTAL
37356.25
33102.65
4253.60
2174854
110440.73
8.42
TOTAL
3690405
194219.48
-63.71
Nifty Spot = 7563.55
Lot Size = 75
Bull-Call Spreads
Bear-Put Spreads
Action
Strike
Price
Risk
Reward
BEP
Action
Strike
Price
Risk
Reward
BEP
Buy
7600
105.00
Buy
7500
99.50
43.80
56.20
7643.80
28.85
71.15
7471.15
Sell
7700
61.20
Sell
7400
70.65
Buy
7600
105.00
Buy
7500
99.50
72.75
127.25
7672.75
49.60
150.40
7450.40
Sell
7800
32.25
Sell
7300
49.90
Buy
7700
61.20
Buy
7400
70.65
28.95
71.05
7728.95
20.75
79.25
7379.25
Sell
7800
32.25
Sell
7300
49.90
Note: Above mentioned Bullish or Bearish Spreads in Nifty (Feb. Series) are given as an information and not as a recommendation.
Nifty Put-Call Analysis
3
Technical & Derivatives Report
February 01, 2016
Daily Pivot Levels for Nifty 50 Stocks
Scrips
S2
S1
PIVOT
R1
R2
ACC
1,199
1,220
1,237
1,257
1,274
ADANIPORTS
204
208
213
216
221
AMBUJACEM
191
193
195
197
198
ASIANPAINT
852
861
868
877
884
AXISBANK
387
398
404
414
420
BAJAJ-AUTO
2,225
2,284
2,322
2,380
2,418
BANKBARODA
118
122
126
130
134
BHARTIARTL
275
282
290
297
305
BHEL
135
137
138
140
141
BOSCHLTD
16,700
17,098
17,389
17,787
18,078
BPCL
848
870
888
911
929
CAIRN
115
119
124
128
133
CIPLA
571
578
585
592
599
COALINDIA
297
309
317
328
336
DRREDDY
2,917
3,011
3,065
3,160
3,214
GAIL
357
363
368
373
378
GRASIM
3,303
3,349
3,396
3,441
3,489
HCLTECH
832
849
859
876
887
HDFC
1,128
1,154
1,171
1,197
1,214
HDFCBANK
1,027
1,038
1,047
1,058
1,066
HEROMOTOCO
2,389
2,477
2,531
2,620
2,674
HINDALCO
68
69
70
72
73
HINDUNILVR
780
799
809
828
838
ICICIBANK
213
221
228
237
243
IDEA
100
101
104
106
109
INDUSINDBK
886
908
921
943
956
INFY
1,117
1,141
1,156
1,179
1,194
ITC
312
316
321
325
330
KOTAKBANK
657
670
678
692
700
LT
1,055
1,078
1,094
1,117
1,132
LUPIN
1,678
1,694
1,708
1,724
1,738
M&M
1,187
1,210
1,225
1,248
1,263
MARUTI
3,847
3,971
4,048
4,172
4,249
NTPC
137
140
143
146
149
ONGC
218
222
225
229
232
PNB
87
89
90
93
94
POWERGRID
143
145
147
149
151
RELIANCE
1,009
1,022
1,031
1,044
1,053
SBIN
174
177
181
184
189
VEDL
67
69
71
74
75
SUNPHARMA
824
849
863
888
902
TATAMOTORS
318
327
334
344
350
TATAPOWER
59
59
60
61
62
TATASTEEL
241
245
252
257
263
TCS
2,311
2,351
2,375
2,416
2,440
TECHM
487
494
500
507
513
ULTRACEMCO
2,696
2,768
2,810
2,882
2,925
WIPRO
542
552
559
569
576
YESBANK
617
682
716
780
814
ZEEL
397
409
416
427
434
4
Technical & Derivatives Report
February 01, 2016
Research Team Tel: 022 - 39357800
For Technical Queries
For Derivatives Queries
DISCLAIMER
Angel Broking Private Limited (hereinafter referred to as “Angel”) is a registered Member of National Stock Exchange of India Limited,
Bombay Stock Exchange Limited and MCX Stock Exchange Limited. It is also registered as a Depository Participant with CDSL and
Portfolio Manager with SEBI. It also has registration with AMFI as a Mutual Fund Distributor. Angel Broking Private Limited is a
registered entity with SEBI for Research Analyst in terms of SEBI (Research Analyst) Regulations, 2014 vide registration number
INH000000164. Angel or its associates has not been debarred/ suspended by SEBI or any other regulatory authority for accessing
/dealing in securities Market. Angel or its associates including its relatives/analyst do not hold any financial interest/beneficial
ownership of more than 1% in the company covered by Analyst. Angel or its associates/analyst has not received any compensation /
managed or co-managed public offering of securities of the company covered by Analyst during the past twelve months. Angel/analyst
has not served as an officer, director or employee of company covered by Analyst and has not been engaged in market making activity
of the company covered by Analyst.
This document is solely for the personal information of the recipient, and must not be singularly used as the basis of any investment
decision. Nothing in this document should be construed as investment or financial advice. Each recipient of this document should
make such investigations as they deem necessary to arrive at an independent evaluation of an investment in the securities of the
companies referred to in this document (including the merits and risks involved), and should consult their own advisors to determine
the merits and risks of such an investment.
Reports based on technical and derivative analysis center on studying charts of a stock's price movement, outstanding positions and
trading volume, as opposed to focusing on a company's fundamentals and, as such, may not match with a report on a company's
fundamentals.
The information in this document has been printed on the basis of publicly available information, internal data and other reliable
sources believed to be true, but we do not represent that it is accurate or complete and it should not be relied on as such, as this
document is for general guidance only. Angel Broking Pvt. Limited or any of its affiliates/ group companies shall not be in any way
responsible for any loss or damage that may arise to any person from any inadvertent error in the information contained in this report.
Angel Broking Pvt. Limited has not independently verified all the information contained within this document. Accordingly, we cannot
testify, nor make any representation or warranty, express or implied, to the accuracy, contents or data contained within this document.
While Angel Broking Pvt. Limited endeavors to update on a reasonable basis the information discussed in this material, there may be
regulatory, compliance, or other reasons that prevent us from doing so.
This document is being supplied to you solely for your information, and its contents, information or data may not be reproduced,
redistributed or passed on, directly or indirectly.
Neither Angel Broking Pvt. Limited, nor its directors, employees or affiliates shall be liable for any loss or damage that may arise from
or in connection with the use of this information.
Note: Please refer to the important ‘Stock Holding Disclosure' report on the Angel website (Research Section). Also, please refer to the
latest update on respective stocks for the disclosure status in respect of those stocks. Angel Broking Pvt. Limited and its affiliates may
have investment positions in the stocks recommended in this report.
5