May 24, 2011
Technical Research |
Daily Technical Report
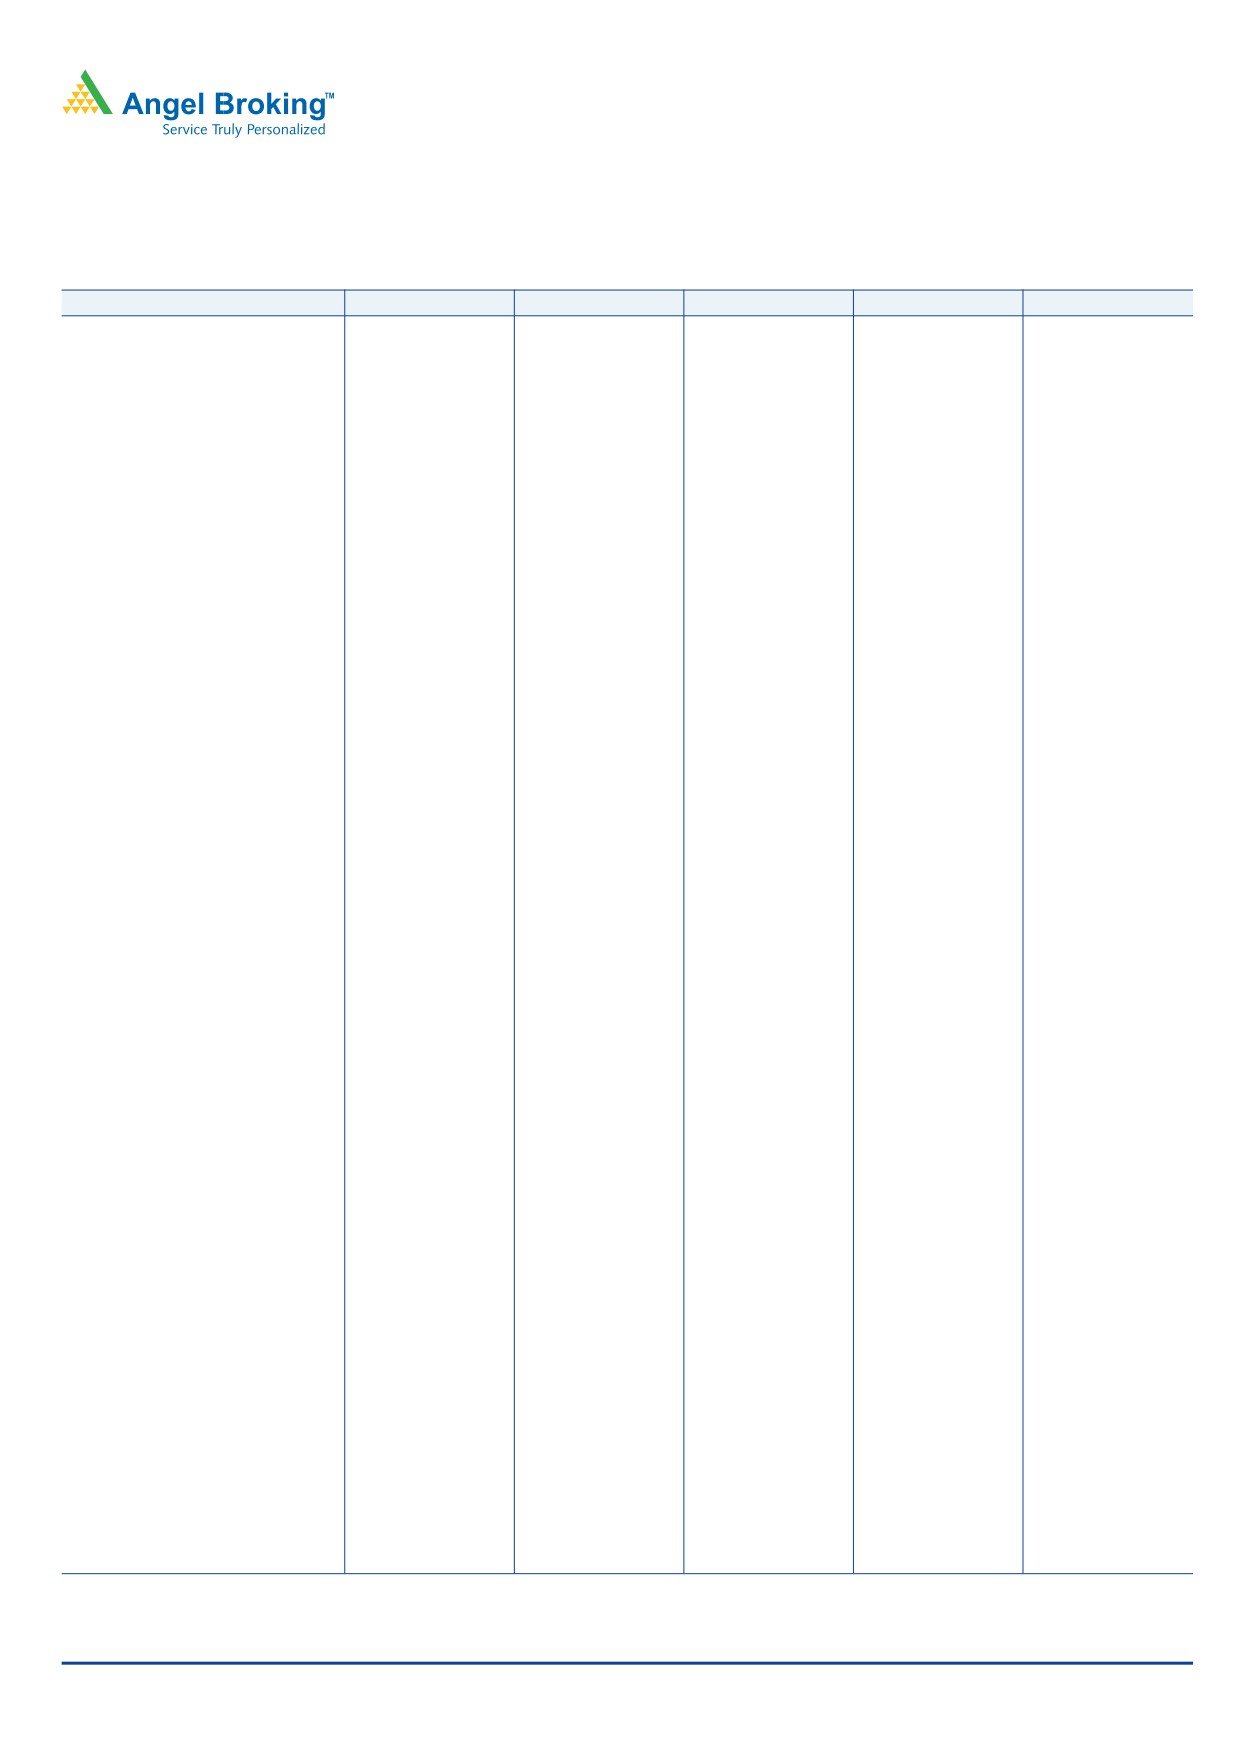
Sensex (17993) / NIFTY (5386)
Markets witnessed a gap down opening in the wake of weak
Exhibit 1: Sensex Daily chart
global cues.The advance decline ratio was in favour of declining
counters (A=821 D=1998) which lead the indices to close near
days low. The selling pressure was again lead by Consumer
Goods, Auto, Realty, Metal and Bankex. FMCG ended with
marginal gains.
Formation
On the Daily chart we are observing that prices have taken
Source: Falcon
resistance near the falling 20-daySMA and has formed a
negative candle which suggests continuation of down move.
Trading strategy:
After sharp fall the Indices have breached the low of the Hammer
pattern on the weekly chart and have formed a negative candle
on the daily chart. This suggests continuation of downfall. In
coming trading session if Indices trade convincingly below
17971 / 5370 levels then they may test 17718 / 5308 level.
On the upside, 18144 - 18200 / 5428 - 5450 levels may act
as resistance for the day.
Stock Recommendations:
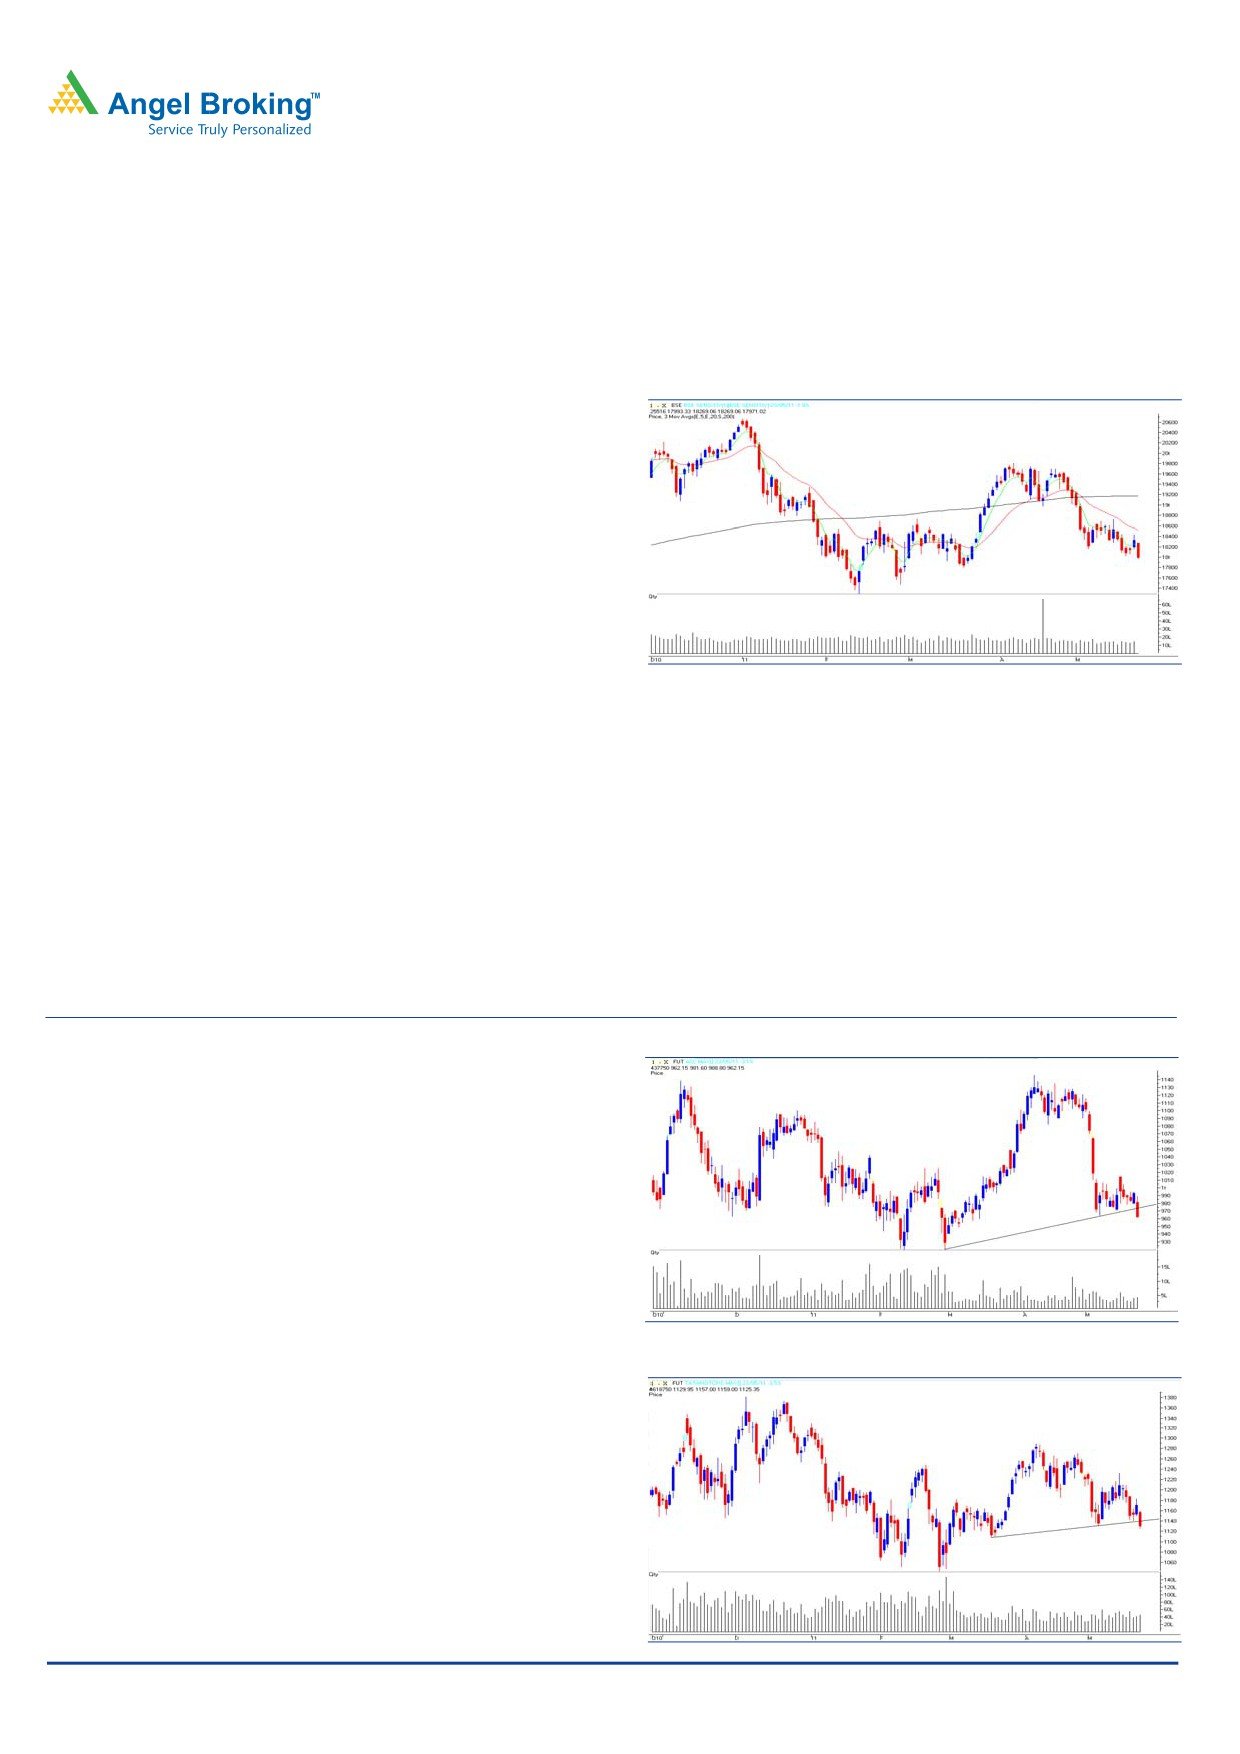
Exhibit 2: ACC (May futures)
Stock - ACC (May fut.)
Action - Sell
Selling Range
:
`976.00 - 980.00
Stop Loss
:
`994.25
Target
:
`938.00
Source: Falcon
Exhibit 3: Tata Motors (May futures)
Stock - Tata Motors (May fut.)
Action - Sell
Selling Range
:
`1,144.00 - 1,150.00
Stop Loss
:
`1,161.00
Target
:
`1,105.00
Source: Falcon
For Private Circulation Only | Angel Broking Ltd: BSE Sebi Regn No : INB 010996539 / CDSL Regn No: IN - DP - CDSL - 234 - 2004 / PMS Regn Code: PM/INP00000154 6 Angel Securities Ltd:BSE: INB010994639/INF010994639 NSE: INB230994635/INF230994635 Membership numbers: BSE 028/NSE:09946
1