Technical Report
Date : 14/12/2010
Market Summary
Indices
Top 5 Gainers
Top 5 Losers
Sectoral Watch
Nifty
Sensex
Stocks
% Gain
Stocks
% Loss
Sector
% G / L
Open
5883
19600
RELINFRA
3.89
AMBUJACEM
3.17
REALTY
2.79
High
5914
19711
HDFC
3.80
ACC
2.32
METAL
2.10
Low
5796
19321
DLF
3.53
M&M
2.02
POWER
2.09
Close
5908
19692
SAIL
3.12
ITC
1.76
CG
1.68
% Chg
0.86
0.94
TATAMOTOR
3.08
RANBAXY
1.57
FMCG
(0.13)
Source : Falcon
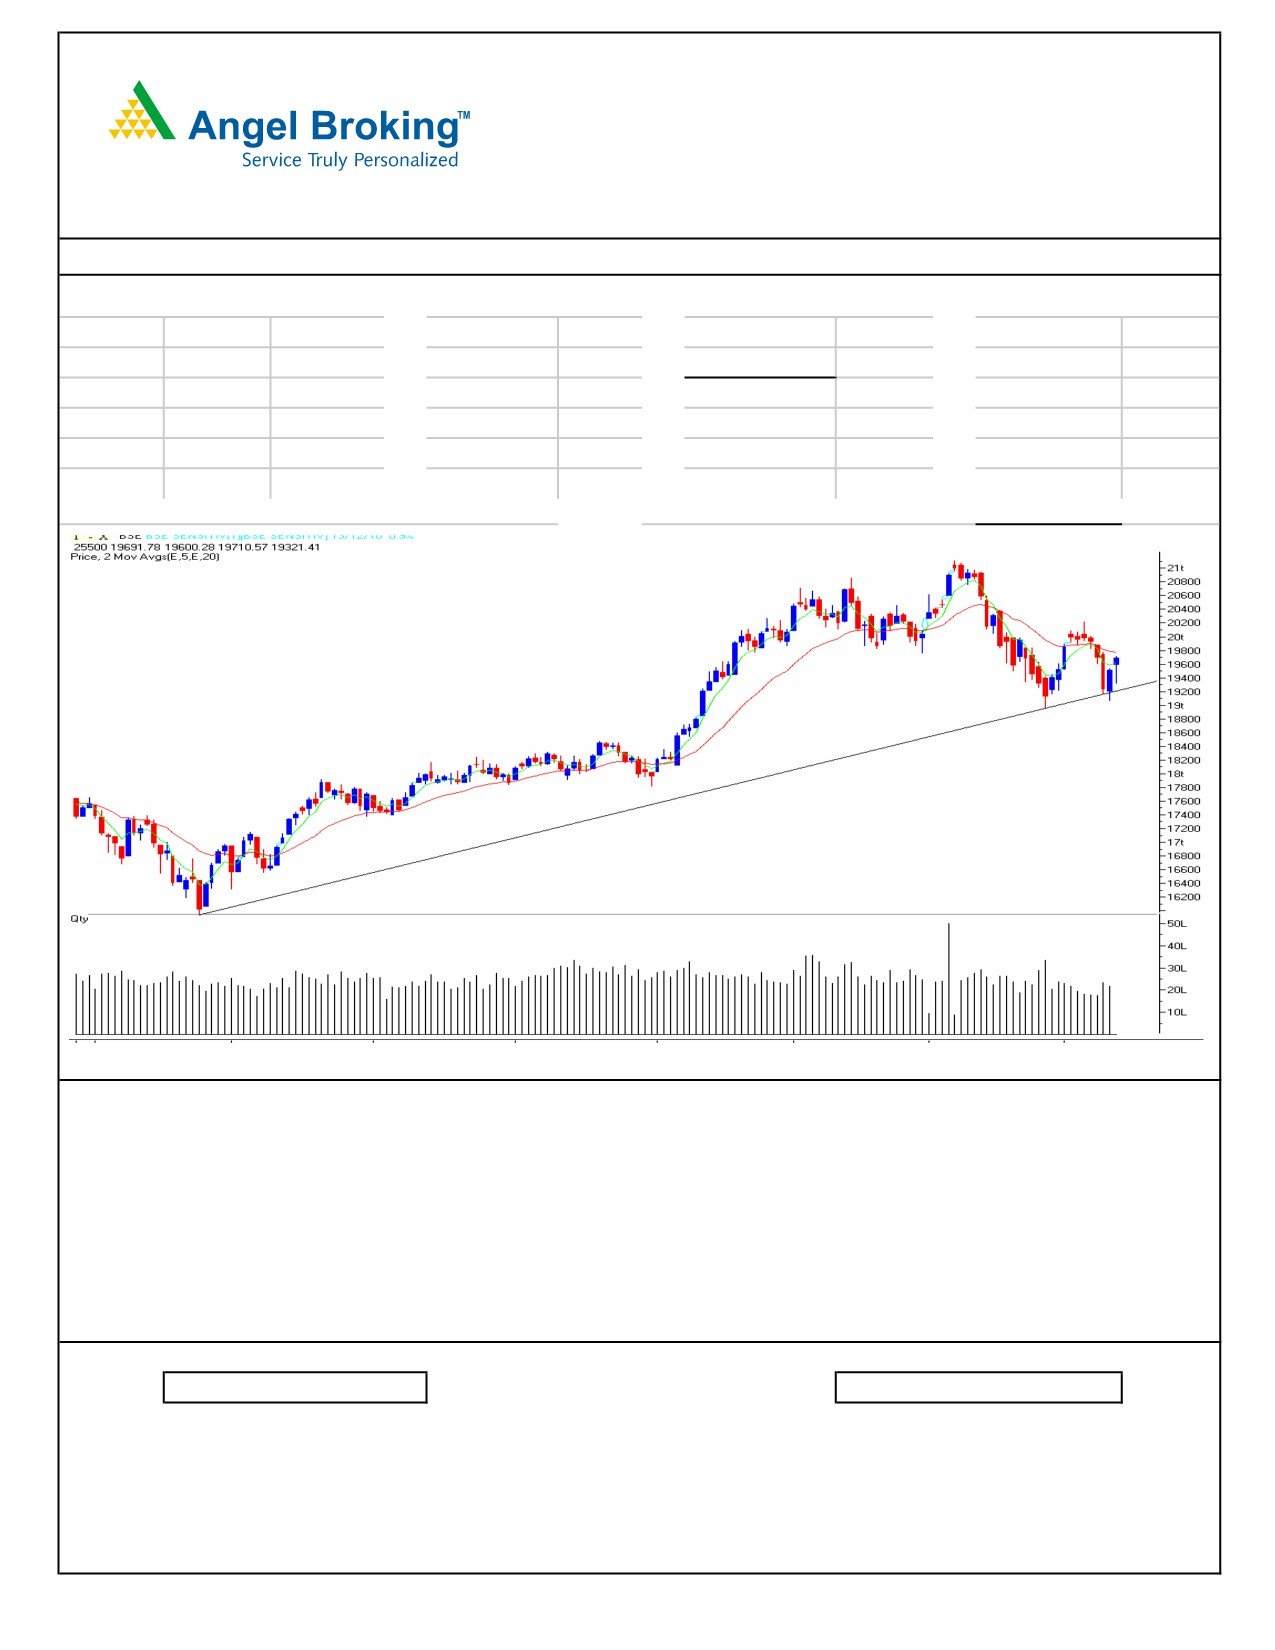
SENSEX DLY CHART
Markets opened on a subdued note traded with negative bias in the early hour of trade but recovered from the
low point of the day to close in positive territory. On the daily chart, the momentum oscillators viz. RSI and the
Stochastic are positively poised which suggests further upside momentum. Hence, in the coming trading session
if indices trade convincingly above 19771 / 5930 levels then they are likely to test 19875 - 20008 / 5960 - 6000
levels. On the downside, 19550 - 19320 / 5860 - 5800 may act as support for the day.
-
Stocks +ve Bias
Stocks -ve Bias
HDIL
The stocks mentioned above are given considering the general direction of the trend expected over a period of 2 or
3 days. Investors / Traders are expected to use their own discretion while taking any action related to the stock.
For Private Circulation Only.
Technical Report
RESEARCH TEAM
Shardul Kulkarni
Head - Technicals
Mileen Vasudeo
Technical Analyst
Sameet Chavan
Technical Analyst
Research Team: 022-3952 6600
DISCLAIMER: This document is not for public distribution and has been furnished to you solely for your information and must not be reproduced or
redistributed to any other person. Persons into whose possession this document may come are required to observe these restrictions.
Opinion expressed is our current opinion as of the date appearing on this material only. While we endeavor to update on a reasonable basis the
information discussed in this material, there may be regulatory, compliance, or other reasons that prevent us from doing so. Prospective investors and
others are cautioned that any forward-looking statements are not predictions and may be subject to change without notice. Our proprietary trading and
investment businesses may make investment decisions that are inconsistent with the recommendations expressed herein.
The information in this document has been printed on the basis of publicly available information, internal data and other reliable sources believed to be
true and are for general guidance only. While every effort is made to ensure the accuracy and completeness of information contained, the company
takes no guarantee and assumes no liability for any errors or omissions of the information. No one can use the information as the basis for any claim,
demand or cause of action.
Recipients of this material should rely on their own investigations and take their own professional advice. Each recipient of this document should make
such investigations as it deems necessary to arrive at an independent evaluation of an investment in the securities of companies referred to in this
document (including the merits and risks involved), and should consult their own advisors to determine the merits and risks of such an investment. Price
and value of the investments referred to in this material may go up or down. Past performance is not a guide for future performance. Certain
transactions - futures, options and other derivatives as well as non-investment grade securities - involve substantial risks and are not suitable for all
investors. Reports based on technical analysis centers on studying charts of a stock's price movement and trading volume, as opposed to focusing on a
company's fundamentals and as such, may not match with a report on a company's fundamentals.
We do not undertake to advise you as to any change of our views expressed in this document. While we would endeavor to update the information
herein on a reasonable basis, Angel Broking, its subsidiaries and associated companies, their directors and employees are under no obligation to
update or keep the information current. Also there may be regulatory, compliance, or other reasons that may prevent Angel Broking and affiliates from
doing so. Prospective investors and others are cautioned that any forward-looking statements are not predictions and may be subject to change without
notice.
Angel Broking Limited and affiliates, including the analyst who has issued this report, may, on the date of this report, and from time to time, have long or
short positions in, and buy or sell the securities of the companies mentioned herein or engage in any other transaction involving such securities and earn
brokerage or compensation or act as advisor or have other potential conflict of interest with respect to company/ies mentioned herein or inconsistent
with any recommendation and related information and opinions.
Angel Broking Limited and affiliates may seek to provide or have engaged in providing corporate finance, investment banking or other advisory services
in a merger or specific transaction to the companies referred to in this report, as on the date of this report or in the past.
Sebi Registration No : INB 010996539
For Private Circulation Only.