Initiating coverage | Healthcare
December 17, 2012
TTK Healthcare
BUY
CMP
`551
Restructuring: a re-rating trigger
Target Price
`643
TTK Healthcare (TTKH), a part of the TTK group is present across businesses like
Investment Period
12 Months
pharmaceuticals, consumer products, medical devices and foods. The company has
leading brands like Woodward’s Gripe Water with more than 50% market share and
Stock Info
Eva which is a leader in women’s deodorant segment. TTKH’s continuous
Sector
Healthcare
advertisement spend has resulted in suboptimal RoE, although the same is expected to
reap benefits in the long term. With termination of the low margin condoms
Market Cap (` cr)
428
distribution business, the top-line is expected to be impacted by ~20%. The
Net Debt (` cr)
(53)
company’s increasing focus on branded foods
- a high RoE business, and
Beta
1.3
orthopaedic implants - a niche product in a nascent stage; provide long term growth
52 Week High / Low
598/330
opportunities. We initiate coverage on the stock, with a Buy recommendation and a
target price of `643.
Avg. Daily Volume
31,530
High advertisement cost to reap benefits in future: TTKH in FY2012 spent ~ `45cr on
Face Value (`)
10
advertising and sales promotion, which is very high at 191% of PBT. Though this
BSE Sensex
19,244
continued spend is likely to lead to near term sub-optimal ROE, we believe it would
Nifty
5,858
provide a strong growth momentum to the company over next 4 to 5 years.
Reuters Code
TTKH.BO
Food business - a long term driver: TTKH is focusing on the foods business especially
Bloomberg Code
TTKP IN
pellets, which is a high RoE business. In addition to being a major supplier to players
like PepsiCo, the company is planning to launch branded pellets under its own brand.
We believe this could be a long term growth driver for the company.
Shareholding Pattern (%)
Orthopaedic implants- a niche play: TTKHs knee implants in the orthopaedic segment
Promoters
65.4
are better suited for Indian markets and are competitively priced in an import
MF / Banks / Indian Fls
0.1
dominated market, thus providing it an edge over its competitors. This niche segment
being in the nascent growth stage provides immense future growth prospects.
FII / NRIs / OCBs
5.9
Outlook and Valuation: We expect TTKH to post a 9.6% and 27.6% CAGR in its
Indian Public / Others
28.6
revenue and net profit respectively, over FY2012-14E, while the EBITDA margin is
expected to expand by 275bp over FY2012-14E to 9.5%. The company has a strong
balance sheet with RoIC as high as 73.6% for FY2012. At the current market price,
Abs. (%)
3m 1yr
3yr
the stock is trading at EV/sales of 0.8x for FY2014E. We initiate coverage on the stock
Sensex
3.8
24.2
13.9
with a target price of `643 based on a target EV/sales of 1.0x for FY2014E.
TTK Healthcare
48.5
36.5
139.6
Key Financials
Y/E March (` cr)
FY2011
FY2012 FY2013E
FY2014E
Net Sales
311
354
374
425
% chg
23.3
13.8
5.8
13.5
Net Profit
14
16
19
25
% chg
54.1
11.3
19.2
36.0
EBITDA (%)
6.9
6.7
7.9
9.5
EPS (`)
19.0
20.1
24.1
32.7
P/E (x)
29.0
27.4
22.9
16.8
P/BV (x)
5.7
4.9
4.2
3.5
RoE (%)
20.1
19.2
19.7
22.5
RoIC (%)
91.9
73.6
71.1
84.5
Shareen Batatawala
EV/Sales (x)
1.2
1.1
1.0
0.8
+91-22-3935 7800 Ext: 6849
EV/EBITDA (x)
17.3
15.9
12.3
8.8
Source: Company, Angel Research
Please refer to important disclosures at the end of this report
1
TTK Healthcare | Initiating coverage
Investment Rationale
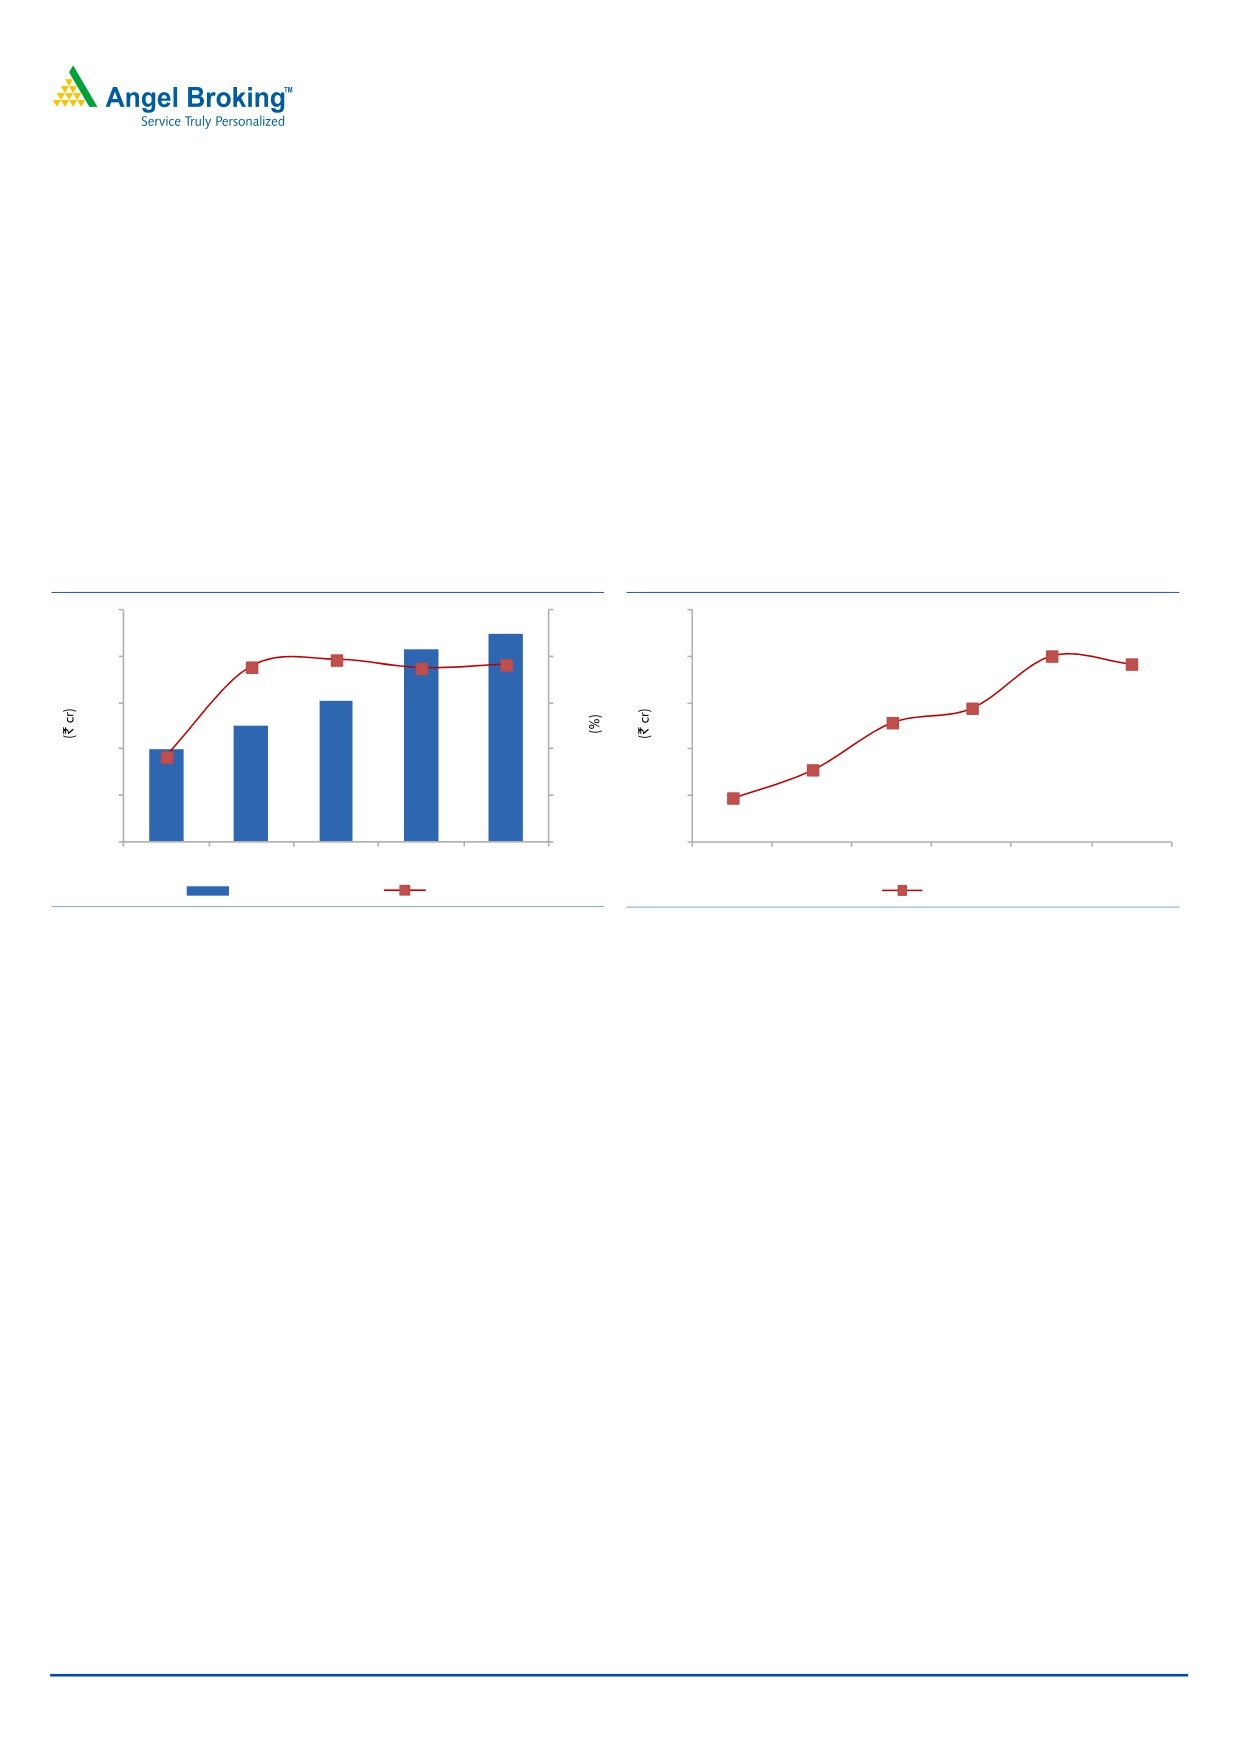
High advertisement spends to reap benefits in future
Benefits from high advertisement spend
TTKH has been consistently spending on advertising to build brands like Eva and Durex &
to fructify over 4-5 years
Kohinoor brands of condoms in India. Eva is a market leader in the women’s
deodorant category with ~20% share. The advertisement spend of the company has
grown at an 18.7% CAGR over FY2007-12 to `45cr in FY2012. At this level, the
advertisement cost as percentage of PBT stands at 191%. We believe that the high level
of advertisement has resulted in suboptimal-RoE. This continued focus on advertisement
spend is expected to lead to near term sub-optimal ROE in the short-term, which
subsequently will provide growth momentum over the next 4 to 5 years.
Exhibit 1: Continued focus on advertisement spend
Exhibit 2: Suboptimal RoE profile
50
250
25
196
40
187
200
20
20.1
189
191
19.2
30
150
15
14.4
12.9
20
100
10
91
7.8
10
50
5
4.7
20
25
30
42
45
0
0
0
FY2008
FY2009
FY2010
FY2011
FY2012
FY2007
FY2008
FY2009
FY2010
FY2011
FY2012
Advertisement spend
% of PBT
RoE
Source: Company, Angel Research
Source: Company, Angel Research
Foods business a long term driver
Focus on profit lucrative branded food
TTKH, in its foods division, manufactures potato and cereal based pellets for
business to drive long term bottom-line
markets in India and abroad. The company has been continuously investing in its
growth
three year old food business which has started yielding improved and innovative
products. The company is currently focusing on branded pellets (Pappads) with
plans to further invest `40cr in the food business over the next couple of years.
TTKH has increased its focus on the branded pellets and plans to have ~20% of
the revenue of the foods division contributed by the branded business over the next
3-4 years. TTKH has been supplying its products to multinational companies in
India and abroad. Moreover, the product manufactured by the company has a
huge export potential. The division has turned profitable in the last three quarters
and we believe this high RoE business would contribute to growth in the long term.
Orthopaedic implants- a niche play
TTKH’s competitively priced knee
Orthopaedic implants are a niche segment in India and the market is currently
implants better suited for Indian market
dominated by imported products. However, knee implants manufactured by TTKH
provides massive growth prospects
are better suited to the Indian market in addition to being competitively priced.
This provides the company an edge over imported products. We believe this
segment being in the nascent stage provides immense growth prospects for the
company.
December 17, 2012
2
TTK Healthcare | Initiating coverage
Termination of condom business to improve operating margins
Short term revenue impact from
TTK-LIG, a condom manufacturing company, was a JV between TTK (parent
termination of condom business to serve
company of TTKH) and Reckitt Benckiser, wherein both the holding companies -
long term operating benefit
TTK and Reckitt Benckiser were in a tussle for over a year-and-a-half on various
management related issues. TTK bought Reckitt Benckiser’s 49.9% stake in TTK-LIG
for ~`150cr in November 2012, while the rights of Durex and Kohinoor were to
rest with Reckitt India. This would have a short term impact on the revenue of TTKH
since the condom distribution business contributed ~20% to the total revenue;
however the bottom-line would be marginally impacted owing to lower
contribution to the net profit from the business. Meanwhile, TTKH would now
distribute condoms manufactured by TTK-LIG under its own brand Skore.
Opportunity from untapped therapeutic segments
Focus on untapped therapeutic space-
TTKH is majorly present in therapeutic areas like calcium supplements,
an opportunity to expand its wings in
haematinics, cervical dilators, thrombolytic agents, rejuvenators, multimineral
pharmaceutical space
supplements, liver correctives and pain management products providing herbal
and allopathic formulations. The company has plans to foray in new therapeutic
segments like gynaecology, thyrocare, etc which have low penetration in the Indian
pharmaceutical market. The same would provide an opportunity to the company to
spread its base in the pharmaceutical space.
Strong Balance sheet
Low debt:equity and high RoIC
-
TTKH has miniscule debt in its books with a debt: equity ratio of 0.2x for the last
attractive for investors
four years. Moreover, the company has a strong RoIC profile with 73.6% RoIC and
net cash of ~`50cr for FY2012. We believe that the company would retain its high
RoIC profile at 84.5% with a net cash of `89cr for FY2014E.
December 17, 2012
3
TTK Healthcare | Initiating coverage
Financials
Exhibit 3: Key Assumptions
Revenue Growth (%)
FY2013E
FY2014E
Pharmaceuticals
15.0
15.0
Medical Devices
5.0
7.0
Consumer Products Distribution
(15.0)
3.6
Foods
110.0
50.0
Source: Angel Research
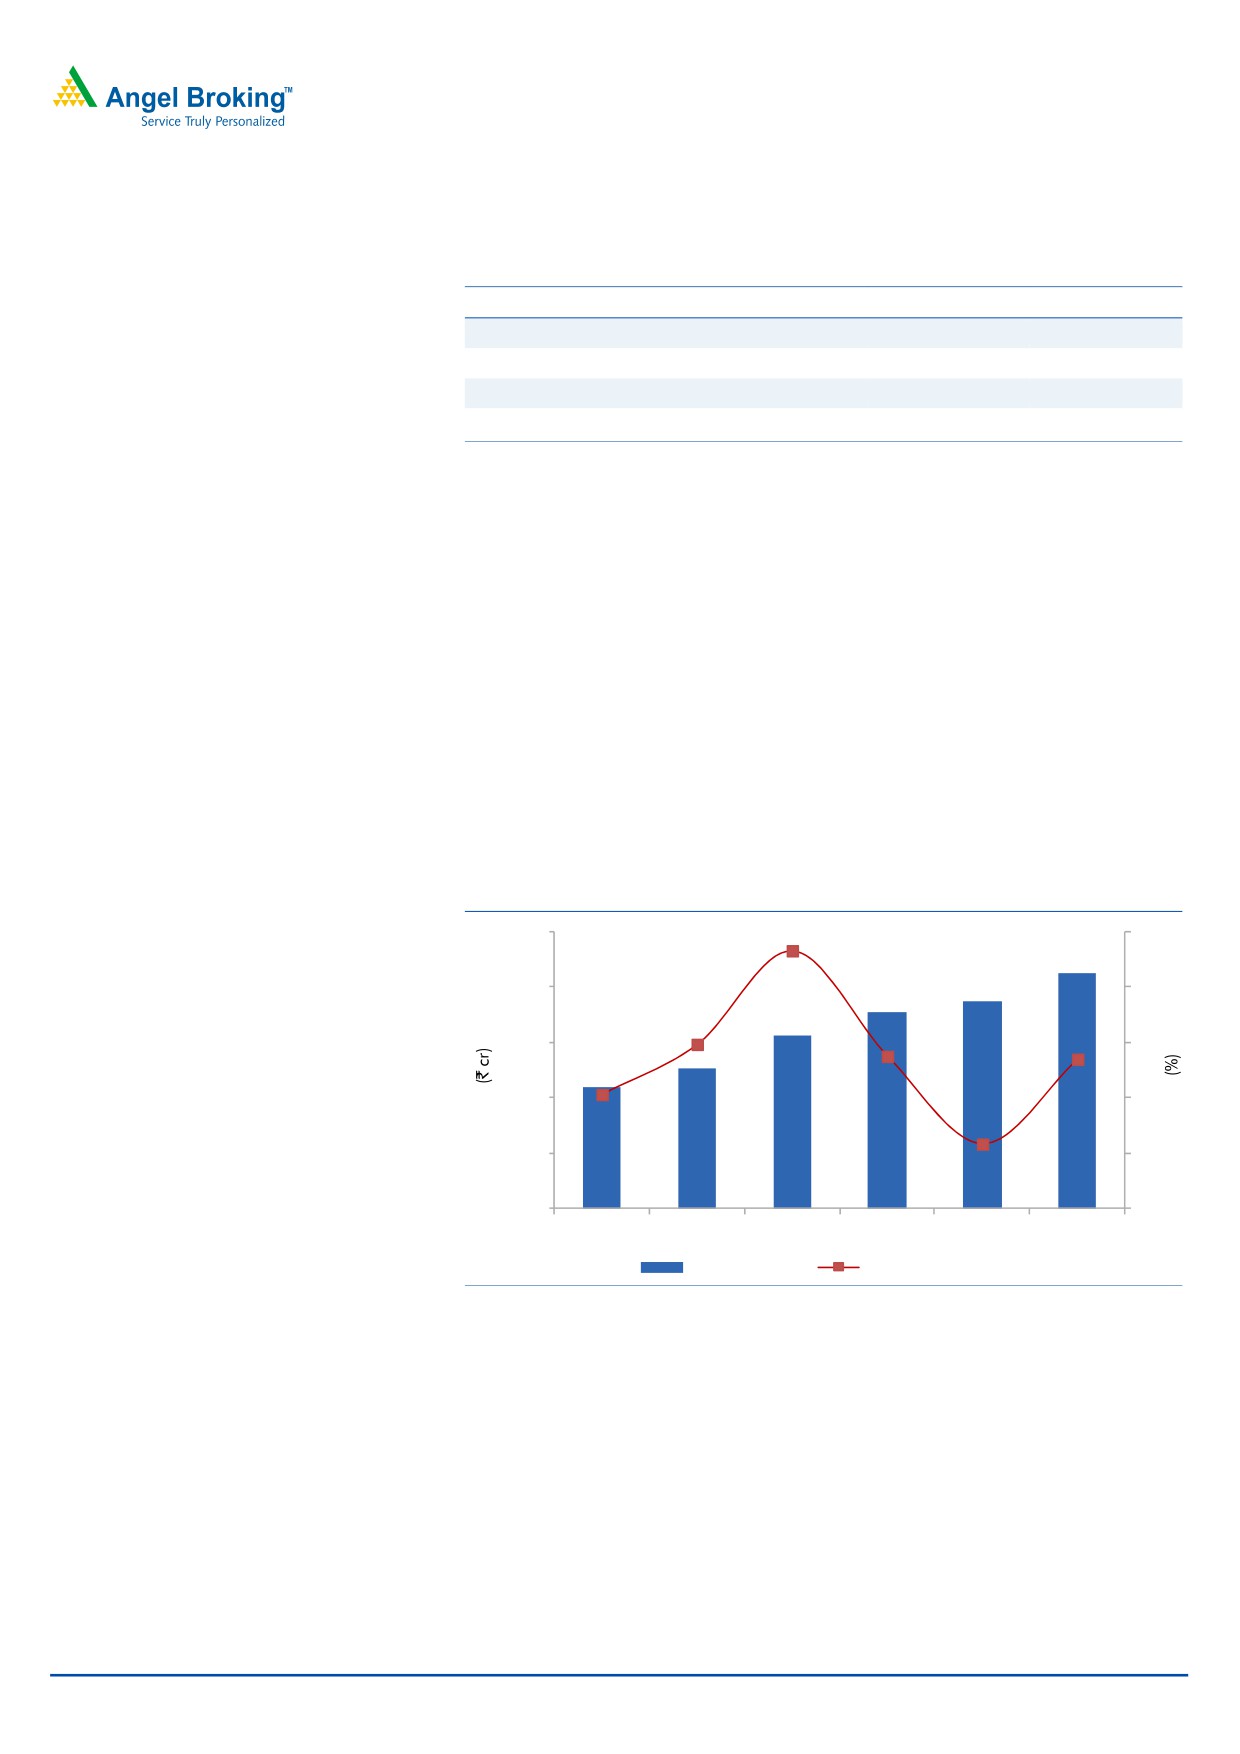
Revenue growth to witness a short-term slowdown
We expect TTKH to post a CAGR of 9.6% over FY2012-14E in its revenue to
`425cr in FY2014E. The restructuring plans of the company would lead to a short-
term slowdown in revenue growth on account of termination of condom (Durex
and Kohinoor) distribution which contributed ~20% to the company’s top-line.
Strong brands in the consumer products division like Woodward’s Gripe Water
and Eva are expected to facilitate a modest 5.8% revenue growth in FY2013E.
TTKH’s plans to sell condoms (manufactured by TTK-LIG) under its own brand
have commenced with the launch of Skore. Moreover, the company’s increased
focus on the foods business, orthopaedic implants and pharmaceutical business
would lead to recovery in revenue growth to 13.5% in FY2014E.
Exhibit 4: Revenue growth to revive in FY2014E
500
25
23.3
400
20
300
14.8
15
13.8
13.
5
200
10.3
10
5.8
100
5
220
252
311
354
374
425
0
0
FY2009
FY2010
FY2011
FY2012
FY2013E FY2014E
Revenue (LHS)
Revenue growth (RHS)
Source: Company, Angel Research
December 17, 2012
4
TTK Healthcare | Initiating coverage
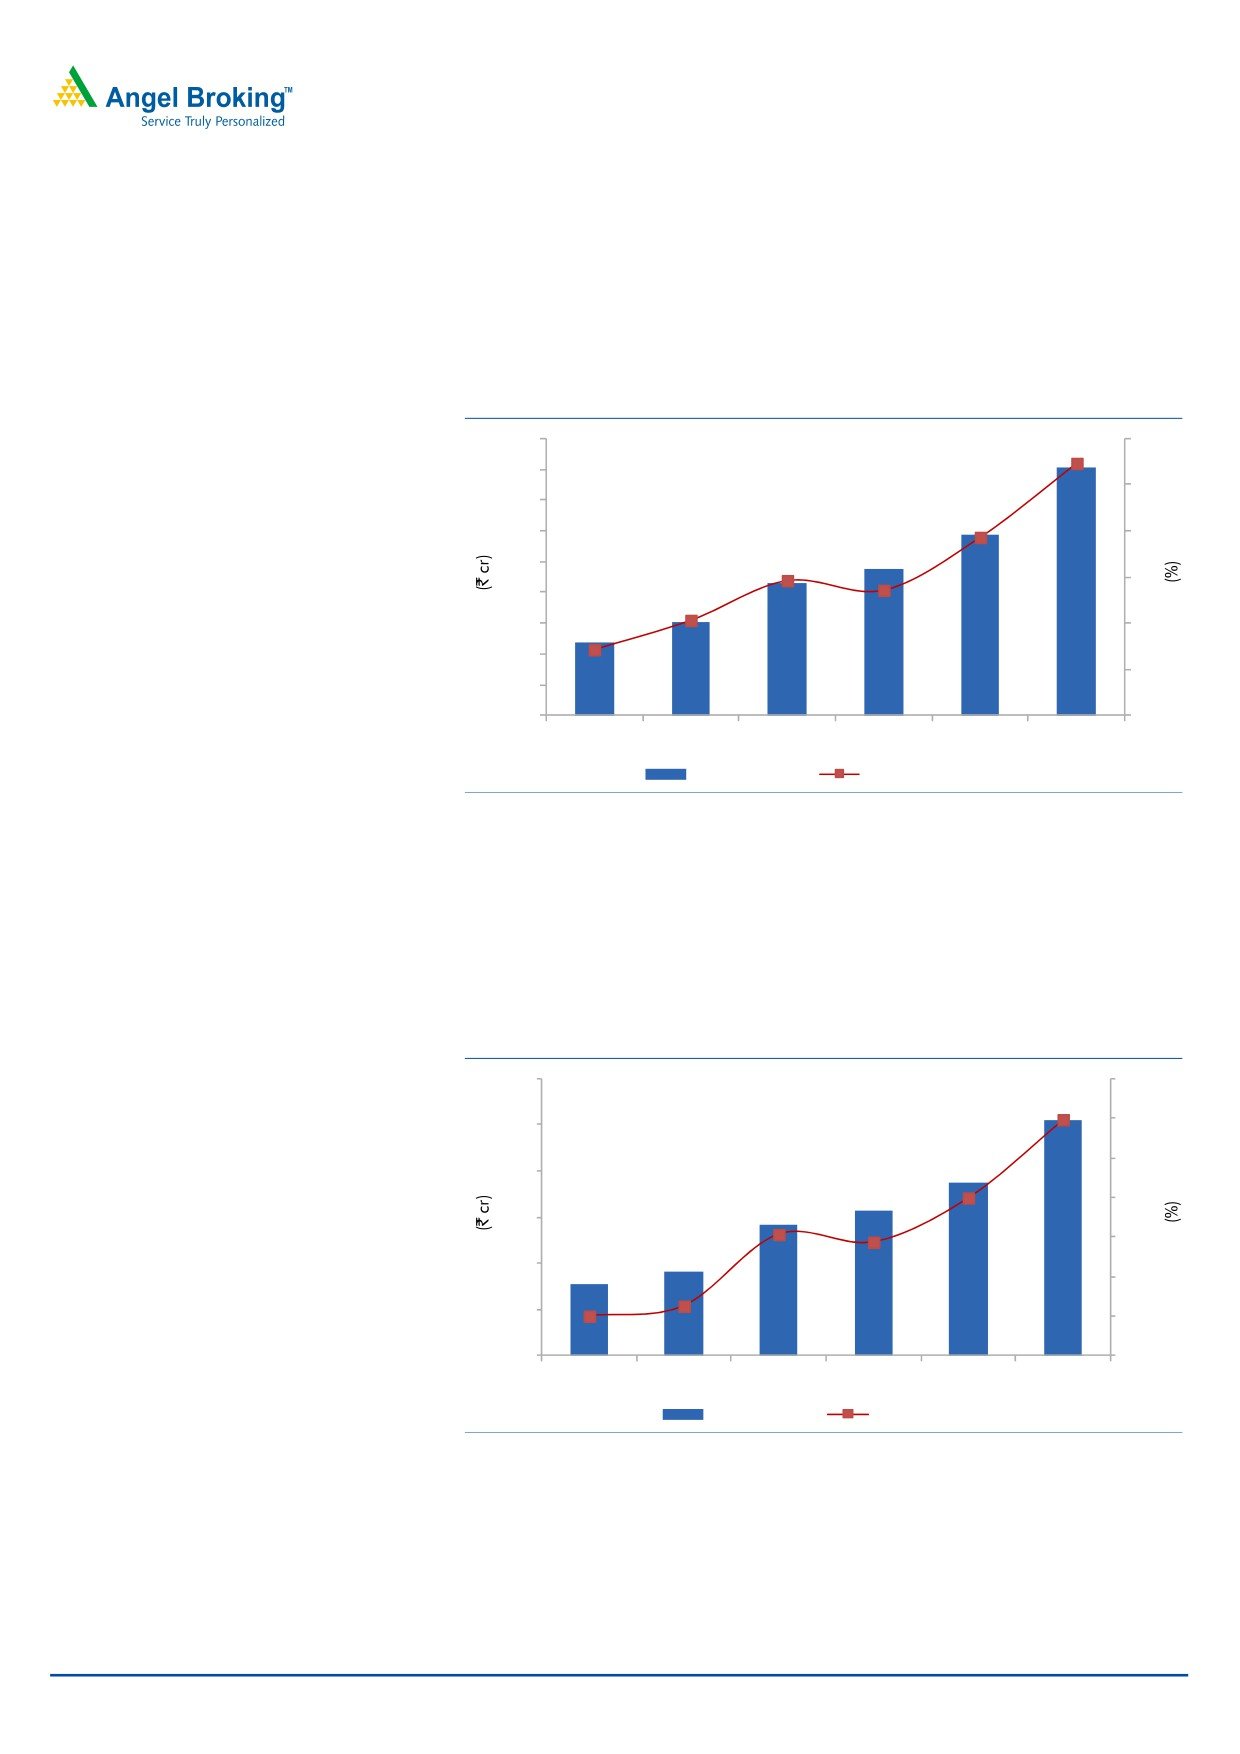
EBITDA margin to improve with focus on high margin business
TTKH’s EBITDA margin is expected to expand by 275bp over FY2012-14E to 9.5%
in FY2014E primarily due to termination of the low margin condom (Durex &
Kohinoor) distribution business and increased focus on high margin businesses like
branded foods, consumer products and pharmaceuticals.
Exhibit 5: EBITDA margin to move northwards
45
10
40
9.5
9
35
30
8
7.9
25
6.9
7
20
6.7
15
6.1
6
10
5.4
5
5
12
15
22
24
29
40
0
4
FY2009
FY2010
FY2011
FY2012
FY2013E FY2014E
EBITDA (LHS)
EBITDA margin (RHS)
Source: Company, Angel Research
Net profit margin on an uptrend
Pickup in revenue growth in FY2014E coupled with improvement in EBITDA margin
is expected to result in a 27.6% CAGR in net profit over FY2012-14E to `25cr in
FY2014E from `16cr in FY2012.
Exhibit 6: Increased focus on high margin business to improve PAT
30
6.5
6.0
6.0
25
5.5
20
5.0
5.0
15
4.5
4.5
4.4
10
4.0
5
3.6
3.5
3.5
8
9
14
16
19
25
0
3.0
FY2009
FY2010
FY2011
FY2012
FY2013E FY2014E
PAT (LHS)
PAT margin (RHS)
Source: Company, Angel Research
December 17, 2012
5
TTK Healthcare | Initiating coverage
Outlook and Valuation
We expect a modest revenue growth of
9.6% over FY2012-14E owing to
termination of distribution of Durex and Kohinoor brands of condoms since the
right of the brands has been retained by Reckitt Benckiser after TTK (Parent
company) acquired TTK-LIG in November 2012. However, with the terminated
businesses being low margin, the company would benefit on the margin front, thus
leading to an expansion in EBITDA margin by 275bp over FY2012-14E to 9.5% in
FY2014E. Consequently, the net profit is expected to post a 27.6% CAGR over
FY2012-14E to `25cr in FY2014E. At the current market price, the stock is trading
at EV/sales of 0.8x for FY2014E, which we believe is attractive. Thus, we initiate
coverage on the stock with a Buy recommendation and a target price of `643
based on a target EV/sales of 1.0x for FY2014E.
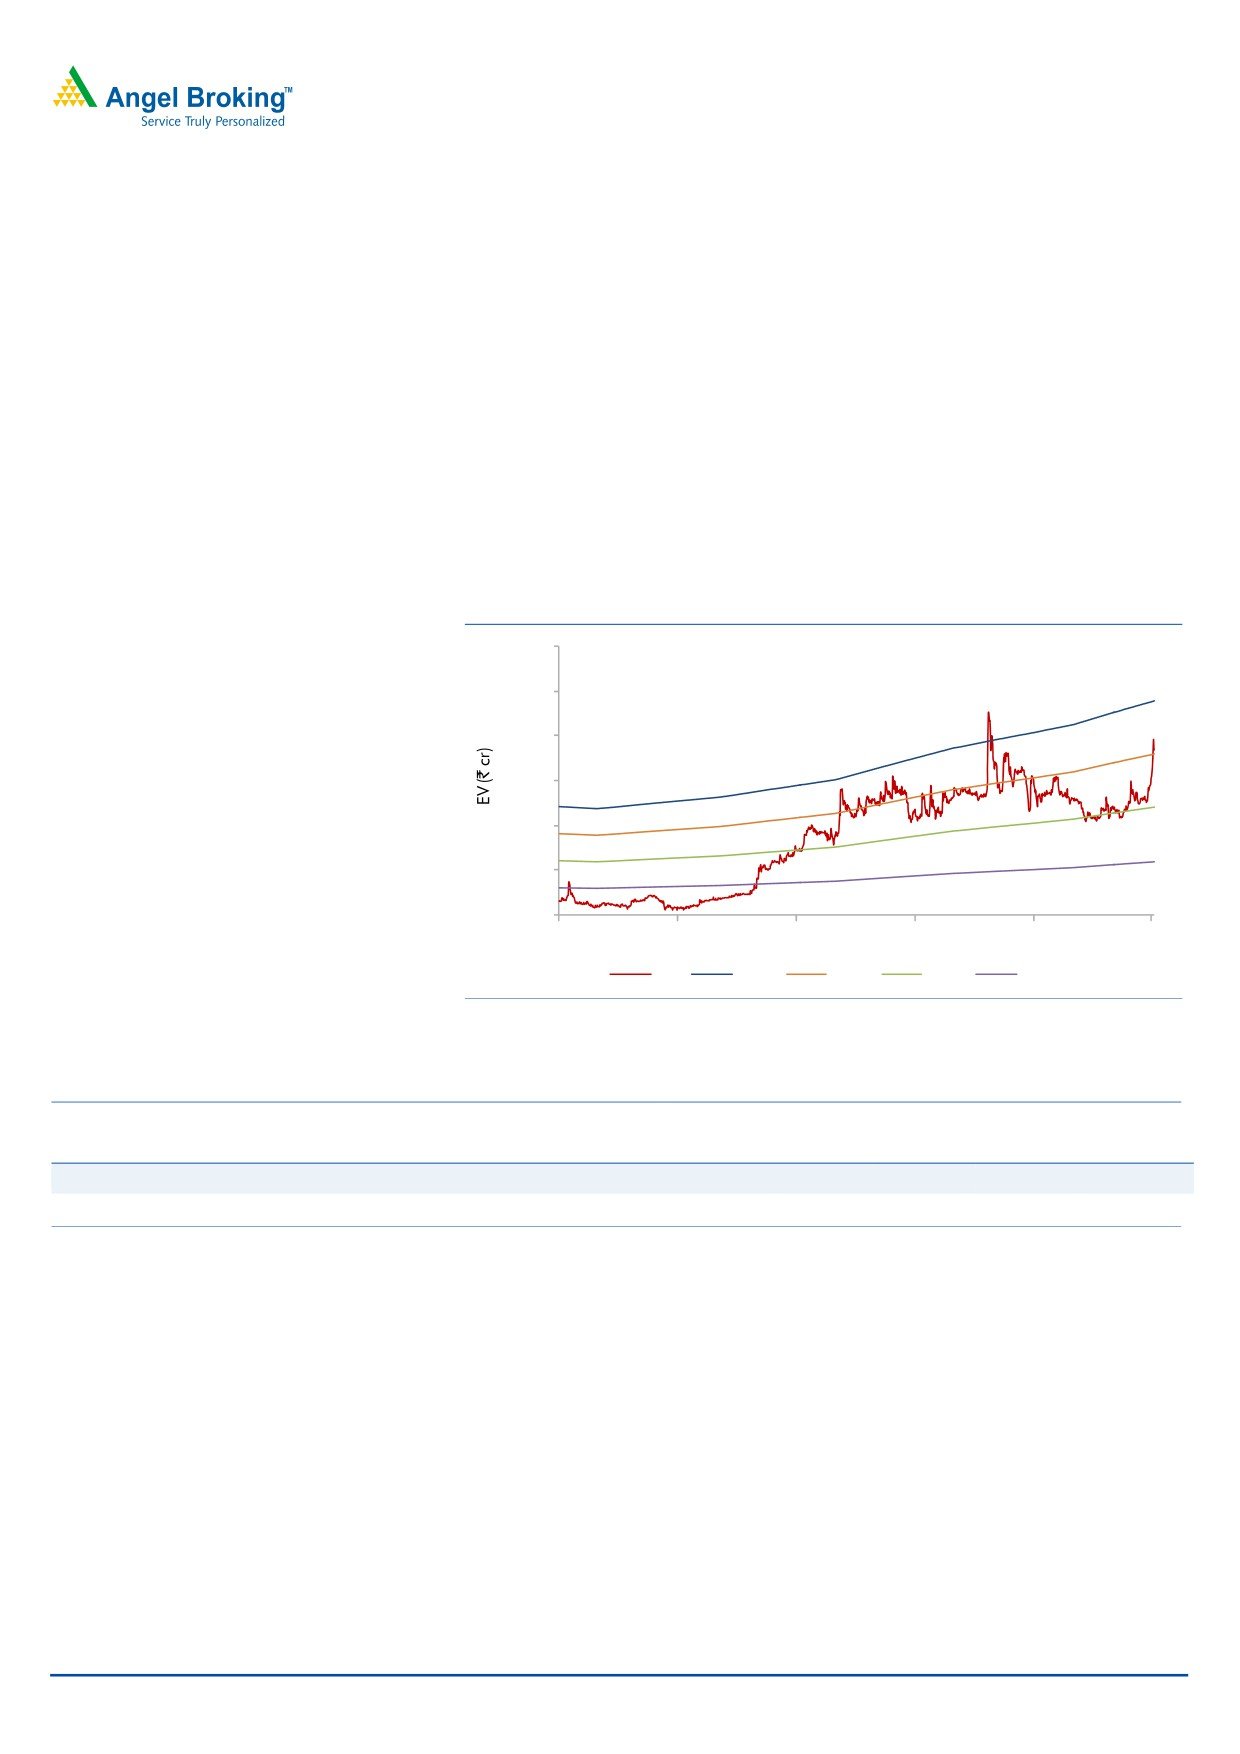
Exhibit 7: One-year forward EV/sales band
600
500
400
300
200
100
0
Dec-07
Dec-08
Dec-09
Dec-10
Dec-11
Dec-12
EV
1.2x
0.9x
0.6x
0.3x
Source: Company, Angel Research
Exhibit 8: Relative Valuation (Standalone)
Relative
Net Sales
OPM
PAT
EPS
RoE
P/E
P/BV
EV/EBITDA
EV/sales
TTM ended Sep’12
(` cr)
(%)
(` cr)
(`)
(%)
(x)
(x)
(x)
(x)
TTKH
378
6.6
17
110.8
17.3
25.6
4.4
15.0
1.0
Amrutanjan Health
117
15.8
13
43.5
12.3
17.8
2.2
9.0
1.4
Source: Company, Angel Research
Key concerns
High attrition rate in Pharmaceutical division: The growth of the Pharmaceutical
division is dependent on its manpower. High rate of attrition prevalent in the
division could hamper the growth of the company.
Failure to revive Heart valve division: The performance of the heart valve division
had been impacted during FY2012 due to lower off-takes under the Government -
sponsored Welfare Programmes. Failure to retain volumes in the division could
hamper company’s growth.
December 17, 2012
6
TTK Healthcare | Initiating coverage
Company Background
TTK Healthcare, a part of the TTK group, is involved in different business like
pharmaceuticals, consumer products, biomedical devices and foods.
Exhibit 9: Segmental Revenue & EBIT
FY2008
FY2009
FY2010
FY2011
FY2012
Revenue (` cr)
Pharmaceuticals
98
114
127
153
178
Medical Devices
13
16
19
20
17
Consumer Products Distribution
79
80
96
125
141
Condoms
43
45
49
59
63
EVA & others
36
35
46
66
78
Foods
-
-
9
10
13
Others
10
10
2
4
4
Total
200
220
252
311
354
EBIT (` cr)
Pharmaceuticals
11
14
16
24
26
Medical Devices
1
7
8
7
4
Consumer Products Distribution
(1)
(4)
(2)
(1)
0
Foods
-
-
(1)
(0)
(0)
Others
1
(1)
(1)
(1)
(0)
EBIT margin (%)
Pharmaceuticals
11.7
12.4
13.0
15.4
14.7
Medical Devices
5.8
44.4
41.4
35.7
24.4
Consumer Products Distribution
-
-
-
-
0.2
Foods
-
-
-
-
-
Others
11.8
-
-
-
-
Source: Company
Pharmaceutical Division: This division is present across various therapeutic
segments like calcium supplements, haematinics, cervical dilators, thrombolytic
agents, rejuvenators, multimineral supplements, liver correctives and pain
management products providing herbal and allopathic formulations. Besides
these, the company also caters to the requirements of veterinarians, hatcheries,
poultry farms and dairy farms through a variety of herbal and allopathic
formulations.
Consumer Products Division: The Consumer Products Division (CPD) markets and
distributes Woodward's Gripe Water - the undisputed market leader in the baby
care category - and the recently introduced Woodward's Baby Soap. The division
also markets the Eva range of deodorants and talcum powders in a variety of
fragrances such as fresh, doll, dreams, sweet, zing, chic and wow. The CPD has
introduced many variations in packaging and has also forayed into the skincare
segment with a new range of moisturizers which is backed by the expertise of TTK's
Research.
The division was involved in the distribution of Durex and Kohinoor condoms which
were imported from TTK-LIG, a JV between TTK group and Reckitt Benckiser. Post
the acquisition of TTK-LIG by TTKH, the rights of Durex and Kohinoor were retained
December 17, 2012
7
TTK Healthcare | Initiating coverage
by Reckitt Benckiser, which resulted in termination of sale of condoms by TTKH.
However, the division still distributes Brylcreem haircare and toiletry products and
Kiwi's shoe care range.
Biomedical devices: This division manufactures and distributes indigenous heart
valve prosthesis- the tilting-disc TTK Chitra Heart Valve. This is the only Indian
made price friendly heart-valve and ~18,000 Chitra valves have been successfully
implanted in patients. The division also manufactures and markets Clinimesh - a
versatile prosthesis for surgical reconstruction of thoracic and abdominal wall
defects. The biomedical devices division also manufactures high-quality
orthopaedic implants and instruments under the brand name "Altius".
Foods: This division manufactures potato and cereal based pellets for domestic
and international markets. The cereal and potato based pellets come in various
shapes, such as wheels (mini & penta), tubes (mini, short, long & square), sticks, 3
rings, ribbed, star, checks, chips, drops etc besides onion rings. The customer base
for TTK ready-to-fry snack pellets includes multinationals and the trade in India.
The exports division services the foreign countries and the products are regularly
exported to the overseas markets.
December 17, 2012
8
TTK Healthcare | Initiating coverage
Profit & Loss Statement
Y/E March (` cr)
FY2010
FY2011
FY2012
FY2013E
FY2014E
Gross sales
252
311
354
374
425
Less: Excise duty
0
0
-
-
-
Net Sales
252
311
354
374
425
% chg
14.8
23.3
13.8
5.8
13.5
Net Raw Materials
134
163
186
183
196
Personnel
30
37
44
50
57
Other expenses
72
90
100
112
132
Total Expenditure
237
289
330
345
385
EBITDA
15
22
24
29
40
% chg
28.2
40.8
10.3
23.9
36.6
(% of Net Sales)
6.1
6.9
6.7
7.9
9.5
Depreciation
2
2
2
3
4
EBIT
13
20
21
26
36
% chg
32.4
45.1
9.4
22.2
37.9
(% of Net Sales)
5.3
6.3
6.1
7.0
8.5
Interest & other charges
2
2
3
3
3
Other Income
4
4
5
5
5
(% of Net sales)
1.5
1.4
1.3
1.3
1.2
PBT
16
22
24
28
38
% chg
21.3
21.3
21.3
21.3
21.3
Tax
6
7
8
9
13
(% of PBT)
41.1
33.5
33.6
33.5
33.5
PAT (reported)
9
15
16
19
25
Extraordinary (Exp)/Inc.
(0)
1
(0)
-
-
ADJ. PAT
9
14
16
19
25
% chg
19.0
54.1
11.3
19.2
36.0
(% of Net Sales)
3.6
4.5
4.4
5.0
6.0
Basic EPS (`)
11.8
19.0
20.1
24.1
32.7
Fully Diluted EPS (`)
11.8
19.0
20.1
24.1
32.7
% chg
16.7
61.3
6.0
19.7
36.0
December 17, 2012
9
TTK Healthcare | Initiating coverage
Balance Sheet
Y/E March (` cr)
FY2010
FY2011
FY2012
FY2013E
FY2014E
SOURCES OF FUNDS
Equity Share Capital
8
8
8
8
8
Reserves& Surplus
52
63
75
90
111
Revaluation Reserves
5
5
5
5
5
Shareholders’ Funds
65
76
88
102
124
Total Loans
14
13
18
20
21
Deferred Tax Liability (Net)
2
2
2
2
2
Other Long-term liabilities
-
7
8
8
8
Total Liabilities
81
98
116
132
154
APPLICATION OF FUNDS
Gross Block
46
56
60
67
82
Less: Acc. Depreciation
22
24
26
29
34
Net Block
24
33
33
38
48
Capital Work-in-Progress
6
5
6
7
6
Investments
8
7
7
7
7
Long term Loans & adv
-
1
1
1
1
Current Assets
116
147
166
180
205
Cash
49
61
62
79
89
Loans & Advances
21
27
34
34
40
Inventory
23
27
33
30
35
Debtors
23
32
37
37
42
Other current assets
-
-
-
-
-
Current liabilities
73
95
97
101
112
Net Current Assets
42
52
68
80
93
Misc. Exp. not written off
-
-
-
-
-
Total Assets
81
98
116
132
154
December 17, 2012
10
TTK Healthcare | Initiating coverage
Cash Flow Statement
Y/E March (` cr)
FY2010
FY2011
FY2012 FY2013E FY2014E
Profit before tax
16
22
24
28
38
Depreciation
2
2
2
3
4
Change in Working Capital
6
2
(15)
6
(3)
Other income
(4)
(4)
(5)
(5)
(5)
Direct taxes paid
(6)
(7)
(8)
(9)
(13)
Others
6
11
8
-
-
Cash Flow from Operations
19
25
6
23
22
(Inc.)/Dec. in Fixed Assets
(11)
(9)
(4)
(8)
(14)
(Inc.)/Dec. in Investments
-
(1)
(0)
-
-
(Inc.)/Dec. in L.T. Loans & advances
-
(1)
0
-
-
Other income
4
4
5
5
5
Others
(4)
0
(5)
-
-
Cash Flow from Investing
(11)
(7)
(4)
(3)
(9)
Issue of Equity
(0)
-
-
-
-
Inc./(Dec.) in loans
(1)
(1)
5
2
1
Inc./(Dec.) in Other long term liabilities
-
7
1
-
-
Dividend Paid (Incl. Tax)
(3)
(4)
(4)
(4)
(4)
Others
(4)
(9)
(3)
-
-
Cash Flow from Financing
(9)
(7)
(1)
(2)
(3)
Inc./(Dec.) in Cash
(1)
11
1
17
10
Opening Cash balances
50
49
61
62
79
Closing Cash balances
49
61
62
79
89
December 17, 2012
11
TTK Healthcare | Initiating coverage
Key Ratios
Y/E March (` cr)
FY2010
FY2011
FY2012
FY2013E
FY2014E
Valuation Ratio (x)
P/E (on FDEPS)
46.8
29.0
27.4
22.9
16.8
P/CEPS
46.8
29.0
27.4
22.9
16.8
P/BV
6.6
5.7
4.9
4.2
3.5
Dividend yield (%)
0.6
0.7
0.7
0.8
0.8
EV/Sales
1.5
1.2
1.1
1.0
0.8
EV/EBITDA
25.1
17.3
15.9
12.3
8.8
EV / Total Assets
4.8
3.8
3.3
2.7
2.3
Per Share Data (`)
EPS (Basic)
11.8
19.0
20.1
24.1
32.7
EPS (fully diluted)
11.8
19.0
20.1
24.1
32.7
Cash EPS
14.1
21.5
23.1
28.3
38.0
DPS
3.5
4.0
4.0
4.5
4.5
Book Value
83.2
97.5
112.9
131.7
159.1
Dupont Analysis
EBIT margin
5.3
6.3
6.1
7.0
8.5
Tax retention ratio
0.6
0.7
0.7
0.7
0.7
Asset turnover (x)
3.2
3.5
3.3
3.0
3.0
ROIC (Post-tax)
10.0
14.6
13.3
14.1
16.8
Cost of Debt (Post Tax)
7.0
8.8
10.9
10.0
9.7
Leverage (x)
(0.7)
(0.7)
(0.6)
(0.6)
(0.6)
Operating ROE
24.7
35.3
33.8
34.2
39.6
Returns (%)
ROCE (Pre-tax)
16.9
21.9
20.1
21.1
25.2
Angel ROIC (Pre-tax)
66.9
91.9
73.6
71.1
84.5
ROE
14.4
20.1
19.2
19.7
22.5
Turnover ratios (x)
Asset Turnover (Gross Block)
5.8
6.1
6.1
5.9
5.7
Inventory / Sales (days)
31
29
31
31
28
Receivables (days)
32
32
36
36
36
Payables (days)
103
106
106
106
106
WC cycle (ex-cash) (days)
(6)
(9)
(1)
4
2
Solvency ratios (x)
Net debt to equity
(0.7)
(0.7)
(0.6)
(0.6)
(0.6)
Net debt to EBITDA
(2.8)
(2.5)
(2.1)
(2.2)
(1.9)
Interest Coverage (EBIT / Interest)
7.7
10.8
8.4
9.2
12.2
December 17, 2012
12
TTK Healthcare | Initiating coverage
Research Team Tel: 022 - 39357800
DISCLAIMER
This document is solely for the personal information of the recipient, and must not be singularly used as the basis of any investment
decision. Nothing in this document should be construed as investment or financial advice. Each recipient of this document should make
such investigations as they deem necessary to arrive at an independent evaluation of an investment in the securities of the companies
referred to in this document (including the merits and risks involved), and should consult their own advisors to determine the merits and
risks of such an investment.
Angel Broking Limited, its affiliates, directors, its proprietary trading and investment businesses may, from time to time, make
investment decisions that are inconsistent with or contradictory to the recommendations expressed herein. The views contained in this
document are those of the analyst, and the company may or may not subscribe to all the views expressed within.
Reports based on technical and derivative analysis center on studying charts of a stock's price movement, outstanding positions and
trading volume, as opposed to focusing on a company's fundamentals and, as such, may not match with a report on a company's
fundamentals.
The information in this document has been printed on the basis of publicly available information, internal data and other reliable
sources believed to be true, but we do not represent that it is accurate or complete and it should not be relied on as such, as this
document is for general guidance only. Angel Broking Limited or any of its affiliates/ group companies shall not be in any way
responsible for any loss or damage that may arise to any person from any inadvertent error in the information contained in this report.
Angel Broking Limited has not independently verified all the information contained within this document. Accordingly, we cannot testify,
nor make any representation or warranty, express or implied, to the accuracy, contents or data contained within this document. While
Angel Broking Limited endeavours to update on a reasonable basis the information discussed in this material, there may be regulatory,
compliance, or other reasons that prevent us from doing so.
This document is being supplied to you solely for your information, and its contents, information or data may not be reproduced,
redistributed or passed on, directly or indirectly.
Angel Broking Limited and its affiliates may seek to provide or have engaged in providing corporate finance, investment banking or
other advisory services in a merger or specific transaction to the companies referred to in this report, as on the date of this report or in
the past.
Neither Angel Broking Limited, nor its directors, employees or affiliates shall be liable for any loss or damage that may arise from or in
connection with the use of this information.
Note: Please refer to the important `Stock Holding Disclosure' report on the Angel website (Research Section). Also, please refer to the
latest update on respective stocks for the disclosure status in respect of those stocks. Angel Broking Limited and its affiliates may have
investment positions in the stocks recommended in this report.
Disclosure of Interest Statement
TTK Healthcare
1. Analyst ownership of the stock
No
2. Angel and its Group companies ownership of the stock
No
3. Angel and its Group companies' Directors ownership of the stock
No
4. Broking relationship with company covered
No
Note: We have not considered any Exposure below ` 1 lakh for Angel, its Group companies and Directors
Ratings (Returns):
Buy (> 15%)
Accumulate (5% to 15%)
Neutral (-5 to 5%)
Reduce (-5% to -15%)
Sell (< -15%)
December 17, 2012
13
TTK Healthcare | Initiating coverage
6th Floor, Ackruti Star, Central Road, MIDC, Andheri (E), Mumbai- 400 093. Tel: (022) 39357800
Research Team
Fundamental:
Sarabjit Kour Nangra
VP-Research, Pharmaceutical
Vaibhav Agrawal
VP-Research, Banking
Bhavesh Chauhan
Sr. Analyst (Metals & Mining)
Viral Shah
Sr. Analyst (Infrastructure)
Sharan Lillaney
Analyst (Mid-cap)
V Srinivasan
Analyst (Cement, FMCG)
Yaresh Kothari
Analyst (Automobile)
Ankita Somani
Analyst (IT, Telecom)
Sourabh Taparia
Analyst (Banking)
Bhupali Gursale
Economist
Vinay Rachh
Research Associate
Amit Patil
Research Associate
Shareen Batatawala
Research Associate
Twinkle Gosar
Research Associate
Tejashwini Kumari
Research Associate
Technicals:
Shardul Kulkarni
Sr. Technical Analyst
Sameet Chavan
Technical Analyst
Sacchitanand Uttekar
Technical Analyst
Derivatives:
Siddarth Bhamre
Head - Derivatives
Institutional Sales Team:
Mayuresh Joshi
VP - Institutional Sales
Hiten Sampat
Sr. A.V.P- Institution sales
Meenakshi Chavan
Dealer
Gaurang Tisani
Dealer
Akshay Shah
Sr. Executive
Production Team:
Tejas Vahalia
Research Editor
Dilip Patel
Production
Angel Broking Ltd: BSE Sebi Regn No : INB 010996539 / CDSL Regn No: IN - DP - CDSL - 234 - 2004 / PMS Regn Code: PM/INP000001546 Angel Securities Ltd:BSE: INB010994639/INF010994639 NSE: INB230994635/INF230994635 Membership numbers: BSE 028/NSE:09946
Angel Capital & Debt Market Ltd: INB 231279838 / NSE FNO: INF 231279838 / NSE Member code -12798 Angel Commodities Broking (P) Ltd: MCX Member ID: 12685 / FMC Regn No: MCX / TCM / CORP / 0037 NCDEX : Member ID 00220 / FMC Regn No: NCDEX / TCM / CORP / 0302
December 17, 2012
14