Initiating coverage | FMCG
December 19, 2011
Tata Global Beverages
BUY
CMP
`84
Poised to perform
Target Price
`97
Tata Global Beverages Limited (TGBL) is an emerging player in the global
Investment Period
12 Months
beverage market. The company has made a strategic shift from being a local tea
Stock Info
company to a global beverage company through various acquisitions and
Sector
FMCG
strategic partnerships with global beverage giants like PepsiCo and Starbucks. As
a result, the company has made an entry into the top 10 global companies list in
Market Cap (` cr)
5,219
the hot drinks category, posing a challenge to global players like Nestlé, Unilever
Beta
1.0
and Kraft Foods. The company’s product portfolio comprises leading global
52 Week High / Low
120/80
brands like Tetley, Eight O’ Clock and local brands like Tata Tea.
Avg. Daily Volume
294,179
Bottomed-out margins; expect a positive surprise: We model in TGBL’s OPM to
Face Value (`)
1
improve by ~150bp over FY2011-13E from 8.6% in FY2011 to ~10.1% in
BSE Sensex
15,391
FY2013E, driven by a shift in the company’s focus from the plantation business to
Nifty
4,613
branded products and rationalization in the operating cost structure. While
Reuters Code
TAGL.BO
TGBL’s focus on volume growth remains intact, selective price increases and
Bloomberg Code
TGBL@IN
stable ad spends will further aid in margin improvement. Also, with the Tea Board
of India estimating higher tea production in 2011 as compared to 2010 (~5%
higher production), we expect auction prices of tea to soften, thereby providing a
Shareholding Pattern (%)
relief to the company from heightened input cost pressure.
Promoters
35.2
Estimate ~40% plus adjusted EPS CAGR over FY2011-13E: We model a ~40%
MF / Banks / Indian Fls
33.4
EPS CAGR over FY2011-13, led by (1) 9% revenue growth and (2) a ~150bp
FII / NRIs / OCBs
9.8
margin improvement. We believe the company is set to outperform the industry’s
Indian Public / Others
21.6
growth, with the help of selective price increases and strong brands like Tata Tea
Premium, Tata Tea Gold, Agni Dust and Kanan Devan.
Key valuation trigger: Despite its leadership position in the Indian packaged tea
Abs. (%)
3m 1yr
3yr
market, No. 2 position in the global tea market and generating ~90% of its total
Sensex
(10.0)
(22.5)
52.7
revenue from branded products, TGBL is trading at 12.2x FY2013E EPS (which is
TGBL
(7.8)
(26.4)
54.8
at a discount to its FMCG peers, trading at 20x-35x FY2013E EPS). Also, on
EV/Sales basis, the stock is trading at 0.6x FY2013E EV/Sales (historical average
of 1x EV/ Sales). Hence, we initiate coverage on the stock with a Buy
recommendation and a target price of `97, based on 14x FY2013E EPS of
`6.9(0.8x FY2013 EV/Sales).
Key financials (Consolidated)
Y/E March (` cr)
FY2010
FY2011
FY2012E
FY2013E
Net Sales
5,784
5,984
6,522
7,110
% chg
19.3
3.5
9.0
9.0
Net Profit
390
254
336
427
% chg
73.2
(34.8)
32.1
27.2
EBITDA (%)
8.9
8.6
9.2
10.1
EPS (`)
6.2
3.4
5.4
6.9
P/E (x)
14.5
26.4
16.6
12.2
P/BV (x)
1.5
1.4
1.4
1.3
RoE (%)
10.4
5.4
8.4
10.2
RoCE (%)
6.2
6.7
8.0
9.6
Sreekanth P.V.S
EV/Sales (x)
0.9
0.8
0.7
0.6
022-39357800 Ext: 6841
EV/EBITDA (x)
10.8
8.9
8.6
8.6
Source: Company, Angel Research
Please refer to important disclosures at the end of this report
1
Tata Global Beverages | Initiating coverage
Investment thesis
Fast emerging global beverage player
Among the top 10 global players in the
TGBL, led by its various acquisitions in recent years, has become a global
hot drinks category, posing a challenge
non-alcoholic beverage company. The company now features among the global
to Nestlé, Kraft Foods and Unilever,
top 10 players list in the hot drinks category.
among others.
Exhibit 1: Top-10 Global players (%Off-trade value) - Hot drinks category
Company
2005
2010
Nestlé SA
15.1
15.2
Kraft Foods Inc.
7.9
7.8
Unilever Group
4.5
4.4
Sara Lee Corp
3.2
3.4
Tchibo GmbH
1.8
1.6
Tata Global Beverages Ltd
-
1.3
Associated British Foods Plc (ABF)
1.4
1.3
JM Smucker Co, The
-
1.2
Strauss Group Ltd
0.1
1.2
Lavazza SpA, Luigi
1.2
1.1
Source: Euromonitor International, Angel Research
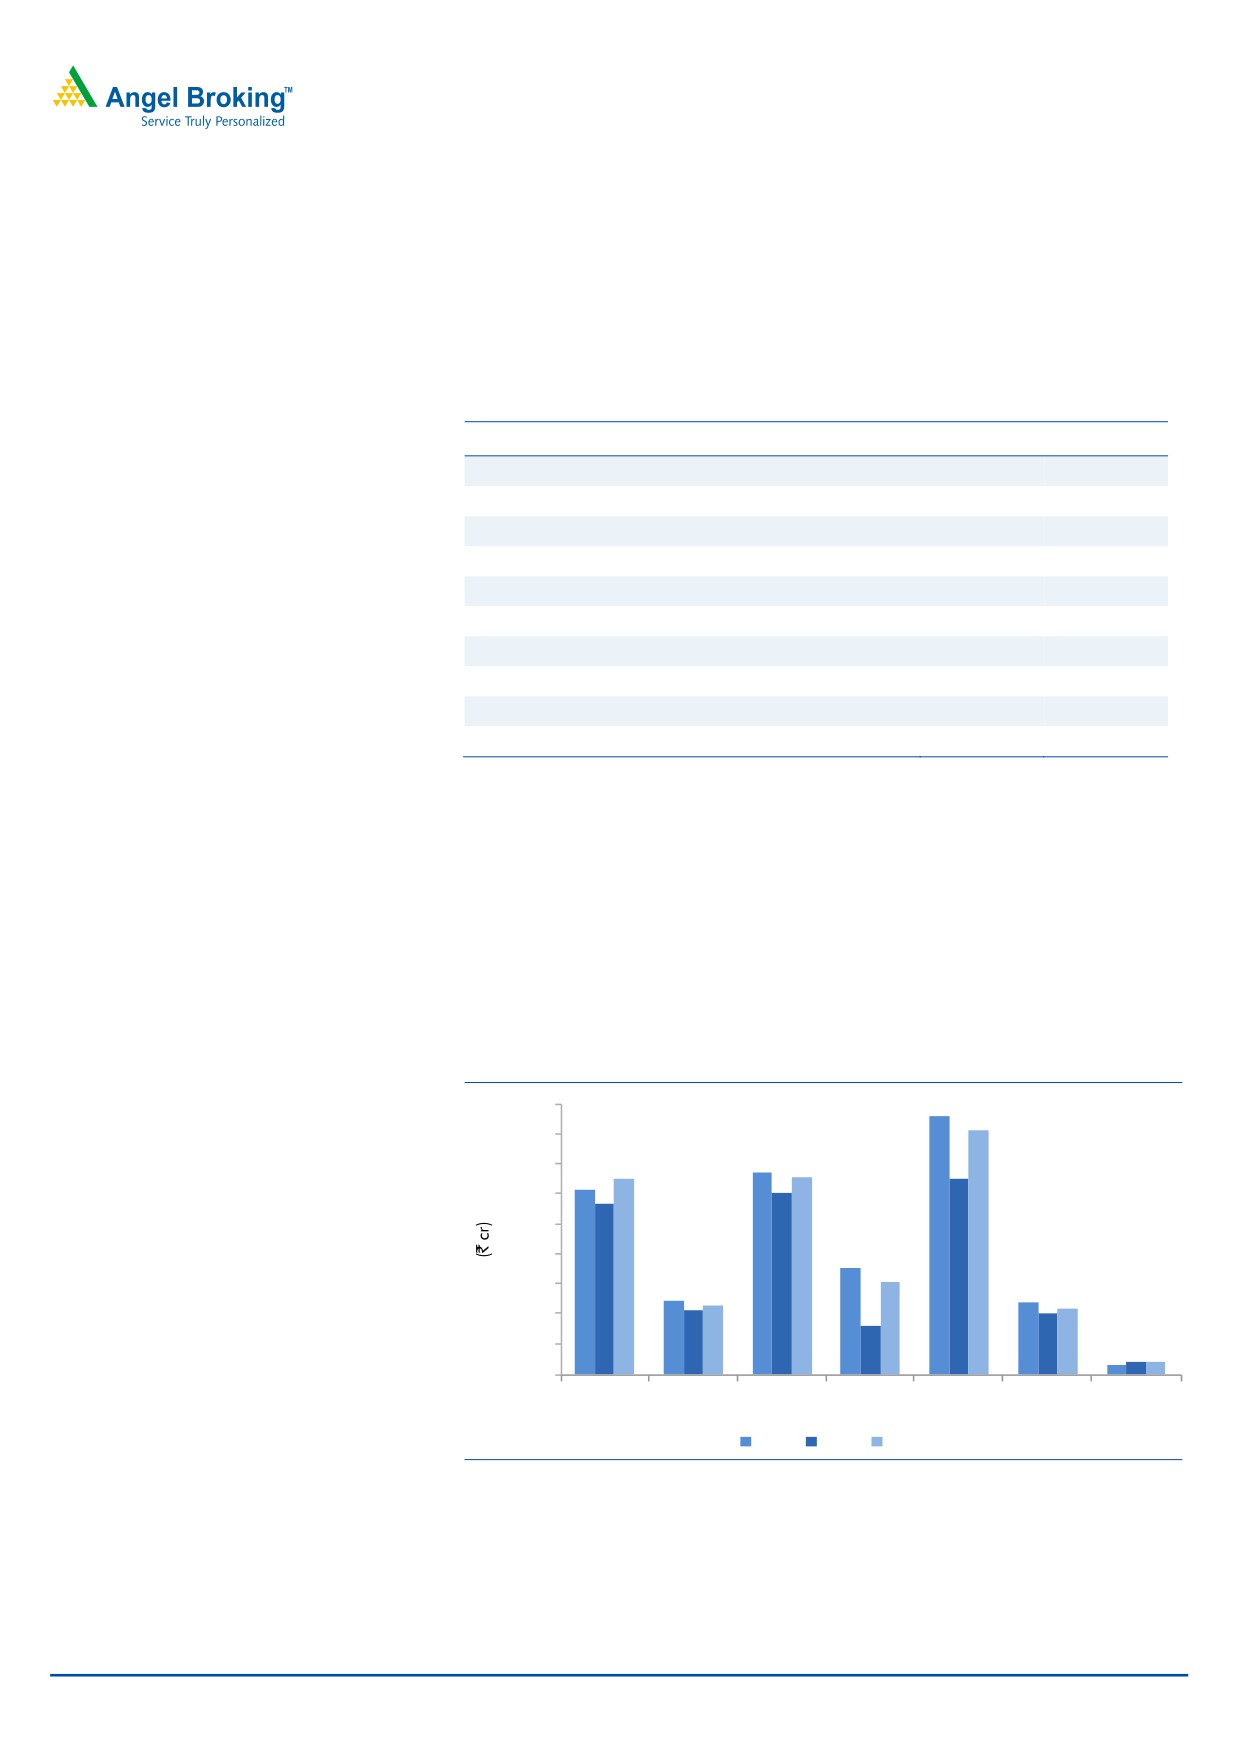
Spreading its wings across the globe
TGBL has a very ambitious plan to generate revenue of US$5bn by 2015, which it
may fall short of due to the slow growth in its key categories (tea and coffee) and
slowdown due to the ongoing global as well as local macroeconomic scenario.
The company has a commanding position in the tea and coffee categories in
North America and South Asia. With leadership positions in India, UK and Canada
in the tea market, TGBL has been consistent in maintaining its market share.
Exhibit 2: TGBL’s increasing global footprint in beverages
1,800
1,600
1,400
1,200
1,000
800
600
400
200
0
USA Canada &
UK & Africa Europe & South Asia
Non
Others
Australia
ME
Branded
2011
2009
2010
Source: Company, Angel Research
December 19, 2011
2
Tata Global Beverages | Initiating coverage
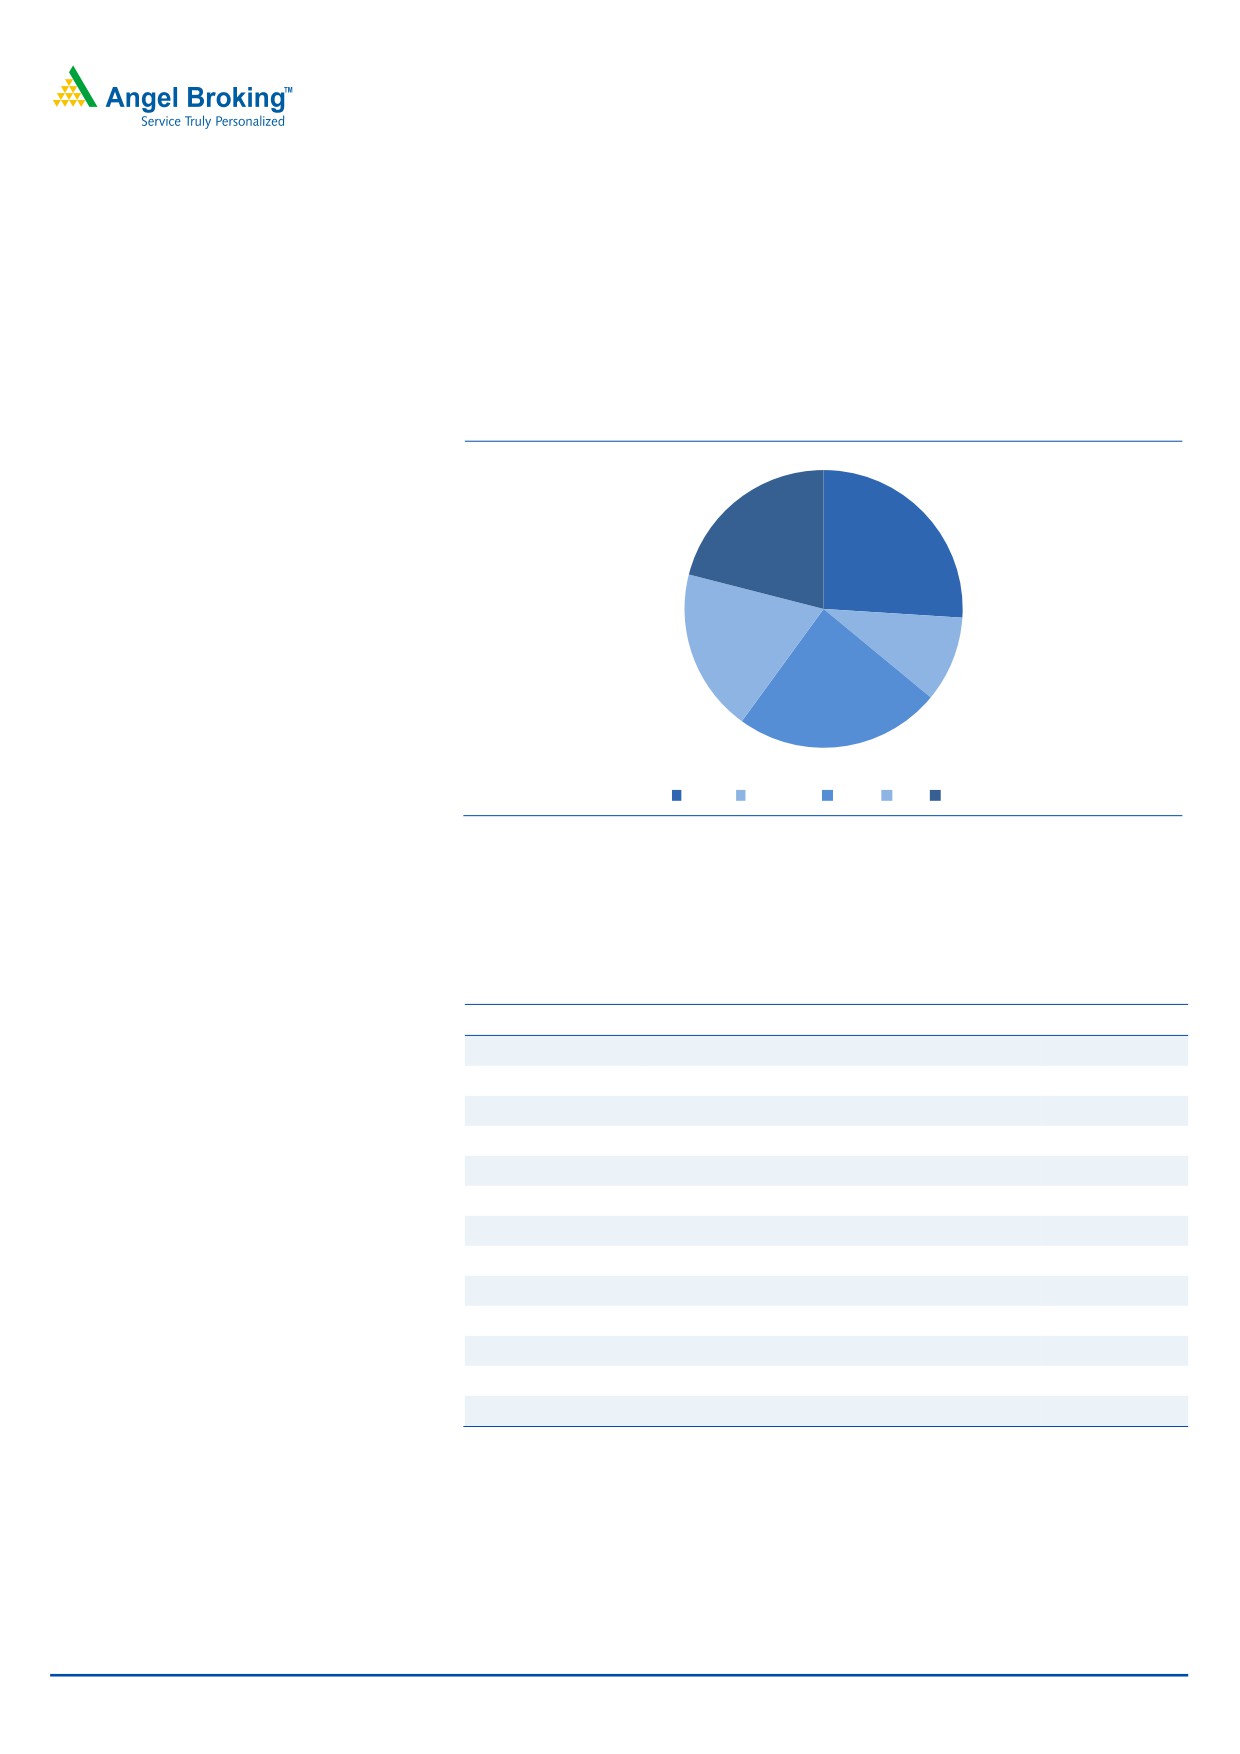
The company generates over 70% of its
During FY2011, TGBL reported more than 70% of its revenue from outside India.
consolidated sales from outside India.
The company has a leadership position in the tea and coffee markets in several
countries. The company is the second largest global tea marketing company and
the third largest player (post acquisition of Eight O’ Clock coffee through its
Branded products constitute 90% of the
subsidiary Tata Coffee) in the branded coffee market in the US.
company’s top line.
Exhibit 3: TGBL’s country-wise sales of hot drinks in CY10 (% retail value)
21
26
19
10
24
India Canada USA UK Others
Source: Euromonitor International, Angel Research
Apart from being among the leaders in global tea markets, TGBL’s leadership in
the Indian tea market has also been increasing. Currently, iconic brands like Tata
Tea, Kanan Devan and Tetley feature among the top tea brands in the country.
Exhibit 4: Top tea brand shares in India (% retail value)
Brand
Company
CY2010
Tata Tea
TGBL
19.7
Brooke Bond
HUL
19.1
Duncans
Duncans Industries
8.6
Lipton
HUL
6.2
Wagh Bakri
Wagh Bakri
3.5
Kanan Devan
TGBL
3.3
Goodricke
Goodricke Group
1.5
Twinings
Twinings Pvt Ltd
1.2
Golden Tips
Golden Tips Tea Co
1.1
Girnar
Girnar Food & Beverages
1
Jay Green Tea
Jay Shree Tea
0.7
Tetley
TGBL
0.5
Kho-Cha
Kho-Cha Darjeeling Tea Bureau
0.2
Source: Euromonitor International, Angel Research
December 19, 2011
3
Tata Global Beverages | Initiating coverage
Bottomed-out margins; expect a positive surprise
We model in TGBL’s OPM to improve by ~150bp over FY2011-13E from 8.6% in
FY2011 to ~10.1% in FY2013E, driven by a shift in its focus from the plantation
business to branded products business and rationalization in its operating cost
structure. We expect a rejig in the company’s cost structure due to the ongoing
hiving off of the plantation business and expect staff cost, power and fuel cost and
manufacturing expenses to come down going forward. While TGBL’s focus on
volume growth remains intact, selective price increases and stable ad spends will
further aid in margin improvement.
Exhibit 5: Changes in cost structure to improve OPM
45.0
40.0
35.0
30.0
25.0
20.0
15.0
10.0
5.0
0.0
RM Expenses
Staff Cost
Power & Fuel Cost
SG&A Expenses
Manufacturing Expenses
Miscellaneous Expenses
Source: Company, Angel Research
Exhibit 6: We expect OPM to improve by ~150bp over FY2011-13E
800
18.0
700
16.0
14.0
600
12.0
500
10.0
400
8.0
300
6.0
200
4.0
100
2.0
-
-
EBITDA
OPM
Source: Company, Angel Research
December 19, 2011
4
Tata Global Beverages | Initiating coverage
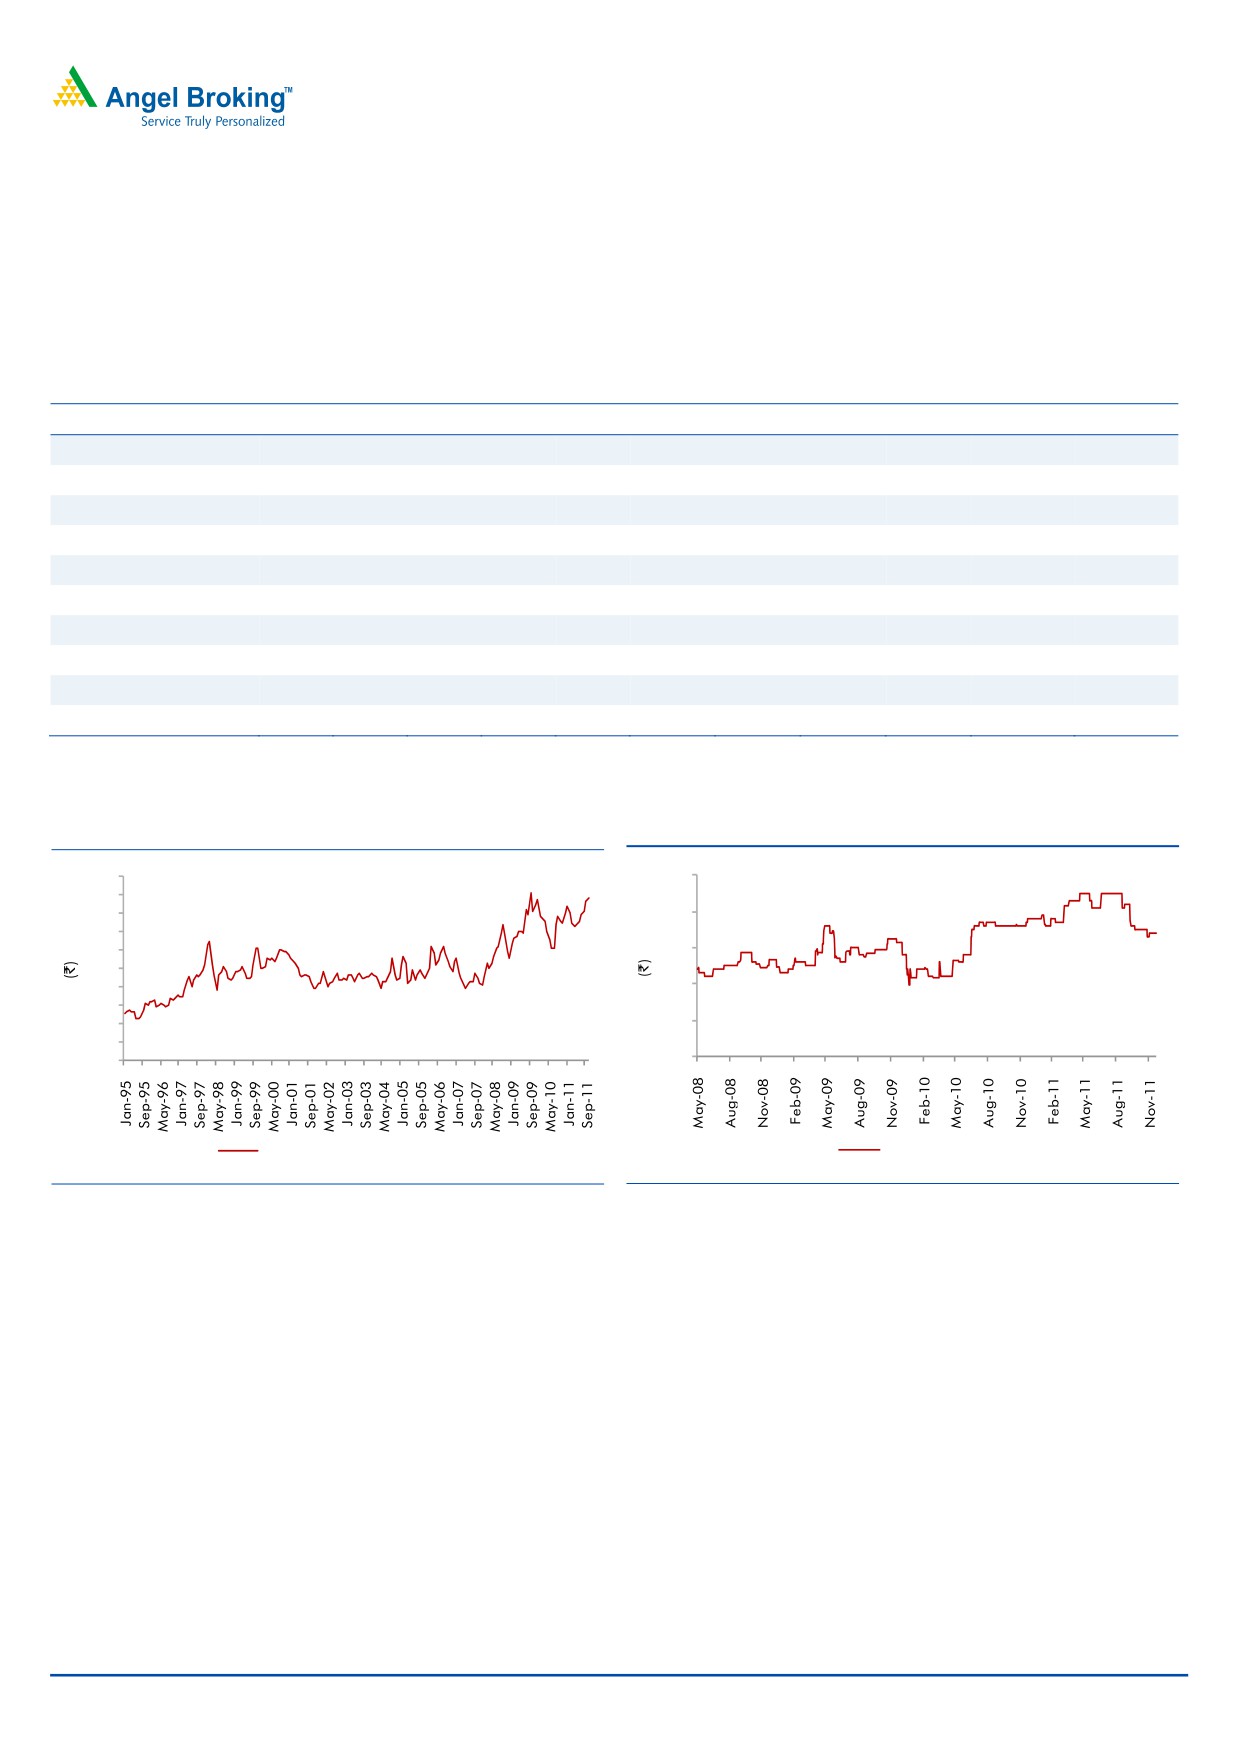
Also, with the Tea Board of India estimating higher production of tea in 2011 as
compared to 2010 (~5% higher production), we expect auction prices of tea to
soften, thereby providing a relief to the company from the heightened input cost
pressure. It is estimated that tea production in India will cross 1,000mn kgs in
2011 with increased tea production from North India.
Exhibit 7: Monthly estimated tea production for CY2011
CY2011 (‘000kgs)
Jan
Feb
Mar
April
May
June
July
Aug
Sept
Oct Jan to Oct
Total Assam
3,426
94
23,669
37,025
30,968
62,824
76,311
84,080
66,962
70,467
455,826
Growth (yoy %)
(37)
114
60
(3)
9
24
14
7
7
(2)
9
Total W. Bengal
2,934
909
14,364
11,954
20,330
25,955
33,934
27,148
23,762
22,973
184,263
Growth (yoy %)
(8)
(39)
(4)
27
10
2
(1)
(1)
(2)
(10)
-
Total North India
6,412
1,004
38,137
49,451
51,738
89,458
111,940
112,757
93,062
95,039
648,998
Growth (yoy %)
(26)
(34)
28
3
9
16
9
5
4
(4)
6
Total South India
14,518
15,728
18,595
23,593
24,439
25,251
21,329
14,250
17,999
22,458
198,160
Growth (yoy %)
(21)
(4)
(3)
17
(3)
(7)
5
(4)
(2)
4
(2)
All India
20,930
16,732
56,732
73,044
76,177
114,709
133,269
127,007
111,061
117,497
847,158
Growth (yoy %)
(23)
(7)
16
7
5
10
8
3
3
(3)
4
Source: Indian Tea Board, Angel Research
Exhibit 8: Mombasa tea auction price (`/kg)
Exhibit 9: India Tea price - signs of cooling down (`/kg)
250
200
180
160
200
140
120
150
100
80
100
60
40
50
20
0
0
Mombasa Tea Auction Price
Indian Tea Price
Source: Industry, Angel Research
Source: Indian Tea Board, Angel Research
December 19, 2011
5
Tata Global Beverages | Initiating coverage
Exhibit 10: Increase in tea plantation acreage to increase production
Year
Area (hectares)
Production (‘000 kgs)
1981
383,629
560,427
1982
394,170
560,562
1983
396,066
581,484
1984
398,453
639,864
1985
399,964
656,162
1986
407,647
620,803
1987
411,335
665,251
1988
414,347
700,014
1989
414,953
688,105
1990
416,269
720,338
1991
420,470
754,192
1992
420,289
732,322
1993
418,363
760,826
1994
425,966
752,895
1995
427,065
756,016
1996
431,204
780,140
1997
434,294
810,031
1998
474,027
874,108
1999
490,200
825,935
2000
504,366
846,922
2001
509,806
853,923
2002
515,832
838,474
2003
519,598
878,129
2004
521,403
892,965
2005
523,000
927,984
2006
567,020
981,800
2007
578,458
986,430
2008
NA
980,820
2009
NA
978,999
2010
NA
966,403
2011
NA
1000000E
Source: Indian Tea Board, Angel Research
Estimate ~40% plus adjusted CAGR over FY2011-13E
We model a ~40% EPS CAGR over FY2011-13, led by (1) 9% revenue growth and
(2) a 150bp margin improvement. We believe the company is set to outperform
the industry’s growth with the help of selective price increases and strong brands
like Tata Tea Premium, Tata Tea Gold, Agni Dust and Kanan Devan.
December 19, 2011
6
Tata Global Beverages | Initiating coverage
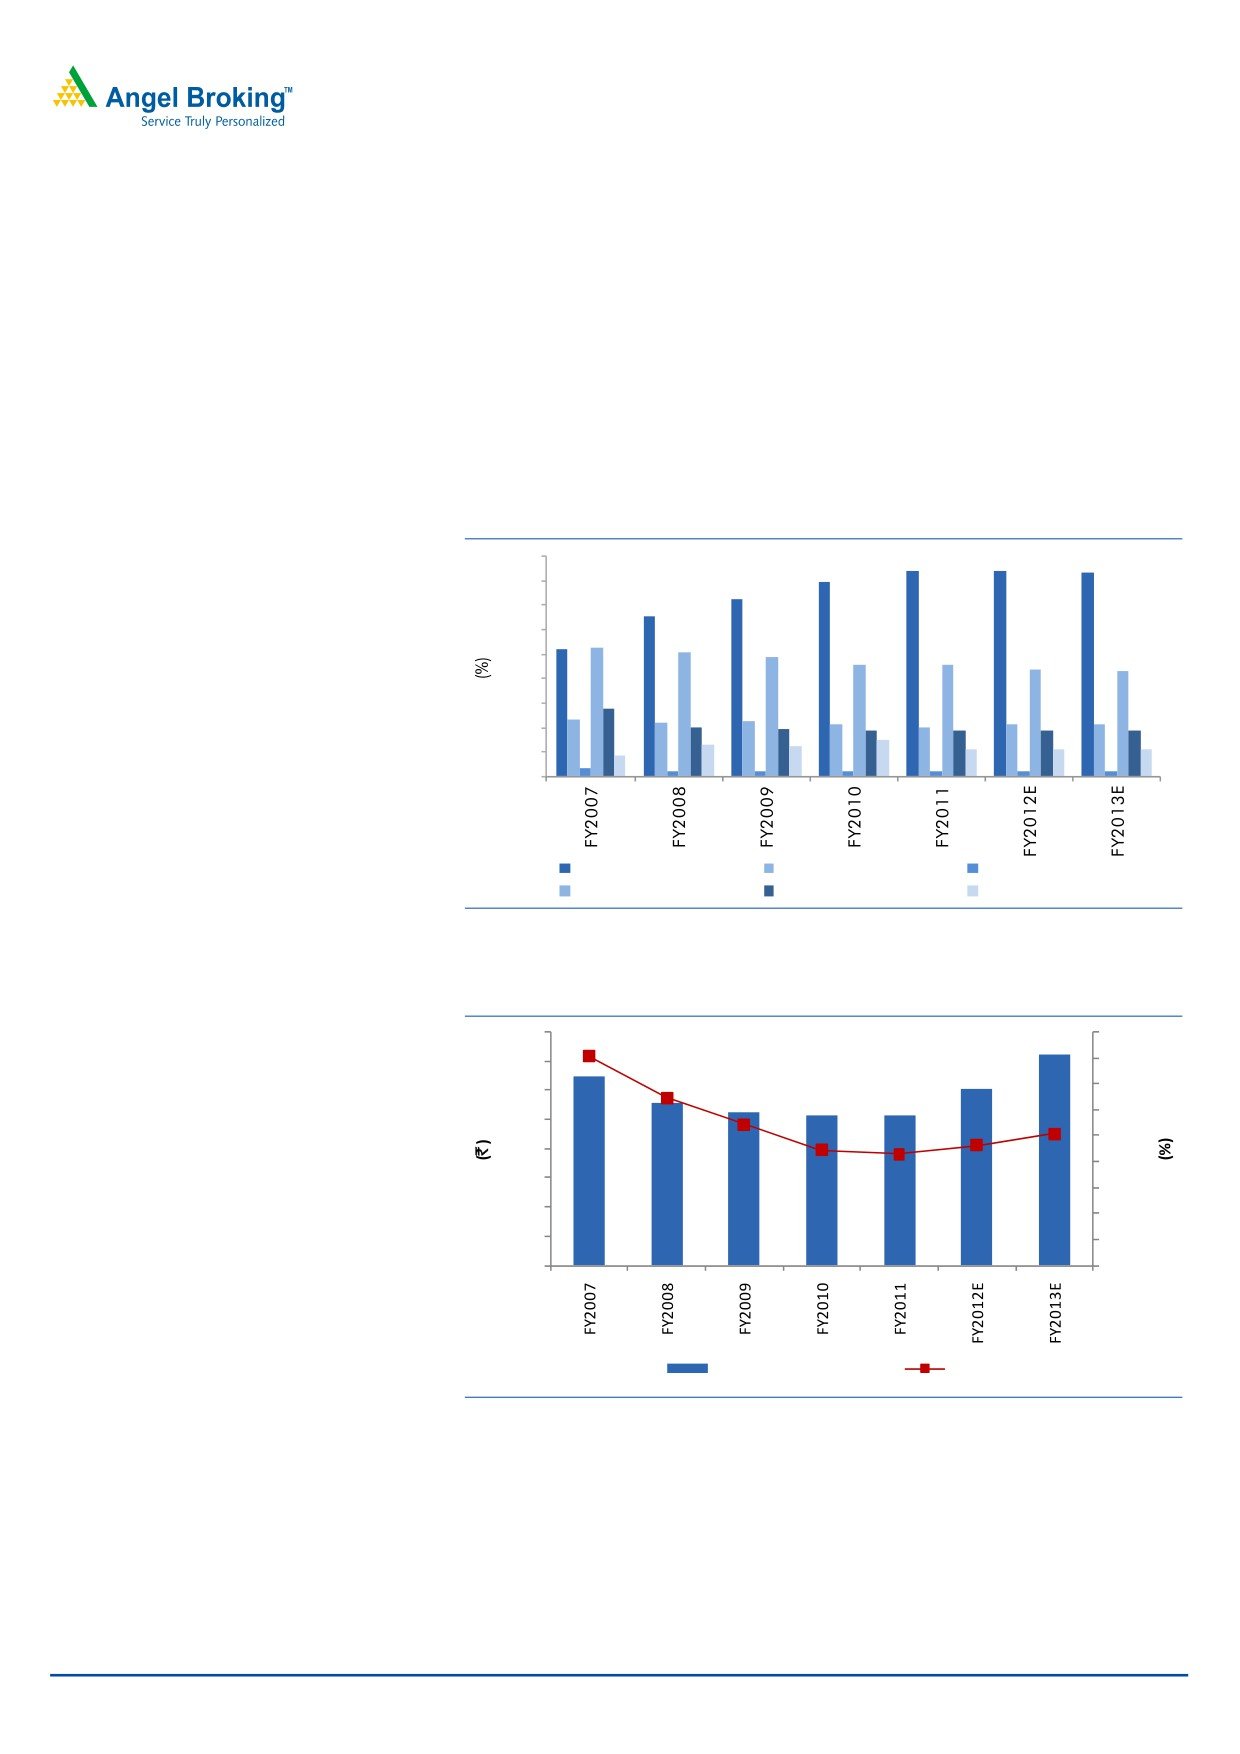
We estimate return ratios to improve
Despite being a leading player in the consumer space, TGBL (unlike its FMCG
peers) does not have very high RoE and RoCE - the reason being high goodwill
(~50% of total assets in FY2011) in the balance sheet as a result of acquisitions
over many years.
Exhibit 11: RoCE to improve over FY2011-13E
(%)
Reported
Adjusted for goodwill
Adjusted for goodwill & cash
FY2007
7.5
30.2
32.3
FY2008
6.6
11.2
16.4
FY2009
6.0
10.3
14.1
FY2010
6.2
11.0
22.6
FY2011
6.7
13.2
19.4
FY2012E
8.0
15.8
23.8
FY2013E
9.6
18.8
27.2
Source: Company, Angel Research
Revenue overview
TGBL has become a global non beverage player post its various acquisitions in
many geographical regions. Though the company’s key revenue generating
product remains tea, it is also present in coffee though its subsidiary Tata Coffee
Ltd. The company has recently started to expand its product portfolio by entering
into other beverages. The company has recently entered into a JV with PepsiCo
India Pvt. Ltd. to develop non-carbonated, ready-to-drink beverages focused on
health and enhanced wellness for international markets.
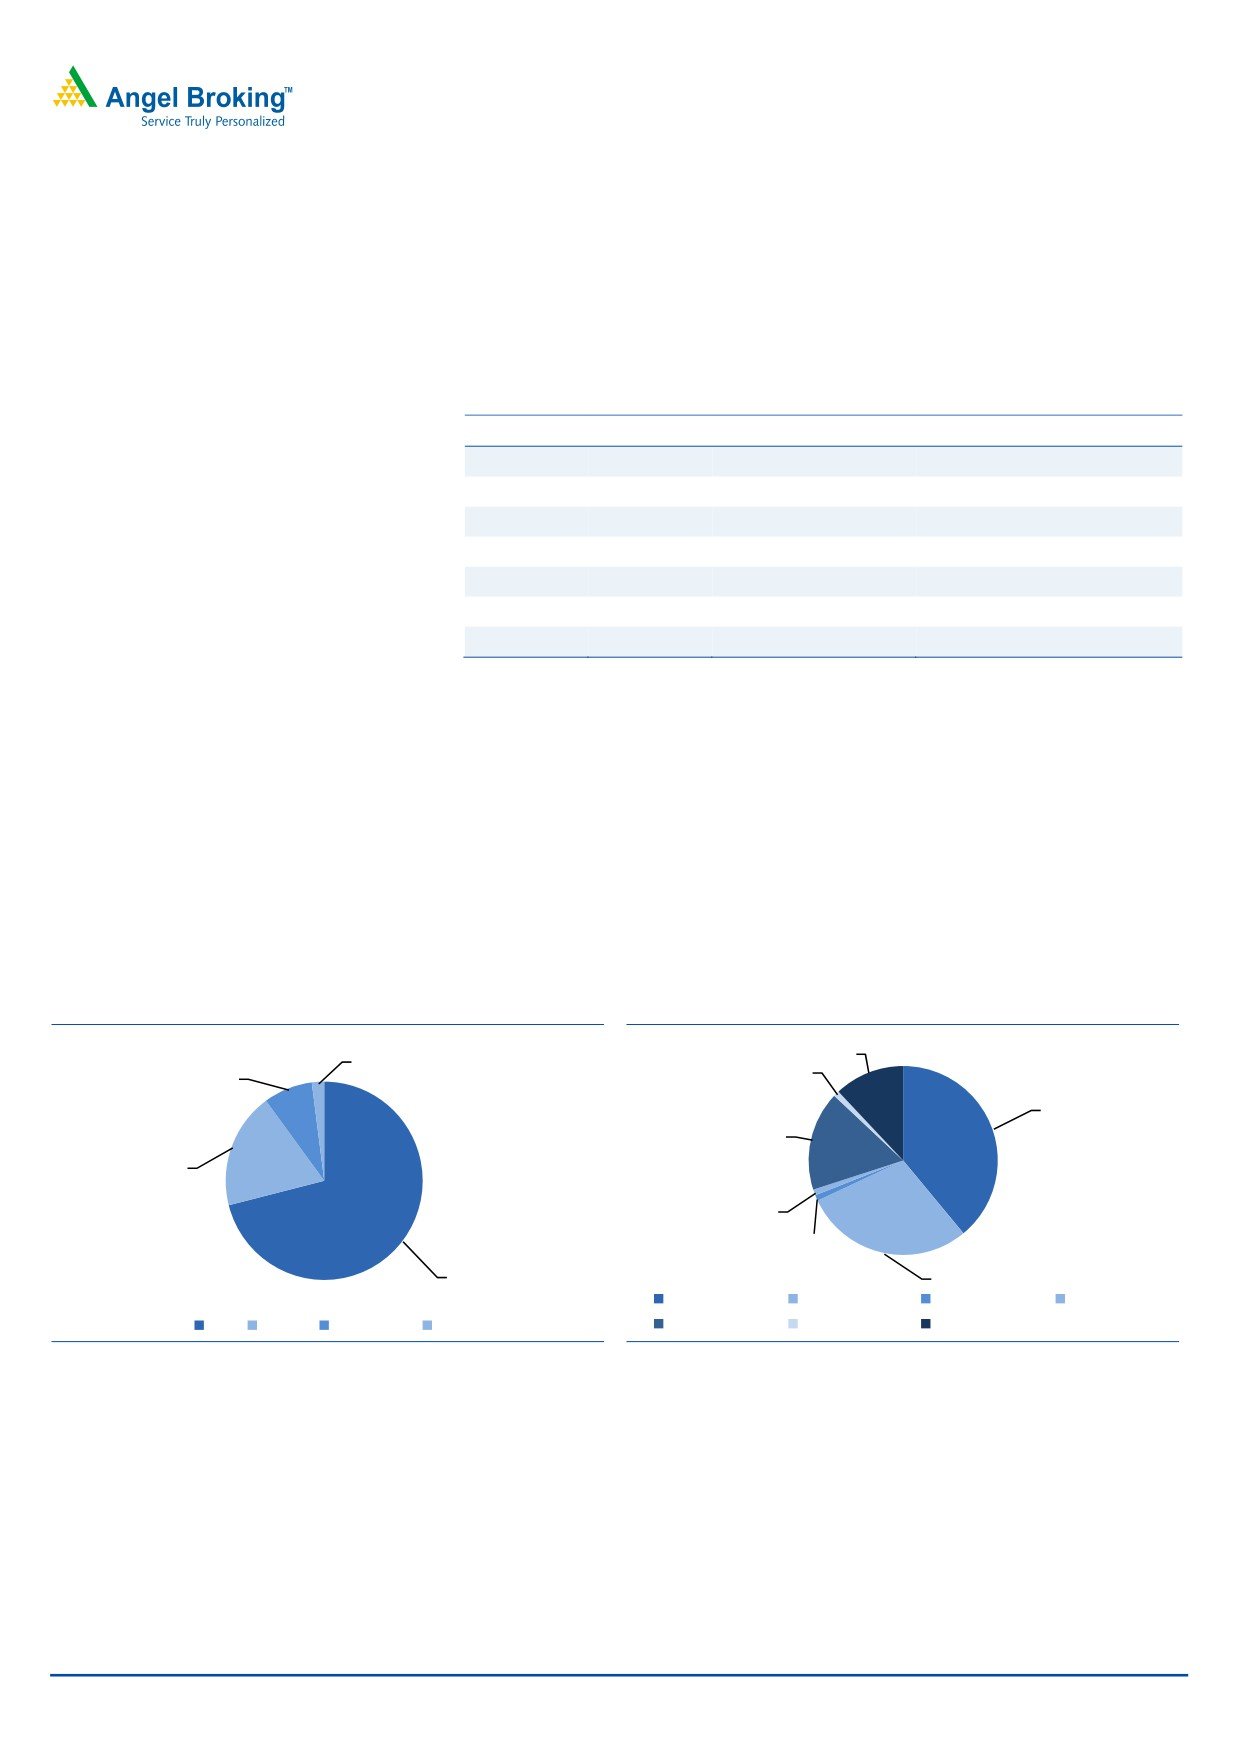
Exhibit 12: Category-wise sales breakup FY2011
Exhibit 13: Brand-wise sales breakup FY2011
12
2
8
1
39
17
19
1
1
71
29
Tetley
Indian Tea Brands Good Earth
Jemca
Tea
Coffee
Plantations
Others
Eight O'Clock
Vitax
Others
Source: Company, Angel Research
Source: Company, Angel Research
December 19, 2011
7
Tata Global Beverages | Initiating coverage
We expect the company’s consolidated revenue to witness a ~9% CAGR over
FY2011-13E, driven by modest volume growth and selective price hikes in the
company’s key categories - tea and coffee.
The tea industry has witnessed a number of changes over the years with changing
consumer behavior due to changing lifestyles and increased awareness. Though
tea remains the key focus area for TGBL, the company is focusing on expanding its
footprint across the globe, strengthening its position in the global tea market and
getting noticed in the global beverages category. Over the years, TGBL has grown
inorganically - considering the sluggish growth in the domestic tea market.
Exhibit 14: Time line of acquisitions and JVs of TGBL
Year
Company
Country
FY2000
Tetley
UK
FY2005
Good Earth, Inc., USA
USA
FY2006
Eight O' Clock Coffee Company, USA
USA
FY2009
Grand, Russia
Russia
FY2011
Rising Beverage Company Llc
USA
FY2012
Nourishco Beverages Ltd (With PepsiCo India)
India
Source: Company, Angel Research
Exhibit 15: Brand portfolio of TGBL
Brands
Category
Country
Tetley
Black tea, herbal tea, fruit tea
UK and Canada
Vitax
Fruit tea
Poland
Jemca
Black tea, green tea, herbal tea, fruit tea Czech
Phendula
Tea
South Africa
Tata Tea
Tea
India
Eight O’Clock
Coffee
USA
Grand
Coffee and tea
Russia
Good Earth
Tea
USA
Himalayan
Mineral water
India
T4 KIDZ
Hot flavoured drink
UK
Laager
Tea
South Africa
Activate
Flavoured water
USA
Nourishco
Non carbonated RTD beverage
India & Intl. markets
Sukk
Drinkable jelly snack
UK
Source: Company, Angel Research
December 19, 2011
8
Tata Global Beverages | Initiating coverage
Outlook and valuation
We estimate modest revenue growth at a ~9% CAGR over FY2011-13E on the
basis of price and volume-led growth. Inspite of the slow revenue growth, we
expect healthy expansion of 150bp in the company’s OPM over FY2011-13E, from
8.6% in FY2011 to ~10% in FY2013E, due to changes in cost structure and
selective price hikes in key products. Adjusted earnings for the company are
expected to witness a robust ~40% EPS CAGR over FY2011-13E, primarily due to
increased OPM.
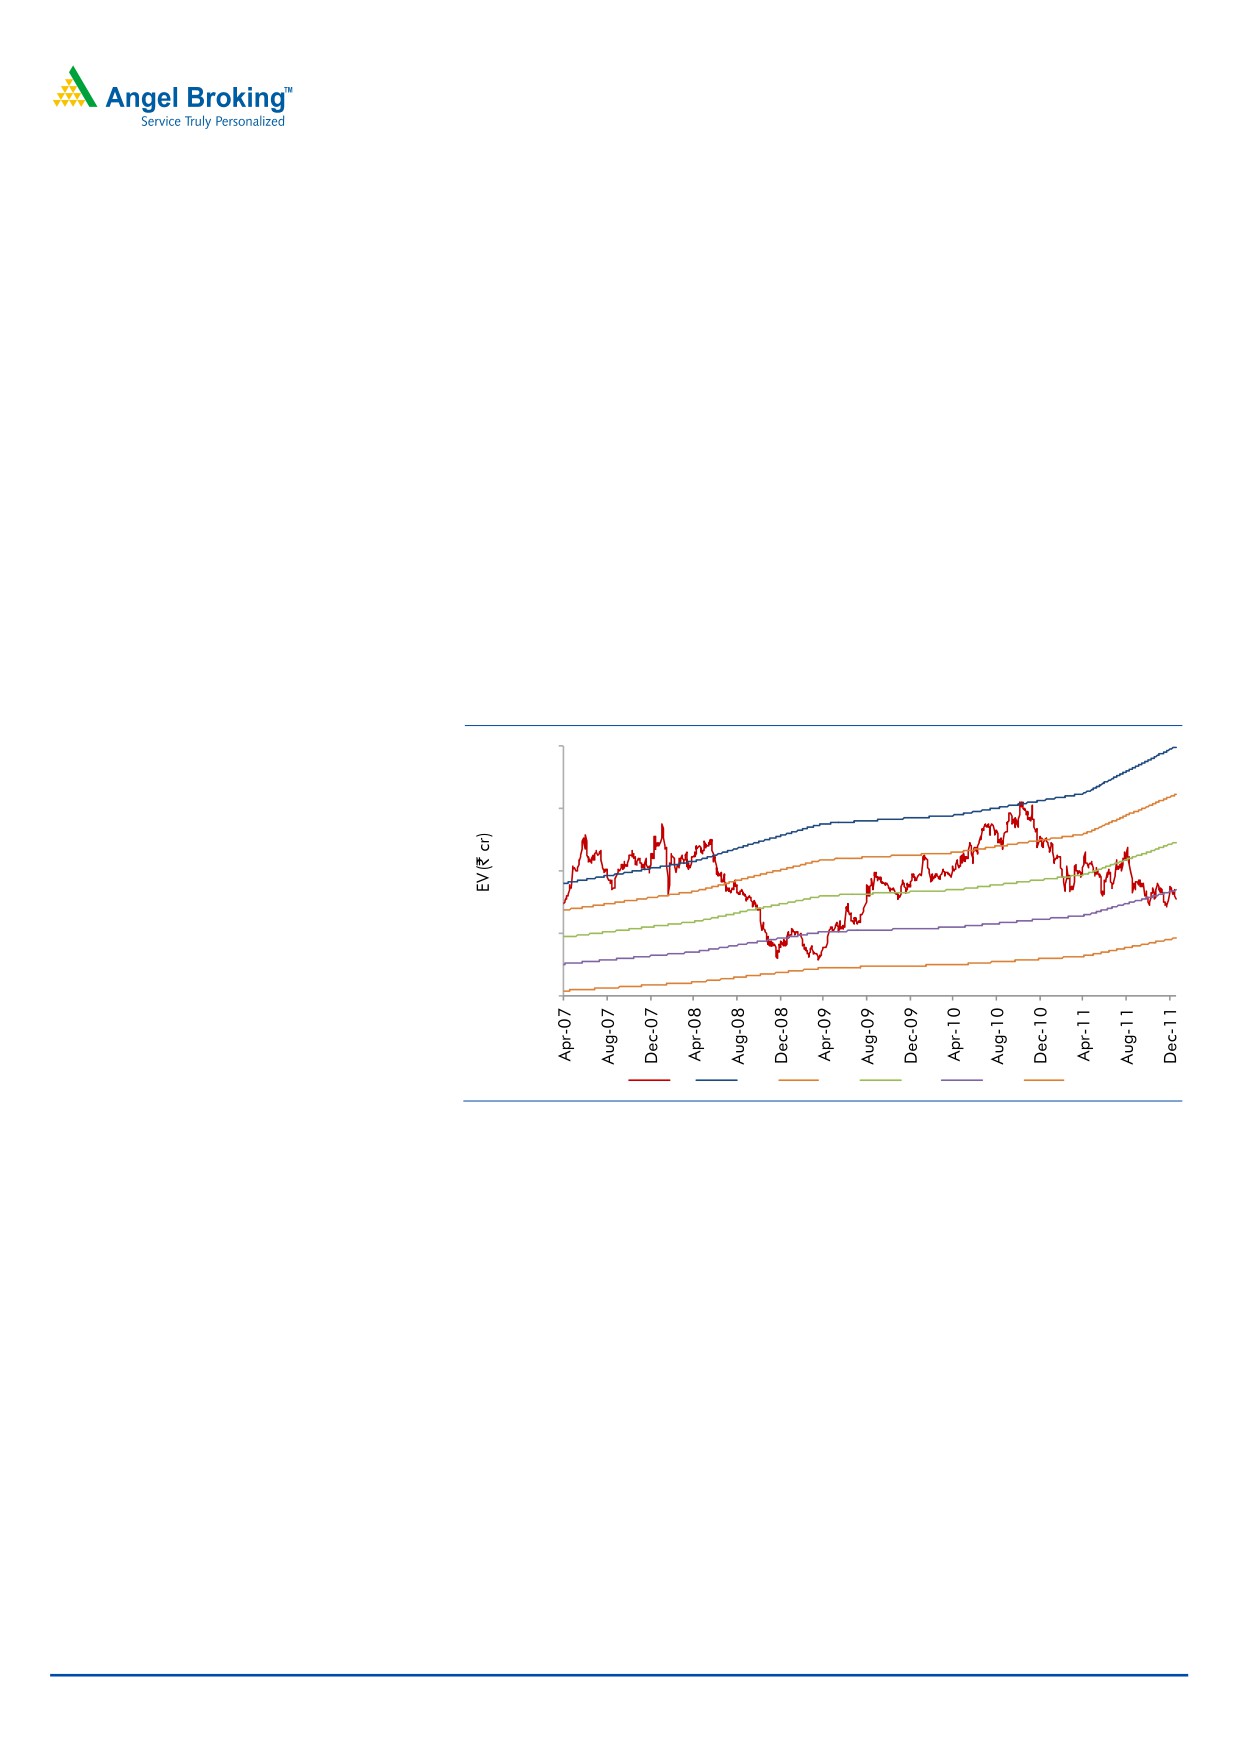
Despite its leadership position in the Indian packaged tea market, No. 2 position
in the global tea market and generating ~90% of its total revenue from branded
products, TGBL is trading at 13.3x FY2013E EPS (which is at a discount to its
FMCG peers, trading at 20x-35x FY2013E EPS). Also, on EV/Sales basis, the stock
is trading at 0.6x FY2013E EV/Sales (historical average of 1x EV/ Sales). Hence,
we initiate coverage on the stock with a Buy recommendation and a target price of
`104, based on 16x FY2013E EPS of `6.5 (0.9x FY2013 EV/Sales).
Exhibit 16: Trading at attractive 0.6x FY2013E EV/Sales
10,000
8,000
6,000
4,000
2,000
EV
1.3
1.1
0.9
0.7
0.5
Source: Angel Research
We believe the stock will be re-rated due to the following
reasons:
Improvement in OPM and return ratios going forward
The company has been taking initiatives to expand globally and emerge as a
global beverage player. Going ahead, we believe higher revenue visibility
from the recent JVs and further expansion in non-alcoholic beverages would
result in higher revenue growth.
Key risk
Tea and coffee prices have been at their peaks and volatile. Any further
hardening of key raw materials will negatively impact the company’s margins
and earnings.
December 19, 2011
9
Tata Global Beverages | Initiating coverage
Tea market dynamics in India
According to a report by Euromonitor, tea over the past five years has witnessed
over a 4% CAGR in volumes, with black tea contributing ~98% of volumes.
Volumes of green tea have grown at a faster pace at ~10% in the past five years,
with increasing awareness among consumers about the benefits of green tea.
Exhibit 17: Category-wise volume sales of tea
Tea type (cr tones)
2005
2006
2007
2008
2009
2010 CAGR (%)
Black Tea
2,109
2,171
2,227
2,310
2,396
2,472
15
Green Tea
29
31
33
35
38
42
10
Tea
2,138
2,202
2,260
2,345
2,434
2,514
15
Source: Euromonitor, Angel Research, CAGR over CY2005-10
In terms of value sales, tea has grown by ~15% over CY2005-10 due to higher
demand, as tea remains the most preferred hot drink in most parts of India.
Exhibit 18: Category-wise retail sales value of tea
Tea type (` cr)
2005
2006
2007
2008
2009
2010
CAGR (%)
Black Tea
347.5
368.3
399.5
463.2
527.4
608.5
4.1
Green Tea
25.9
27.8
29.7
31.6
34.0
37.8
9.2
Total Tea
373.4
396.1
429.1
494.9
561.4
646.3
4.1
Source: Euromonitor, Angel Research, CAGR over CY2005-10
During the past few years, changing consumer behavior and increased awareness
about green tea have led to high growth in this category. Though the category is
very small in terms of volume and value sales, it is gaining acceptance among
consumers in the country’s major towns.
The packaged tea market in India is dominated mainly by two players, HUL and
TGBL, with both players competing neck to neck in terms of their market shares.
TGBL has a vast presence in various price points. Tata Tea Premium and Tetley are
its premium brands, whereas Agni Dust and Chakra Gold are the mass brands.
December 19, 2011
10
Tata Global Beverages | Initiating coverage
Company snapshot
TGBL is a global beverage company headquartered in London. The company has
a strong portfolio of global and regional brands such as Tata Tea, Tetley, Eight
O’Clock Coffee, Good Earth, Jemca, Grand Vitax and Himalayan.
During the past decade, TGBL has made acquisitions in various countries in the
tea, coffee, water and other beverages categories. Tea constitutes more than 70%
of the company’s total turnover; coffee constitutes a ~19% share; and the rest
comes from other activities.
Branded products constitute 90% of the company’s annual turnover, with the
remaining sales coming from B2B plantation and extraction activities. About 70%
of the company’s sales are from outside India in countries like US, UK, Czech
Republic and Poland.
Key subsidiaries of TGBL
Exhibit 19: TGBL’s key subsidiaries
Company
Country
Tata Global GB Ltd.
UK
Stansand (Africa) Ltd.
Kenya
OOO Sunty LLC
Russia
Tata Coffee Ltd.
India
Consolidated Coffee, Inc.
US
Source: Company, Angel Research
December 19, 2011
11
Tata Global Beverages | Initiating coverage
Exhibit 20: TGBL vs. local peers relative valuation
Company Reco
Mcap CMP
TP Upside
P/E (x)
EV/Sales (x)
RoE (%)
CAGR #
(` cr)
(`)
(`)
(%) FY12E FY13E FY12E FY13E FY12E FY13E Sales
EPS
Asian Paints Accumulate
25,414
2,650
3,030
14
25.8
21.0
2.7
2.3
39.6
38.3
17.3
19.8
Britannia
Accumulate
5,279
442
495
12
28.7
19.6
1.0
0.9
37.8
46.0
17.3
36.0
Colgate
Neutral
13,817
1,016
-
-
31.5
26.9
5.2
4.5
111.7
108.0
14.9
12.9
Dabur
Buy
16,885
97
115
19
24.1
21.0
3.3
2.9
44.9
41.6
20.5
18.8
GSKCHL*
Neutral
10,306
2,450
-
-
29.6
24.9
3.4
2.9
32.6
31.8
20.1
23.9
GCPL
Accumulate
12,915
399
457
15
24.1
18.5
3.2
2.6
36.6
29.4
22.9
20.2
HUL
Neutral
86,450
396
320
-
33.9
29.8
3.8
3.3
87.5
85.3
12.7
17.1
ITC
Accumulate
152,711
197
219
11
26.5
22.3
5.9
4.9
32.7
31.5
17.6
17.4
Marico
Accumulate
8,546
139
151
9
27.7
22.0
2.4
2.1
30.2
28.8
17.2
28.0
Nestlé*
Neutral
39,918
4,140
3,603
-
41.0
34.5
5.5
4.7
91.1
72.9
16.1
18.9
TGBL
Buy
5,219
84
104
23
16.6
12.2
0.7
0.6
8.4
10.2
9.0
42.3
Source: Angel Research, #Denotes CAGR over FY2011-13E, *Denotes December ending
Exhibit 21: TGBL vs. global non-alcoholic beverage companies
Company
Mcap (mn)
CMP Curr. Country
P/E (x)
EV/Sales (x)
RoE (%)
CAGR #
FY12E FY13E
FY12E FY13E FY12E FY13E Sales EPS
TGBL
52,193
85
INR
INDIA
16.6
12.2
0.7
0.6
8.4
10.2
9.0
42.3
Tingyi Cayman Islands Holding Corp.
131,647
24
Yuan CHINA
15.4
14.0
0.89
0.81
7.8
8.2
7.7
21.3
Green Mountain Coffee Roasters, Inc.
7,108
46
USD USA
27.8
21.9
1.71
1.35
26.3
28.3
36.7
32.2
Dr. Pepper Snapple Group, Inc.
8,260
39
USD USA
17.4
12.6
1.86
1.39
17.6
19.3
45.3
58.0
Hansen Natural Corp.
8,295
95
USD USA
13.1
12.1
1.74
1.68
27.3
29.6
5.7
9.8
Arca Continental SAB de CV
93,663
58
Peso
MEXICO
25.7
21.6
4.18
3.41
31.9
44.5
30.4
23.0
Yakult Honsha Co Ltd.
411,806
2,341
Yen
JAPAN
16.4
13.6
1.85
1.69
15.8
17.1
46.6
27.4
Uni-President China Holdings Ltd.
16,341
5
Yuan CHINA
28.2
25.5
1.28
1.22
6.1
6.5
2.9
16.5
Ito En Ltd.
118,941
1,304
Yen
JAPAN
20.2
14.3
0.58
0.48
8.8
11.3
52.3
33.0
Britvic PLC
724
300
Pound BRITAIN
18.6
16.9
0.42
0.38
7.9
7.4
2.8
(1.4)
Cott Corp.
617
7
CAD CANADA
8.4
7.6
0.90
0.86
189.0
110.9
4.0
27.7
Source: Bloomberg, # Denotes CAGR over CY2011-13E, CMP as on December 19, 2011
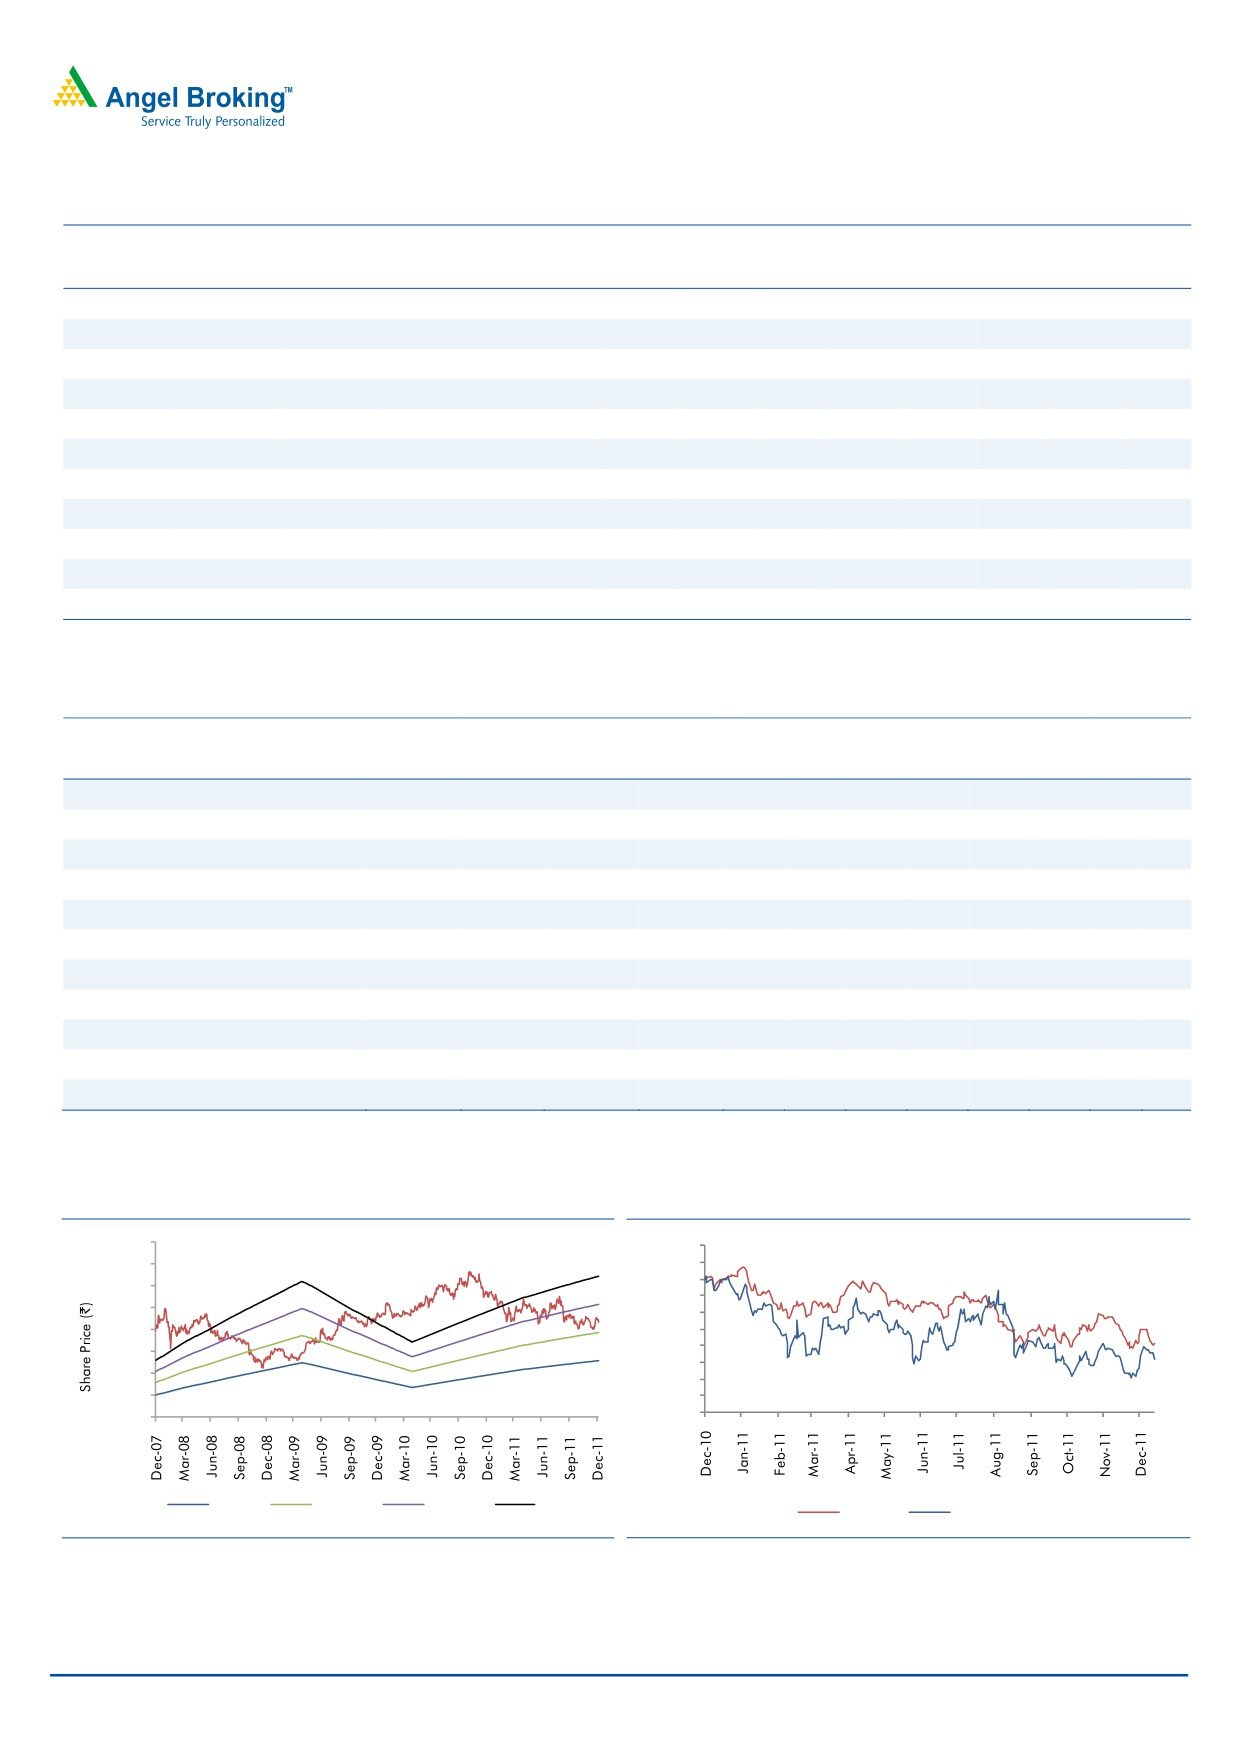
Exhibit 22: One-year forward PE band
Exhibit 23: TGBL’s one-year return to the Sensex
160
110%
140
105%
100%
120
95%
100
90%
80
85%
80%
60
75%
40
70%
20
65%
-
60%
8x
12x
16x
20x
Sensex
TGBL
Source: Angel Research
Source: Angel Research
December 19, 2011
12
Tata Global Beverages | Initiating coverage
Profit and loss statement (Consolidated)
Y/E March (` cr)
FY2008 FY2009 FY2010 FY2011 FY2012E
FY2013E
Gross sales
4,311
4,849
5,784
5,984
6,522
7,110
Less: Excise duty
1.4
1.1
0.9
1.5
0.7
0.7
Net Sales
4,310
4,848
5,783
5,982
6,522
7,109
% chg
7.1
12.5
19.3
3.4
9.0
9.0
Total Expenditure
3,753
4,322
5,269
5,469
5,919
6,389
Cost of Materials
1,416
1,753
2,310
2,521
2,739
2,957
Advertising Exp (Incl Promotion)
825
879
985
1,013
1,057
1,137
Personnel
480
550
611
610
698
754
Others
278
304
437
336
365
398
EBITDA
556
526
514
513
602
720
% chg
(14.1)
(5.6)
(2.3)
(0.0)
17.3
19.5
(% of Net Sales)
12.9
10.8
8.9
8.6
9.2
10.1
Depreciation& Amortisation
92
99
103
99
111
121
EBIT
465
427
411
414
492
600
% chg
(15.7)
(8.2)
(3.8)
0.8
18.8
21.9
(% of Net Sales)
10.8
8.8
7.1
6.9
7.5
8.4
Interest & other Charges
306
210
149
120
122
97
Other Income
1,929
1,039
379
200
188
191
(% of PBT)
92.4
82.7
59.2
40.5
33.8
27.6
Reported PBT
2,088
1,256
641
494
558
694
% chg
258.0
(39.8)
(49.0)
(22.9)
12.8
24.4
Prior Period & Extra Exp/(Inc.)
1,517
480
8
44
-
-
PBT (recurring)
571
776
633
451
558
694
Tax
153
424
248
202
184
229
(% of PBT)
7.3
33.8
38.6
40.9
33.0
33.0
PAT (reported)
1,935
832
393
292
374
465
Add: Share of earnings of asso.
-
25
33
20
20
20
Less: Minority interest (MI)
392
156
36
58
58
58
PAT after MI (reported)
1,543
701
390
254
336
427
ADJ. PAT
25
221
382
211
336
427
% chg
(92.3)
778.0
73.2
(44.8)
59.4
27.2
(% of Net Sales)
0.6
4.5
6.6
3.5
5.2
6.0
ADJ. EPS (`)
0.4
3.6
6.2
3.4
5.4
6.9
Fully Diluted EPS (`)
0.4
3.6
6.2
3.4
5.4
6.9
% chg
(92.3)
778.0
73.2
(44.8)
59.4
27.2
December 19, 2011
13
Tata Global Beverages | Initiating coverage
Balance sheet (Consolidated)
Y/E March (` cr)
FY2008 FY2009 FY2010 FY2011 FY2012E
FY2013E
SOURCES OF FUNDS
Equity Share Capital
62
62
62
62
62
62
Preference Capital
-
-
-
-
-
-
Reserves& Surplus
3,353
3,591
3,662
3,895
3,976
4,152
Shareholders’ Funds
3,414
3,653
3,723
3,957
4,038
4,214
Minority Interest
1,028
1,022
1,057
1,108
1,108
1,108
Total Loans
2,609
2,431
1,797
1,042
942
842
Deferred Tax Liability
37
48
75
64
64
64
Total Liabilities
7,088
7,154
6,652
6,170
6,152
6,227
APPLICATION OF FUNDS
Gross Block
1,351
1,442
1,470
1,563
1,703
1,856
Less: Acc. Depreciation
629
707
752
842
952
1,073
Net Block
722
735
718
721
750
783
Capital Work-in-Progress
50
63
47
39
43
46
Goodwill
2,938
3,027
2,929
3,038
3,038
3,038
Investments
1,391
351
519
587
615
623
Current Assets
3,329
4,587
3,998
3,376
3,620
3,757
Cash
1,323
1,089
1,904
997
1,052
981
Loans & Advances
1,012
2,303
653
736
802
874
Other
400
267
28
30
30
30
Current liabilities
1,358
1,617
1,560
1,590
1,914
2,020
Net Current Assets
1,971
2,970
2,438
1,786
1,705
1,736
Misc. Exp. not written off
16.61
7.64
-
-
-
-
Total Assets
7,088
7,154
6,652
6,170
6,152
6,227
Cash flow statement (Consolidated)
Y/E March (` cr)
FY2008 FY2009 FY2010 FY2011 FY2012E
FY2013E
Profit before tax
2,088
1,256
641
494
558
694
Depreciation
92
99
103
99
111
121
Change in Working Capital
(502)
381
42
(143)
140
(114)
Interest / Dividend (Net)
256
154
91
44
65
48
Direct taxes paid
153
424
248
202
184
229
Others
557
(2,338)
(147)
(71)
(8)
12
Cash Flow from Operations
2,337
(872)
482
221
681
531
(Inc.)/ Dec. in Fixed Assets
(70)
(68)
(89)
(85)
(144)
(157)
(Inc.)/ Dec. in Investments
2,818
1,155
1,472
5
(29)
(8)
Cash Flow from Investing
2,749
1,087
1,384
(81)
(173)
(165)
Issue of Equity
203
-
-
(63)
-
-
Inc./(Dec.) in loans
(1,968)
(178)
(634)
(755)
(100)
(100)
Dividend Paid (Incl. Tax)
253
125
146
145
289
289
Interest / Dividend (Net)
256
154
91
44
65
48
Cash Flow from Financing
(2,274)
(457)
(871)
(1,007)
(454)
(437)
Inc./(Dec.) in Cash
1,204
(234)
815
(907)
54
(70)
Opening Cash balances
119
1,323
1,089
1,904
997
1,052
Closing Cash balances
1,323
1,089
1,904
997
1,052
981
December 19, 2011
14
Tata Global Beverages | Initiating coverage
Key ratios
Y/E March
FY2008 FY2009 FY2010 FY2011 FY2012E FY2013E
Valuation Ratio (x)
P/E (on FDEPS)
220.8
25.2
14.5
26.4
16.6
12.2
P/CEPS
2.7
6.0
11.4
17.9
12.5
9.5
P/BV
1.6
1.5
1.5
1.4
1.4
1.3
Dividend yield (%)
3.9
2.0
2.2
2.2
4.4
4.7
EV/Sales
1.3
1.4
0.9
0.8
0.7
0.6
EV/EBITDA
9.8
12.5
9.6
9.8
8.0
6.2
EV / Total Assets
0.8
0.9
0.7
0.8
0.8
0.7
Per Share Data (`)
EPS (Basic)
0.4
3.6
6.2
3.4
5.4
6.9
EPS (fully diluted)
0.4
3.6
6.2
3.4
5.4
6.9
Cash EPS
32.9
15.1
7.9
5.0
7.2
8.9
DPS
3.5
1.8
2.0
2.0
4.0
4.0
Book Value
54.7
58.5
59.6
63.4
64.6
67.4
Returns (%)
RoCE
6.6
6.0
6.2
6.7
8.0
9.6
Angel ROIC (Pre-tax)
-
-
-
-
-
-
RoE
57.4
23.1
10.4
5.4
8.4
10.2
Turnover ratios (x)
Asset Turnover (Gross Block)
3.3
3.5
4.1
3.9
3.9
3.9
Inventory / Sales (days)
45
49
53
61
62
62
Receivables (days)
37
34
31
33
34
34
Payables (days)
84
88
83
83
83
83
WC cycle (ex-cash) (days)
1
-
1
-
1
-
December 19, 2011
15
Tata Global Beverages | Initiating coverage
Research Team Tel: 022 - 39357800
DISCLAIMER
This document is solely for the personal information of the recipient, and must not be singularly used as the basis of any investment
decision. Nothing in this document should be construed as investment or financial advice. Each recipient of this document should make
such investigations as they deem necessary to arrive at an independent evaluation of an investment in the securities of the companies
referred to in this document (including the merits and risks involved), and should consult their own advisors to determine the merits and
risks of such an investment.
Angel Broking Limited, its affiliates, directors, its proprietary trading and investment businesses may, from time to time, make
investment decisions that are inconsistent with or contradictory to the recommendations expressed herein. The views contained in this
document are those of the analyst, and the company may or may not subscribe to all the views expressed within.
Reports based on technical and derivative analysis center on studying charts of a stock's price movement, outstanding positions and
trading volume, as opposed to focusing on a company's fundamentals and, as such, may not match with a report on a company's
fundamentals.
The information in this document has been printed on the basis of publicly available information, internal data and other reliable
sources believed to be true, but we do not represent that it is accurate or complete and it should not be relied on as such, as this
document is for general guidance only. Angel Broking Limited or any of its affiliates/ group companies shall not be in any way
responsible for any loss or damage that may arise to any person from any inadvertent error in the information contained in this report.
Angel Broking Limited has not independently verified all the information contained within this document. Accordingly, we cannot testify,
nor make any representation or warranty, express or implied, to the accuracy, contents or data contained within this document. While
Angel Broking Limited endeavours to update on a reasonable basis the information discussed in this material, there may be regulatory,
compliance, or other reasons that prevent us from doing so.
This document is being supplied to you solely for your information, and its contents, information or data may not be reproduced,
redistributed or passed on, directly or indirectly.
Angel Broking Limited and its affiliates may seek to provide or have engaged in providing corporate finance, investment banking or
other advisory services in a merger or specific transaction to the companies referred to in this report, as on the date of this report or in
the past.
Neither Angel Broking Limited, nor its directors, employees or affiliates shall be liable for any loss or damage that may arise from or in
connection with the use of this information.
Note: Please refer to the important `Stock Holding Disclosure' report on the Angel website (Research Section). Also, please refer to the
latest update on respective stocks for the disclosure status in respect of those stocks. Angel Broking Limited and its affiliates may have
investment positions in the stocks recommended in this report.
Disclosure of Interest Statement
TGBL
1. Analyst ownership of the stock
No
2. Angel and its Group companies ownership of the stock
No
3. Angel and its Group companies' Directors ownership of the stock
No
4. Broking relationship with company covered
No
Note: We have not considered any Exposure below ` 1 lakh for Angel, its Group companies and Directors
Ratings (Returns):
Buy (> 15%)
Accumulate (5% to 15%)
Neutral (-5 to 5%)
Reduce (-5% to 15%)
Sell (< -15%)
December 19, 2011
16
Tata Global Beverages | Initiating coverage
6th Floor, Ackruti Star, Central Road, MIDC, Andheri (E), Mumbai - 400 093. Tel: (022) 39357800
Research Team
Fundamental:
Sarabjit Kour Nangra
VP-Research, Pharmaceutical
Vaibhav Agrawal
VP-Research, Banking
Shailesh Kanani
Infrastructure
Srishti Anand
IT, Telecom
Bhavesh Chauhan
Metals, Mining
Sharan Lillaney
Mid-cap
V Srinivasan
Research Associate (Cement, Power)
Yaresh Kothari
Research Associate (Automobile)
Shrinivas Bhutda
Research Associate (Banking)
Sreekanth P.V.S
Research Associate (FMCG, Media)
Hemang Thaker
Research Associate (Capital Goods)
Nitin Arora
Research Associate (Infra, Real Estate)
Ankita Somani
Research Associate (IT, Telecom)
Varun Varma
Research Associate (Banking)
Sourabh Taparia
Research Associate (Cement, Power)
Technicals:
Shardul Kulkarni
Sr. Technical Analyst
Sameet Chavan
Technical Analyst
Sacchitanand Uttekar
Technical Analyst
Derivatives:
Siddarth Bhamre
Head - Derivatives
Institutional Sales Team:
Mayuresh Joshi
VP - Institutional Sales
Hiten Sampat
Sr. A.V.P- Institution sales
Meenakshi Chavan
Dealer
Gaurang Tisani
Dealer
Akshay Shah
Dealer
Production Team:
Simran Kaur
Research Editor
Dilip Patel
Production
CSO & Registered Office: G-1, Ackruti Trade Centre, Rd. No. 7, MIDC, Andheri (E), Mumbai - 400 093.Tel.: (022) 3083 7700. Angel Broking Ltd: BSE Sebi Regn No: INB010996539 / PMS Regd Code: PM/INP000001546 / CDSL Regn No: IN - DP - CDSL - 234 - 2004 / NSE Sebi Regn Nos: Cash: INB231279838 / NSE
F&O: INF231279838 / Currency: INE231279838 / MCX Currency Sebi Regn No: INE261279838 / Member ID: 10500 / Angel Commodities Broking Pvt. Ltd: MCX Member ID: 12685 / FMC Regn No: MCX / TCM / CORP / 0037 NCDEX : Member ID 00220 / FMC Regn No: NCDEX / TCM / CORP / 0302
December 19, 2011
17