Please refer to important disclosures at the end of this report
1
TCS Buyback | IT Services
January 21, 2022
TATA Consultancy Services
Buyback 2022
Buyback 2022 details
Particulars
Details
No. of Shares
4,00,00,000
Buyback Price
4,500
Premium to CMP
17.6
%
Buyback Size
`
18,000 Cr
Record Date
TBA
Small Shareholding
<
`
2Lk based on closing
price on record date
Small Shareholder Reservation
15%
Max # of shares to be held
44
Source: Company, Angel Research
The Board of Directors of Tata Consultancy Services Ltd (TCS), at its meeting held on
January 12, 2022 has approved a proposal to buyback up to four crore shares at
`
4,500 per share. The buy-back aggregates to
`
18,000 Cr, which represents
1.08% of
the total, paid up equity share capital. The buyback will be via the tender off
er route
and as per SEBI regulations, 15% of the offer size (~
`2,700 crore) will be reserved for
small shareholders holding shares upto a value of INR `2 lakh as on the record date.
As per the buyback norms, the reserved portion for the small shareholders is 15% or 6
0
lakh shares. At the price of `
4,500 per share the maximum number of shares held by an
individual will be 44 to qualify for the small
shareholder criteria. Based on the offer
letters and post buyback announcement for the last three buybacks, the total shares
held by such shareholders was <1% of the total outstanding shares.
Historically the
participation rate by small investors has been
less than 100% in all the three buybacks
between 2017 to 2020. However the participation rate has increased from 49.8% in the
2017 buyback to 76.6% and may
increase further in the forthcoming buyback given likely
increase in retail participation.
Therefor
e we believe that the acceptance ratio in the small shareholder category would
be lower than the past buybacks and could be in the range of 30-
50% in the forthcoming
buyback. Although the total returns can vary depending on the acceptance ratio, a
30%
to 50% acceptance ratio can yield profits between 5.8% to 8.8
% assuming that
investors are able to sell the balance shares at current price of `3,827 per share.
Shares held by small shareholder
s as determined at the record date
Buyback Year
% of total o/s shares
2017
0.9
2018
0.7
2020
0.5
Source: Company, Angel Research; Note: Above data is for the small shareholder category
CMP
`
3,827
Not Rated
Stock Info
Sector
Bloomberg Code
Shareholding Pattern (%)
Promoters 72.2
MF / Banks / Indian Fls 8.0
FII / NRIs / OCBs 15.0
Indian Public / Others 4.8
IT Services
Market Cap (` cr)
14,15,461
52 Week High / Low
4,043 / 2,880
Avg. Daily Volume
25,23,805
Face Value (
`)
1
BSE Sensex
59,465
Nifty
17,757
Reuters Code
TCS.BO
TCS.IN
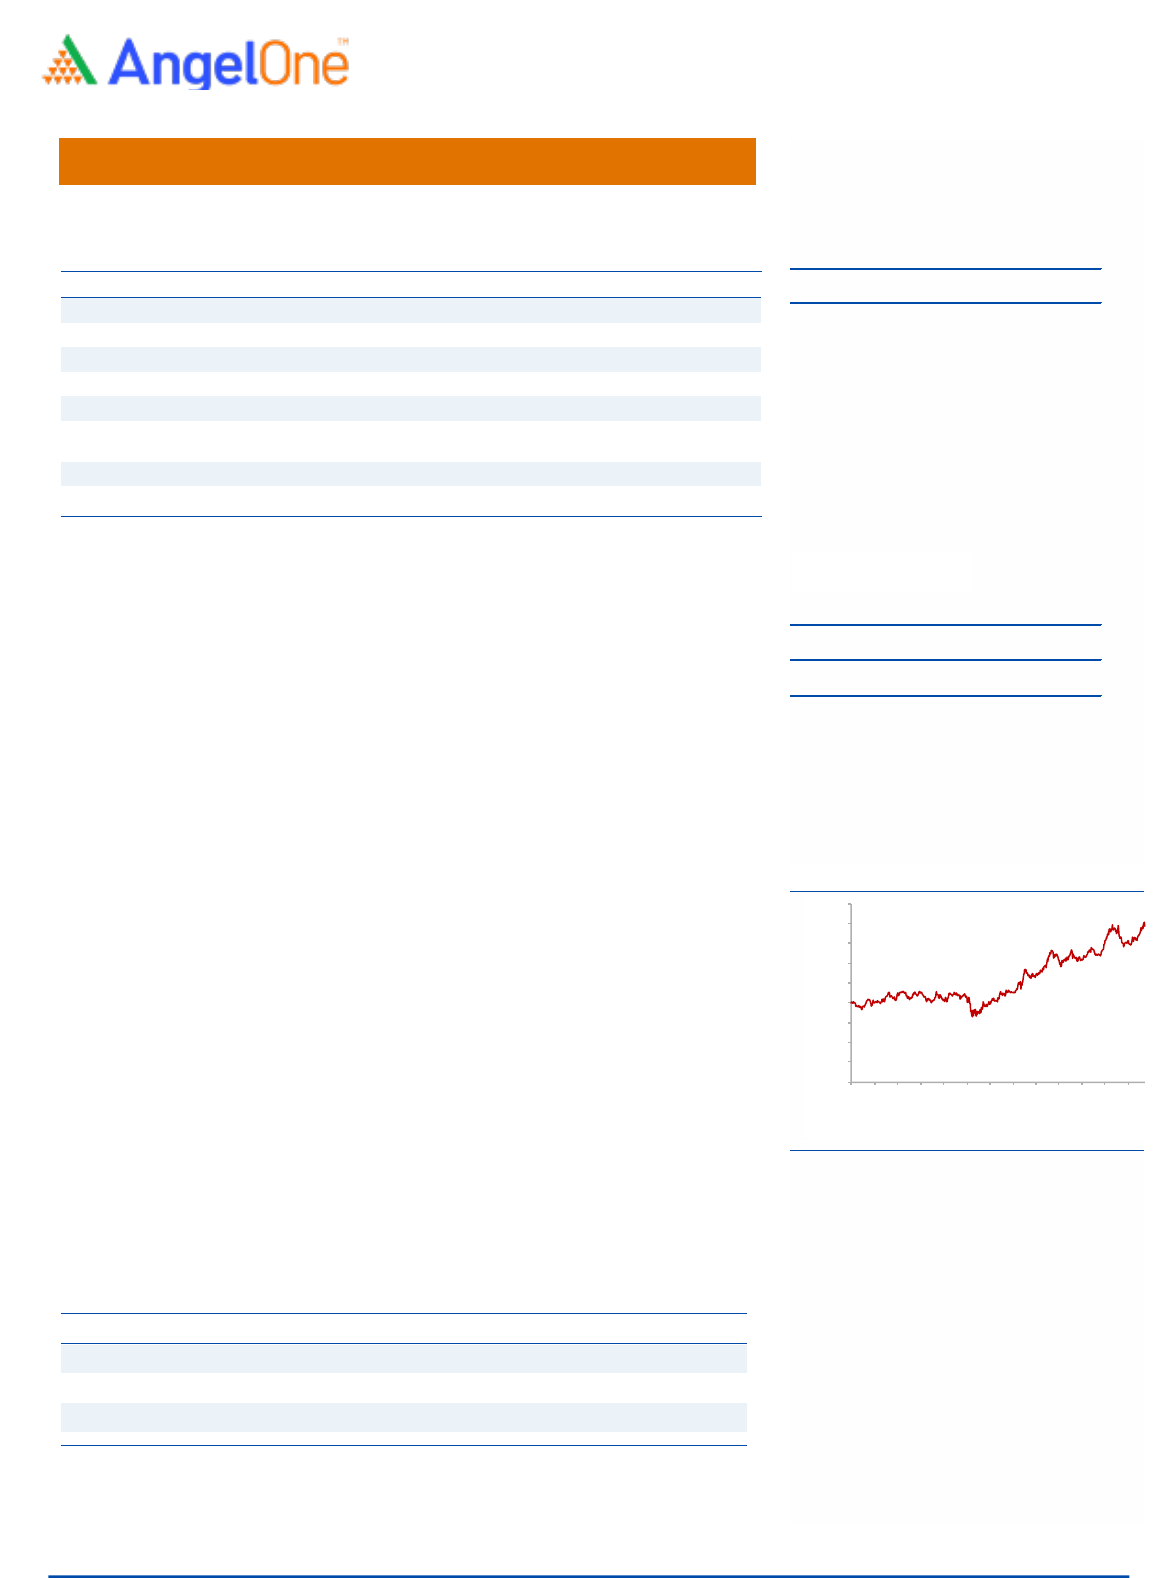
Price Chart
Source: Company, Angel Research
Jyoti Roy
022
-4000 3600 Ext: 6842
jyoti.roy@angelbroking.com
-
500
1,000
1,500
2,000
2,500
3,000
3,500
4,000
4,500
Dec-18
Mar-1 9
Jun-19
Aug-19
Nov-19
Feb-20
May-20
Aug-20
Nov-20
Feb-21
May-21
Aug-21
Nov-21
TCS |Buyback Update
January 21, 2022
2
As seen in the table(s) below, this group of category has higher entitlement and
has seen limited participation which bodes wells from acceptance perspective.
The past entitlement ratios have come down from 45% to 40% and it is likely that
the upcoming entitlement ratio can trend lower between 35%-40%.
Past entitlement ratios
for tendering of shares for small shareholders
Buyback Year
Shares
Entitled
Against
held
Ratio (%)
2017
9
20
45.0
2018
43
96
44.8
2020
2
5
40.0
Source: Company, Angel Research; Note: Above data is for the small shareholder category
Based on the below exhibit, the participation level for this category has been less
than 100% which improves the chances of shares being accepted. Over the past three
buybacks, the average response rate has been ~54% with 2020 seeing higher
response rate of 76.6%.
Response
by small shareholders has been less than 100%
Buyback Year
Shares
Reserved
Shares
Tendered
Response (%)
2017
84,21,052
41,97,408
49.8
2018
1,14,28,572
40,16,984
35.1
2020
80,00,000
61,25,386
76.6
Source: Company, Angel Research; Note: Above data is for the small shareholder category
Although the total returns can vary depending on the acceptance ratio, a 30% to 50%
acceptance ratio can yield profits between 5.8% to 8.8% assuming that investors are
able to sell the balance shares at current price of `3,827 per share.
Potential return assuming 50% acceptance and unchanged price
Particulars
Shares
Price (`)
Value (
`)
Initial Purchase
44
3,826.6
-
1,68,368
Shares Tendered
22
4,500
.0
99,000
Price Impact on Balance Shares
22
3,826.6
84,184
Total
14,816
Returns
8.8%
Source: Company, Angel Research; Note: Calculation based on NSE closing as on 20 Jan, 2022
Sensitivity analysis of returns
Stock Price
Acceptance Ratio
3,367
3,597
3,827
4,056
4,286
30%
-
3.3%
1.0%
5.2%
9.4%
13.7%
40%
-
0.6%
3.1%
6.8%
10.5%
14.2%
50%
2.8%
5.8%
8.8%
11.8%
14.8%
60%
5.5%
7.9%
10.4%
12.9%
15.3%
65%
6.8%
9.0%
11.2%
13.4%
15.6%
Source: Company, Angel Research; Note: Calculation based on NSE closing as on 20 Jan, 2022

TCS |Buyback Update
January 21, 2022
3
Ratings (Based on Expected Returns: Buy (> 15%) Accumulate (5% to 15%) Neutral (-5 to 5%)
Over 12 months investment period) Reduce (-5% to -15%) Sell (< -15%)
Hold (Fresh purchase not recommended)
Research Team Tel: 022 - 40003600 E-mail: research@angelbroking.com Website: www.angelone.in
DISCLAIMER
Angel One Limited (hereinafter referred to as “Angel”) is a registered Member of National Stock Exchange of India Limited, Bombay Stock
Exchange Limited and Metropolitan Stock Exchange Limited. It is also registered as a Depository Participant with CDSL and Portfolio
Manager and investment advisor with SEBI. It also has registration with AMFI as a Mutual Fund Distributor. Angel One Limited is a
registered entity with SEBI for Research Analyst in terms of SEBI (Research Analyst) Regulations, 2014 vide registration number
INH000000164. Angel or its associates has not been debarred/ suspended by SEBI or any other regulatory authority for accessing
/dealing in securities Market.
This document is solely for the personal information of the recipient, and must not be singularly used as the basis of any investment
decision. Nothing in this document should be construed as investment or financial advice. Each recipient of this document should make
such investigations as they deem necessary to arrive at an independent evaluation of an investment in the securities of the companies
referred to in this document (including the merits and risks involved), and should consult their own advisors to determine the merits and
risks of such an investment.
Angel or its associates or research analyst or his relative may have actual/beneficial ownership of 1% or more in the securities of the
subject company at the end of the month immediately preceding the date of publication of the research report. Neither Angel or its
associates nor Research Analysts or his relative has any material conflict of interest at the time of publication of research report.
Angel or its associates might have received any compensation from the companies mentioned in the report during the period preceding
twelve months from the date of this report for services in respect of managing or co-managing public offerings, corporate finance,
investment banking or merchant banking, brokerage services or other advisory service in a merger or specific transaction in the normal
course of business. Angel or its associates did not receive any compensation or other benefits from the companies mentioned in the
report or third party in connection with the research report. Neither Angel nor its research analyst entity has been engaged in market
making activity for the subject company.
Reports based on technical and derivative analysis center on studying charts of a stock's price movement, outstanding positions and
trading volume, as opposed to focusing on a company's fundamentals and, as such, may not match with a report on a company's
fundamentals. Investors are advised to refer the Fundamental and Technical Research Reports available on our website to evaluate the
contrary view, if any.
The information in this document has been printed on the basis of publicly available information, internal data and other reliable sources
believed to be true, but we do not represent that it is accurate or complete and it should not be relied on as such, as this document is
for general guidance only. Angel One Limited or any of its affiliates/ group companies shall not be in any way responsible for any loss or
damage that may arise to any person from any inadvertent error in the information contained in this report. Angel One Limited has not
independently verified all the information contained within this document. Accordingly, we cannot testify, nor make any representation
or warranty, express or implied, to the accuracy, contents or data contained within this document. While Angel One Limited endeavors
to update on a reasonable basis the information discussed in this material, there may be regulatory, compliance, or other reasons that
prevent us from doing so.
This document is being supplied to you solely for your information, and its contents, information or data may not be reproduced,
redistributed or passed on, directly or indirectly.
Neither Angel One Limited, nor its directors, employees or affiliates shall be liable for any loss or damage that may arise from or in
connection with the use of this information. Angel or its associates or Research Analyst or his relative might have financial interest in
the subject company. Research analyst has not served as an officer, director or employee of the subject company.