Initiating Coverage | Auto Ancillary
January 8, 2014
Subros
BUY
CMP
`67
Well poised to ride passenger vehicle recovery
Target Price
`80
Investment Period
12 Months
Passenger vehicle industry to grow in double-digits over the next two
years: After two consecutive years of no growth, the passenger vehicle industry
has shown signs of recovery in the last few months. In the YTD FY2015 period
Stock Info
(April to November 2014), the industry witnessed a growth of 3%. Green shoots
Sector
Auto Ancillary
of revival in the industry are clearly visible and we expect the growth to accelerate
Market Cap (` cr)
404
over the next two years. Consumer sentiments have improved considerably and
Net Debt (` cr)
401
we expect the passenger vehicle industry to report a double-digit growth
Beta
1.5
(11% CAGR) over FY2015-2017 on account of (a) Improved economic outlook
52 Week High / Low
81 / 23
resulting in higher disposable incomes among consumers, (b) Downwerd trend in
Avg. Daily Volume
15,183
fuel prices resulting in lower cost of ownership, and (c) Expected reduction in
Face Value (`)
2
interest rates.
BSE Sensex
27,275
In-house manufacturing, higher capacity utilization, and JPY
Nifty
8,235
weakening to aid in margin improvement: Subros is targeting to reduce its
Reuters Code
SUBR.BO
raw material costs by increasing in-house manufacturing of components. It has
Bloomberg Code
SUBR@IN
started manufacturing certain components like evaporators, compressors and
heat exchange parts and invested in a tooling room which would enable it to
further localize other components. It aims to increase the localization of
Shareholding Pattern (%)
components and further bring down material costs to 65% of sales (from current
Promoters
40.0
68%) over the next two to three years. Also, a strong double-digit growth in the
MF / Banks / Indian Fls
10.1
passenger vehicle industry would improve its capacity utilisation levels (current
capacity utilization stands at ~55%), thus resulting in operating leverage. Further, the
FII / NRIs / OCBs
26.6
recent weakening of the Japanese Yen (JPY) would also boost margins, given that
Indian Public / Others
23.3
50% of the raw materials consumed by the company are JPY denominated imports.
Outlook and Valuation: We expect Subros to clock a revenue CAGR of 13% over
Abs. (%)
3m 1yr 3yr
FY2014-FY2017 aided by a recovery in the passenger vehicle industry and
Sensex
3.9
31.6
72.1
market share regain by its key clients. Initiation of supplies to Denso Corporation
would also boost Subros’ top-line. Also, Subros’ margins are expected to improve
Subros
2.7
149.7
199.1
owing to increased localisation, operating leverage and weakness in JPY. We also
expect the company’s interest costs to recede, given the reduction in the debt
levels. We expect Subros to report a PAT CAGR of 29% over FY2014-FY2017. At
the current market price of `67, the stock trades at 15.3x and 9.2x its FY2016
and FY2017 earnings, respectively. We initiate coverage on the stock with a Buy
recommendation and target price of `80 based on 11x FY2017E EPS, indicating
an upside of 19% from the current levels.
Key financials
Y/E March (` cr)
FY2014
FY2015E
FY2016E
FY2017E
Net sales
1,171
1,255
1,416
1,706
% chg
(7.9)
7.2
12.8
20.6
Net profit (Adj.)
20
19
26
44
% chg
(0.9)
(5.2)
36.8
66.1
EBITDA margin (%)
11.2
11.2
11.3
11.3
EPS (`)
3.4
3.2
4.4
7.3
P/E (x)
19.8
20.9
15.3
9.2
P/BV (x)
1.3
1.3
1.2
1.1
RoE (%)
6.9
6.2
8.1
12.4
RoCE (%)
7.7
7.4
9.0
12.3
Bharat Gianani
EV/Sales (x)
0.6
0.6
0.5
0.4
022-39357800 Ext: 6831
EV/EBITDA (x)
6.1
5.8
5.0
4.0
Source: Company, Angel Research, Note: CMP as of January 8, 2015
Please refer to important disclosures at the end of this report
1
B
Subros | Initiating Coverage
Investment Arguments
PV industry recovery to accelerate; set to grow in double-digits in
FY2016-17
For two consecutive years (FY2013 and FY2014), the demand for passenger
vehicles remained flat (declining by about 1%). The industry staged a recovery in
FY2015 on back of improved consumer sentiments post the election of the new
government. Passenger vehicle volumes have grown by 3% in YTD FY2015
(April-November 2014). Early signs of recovery are clearly visible and we expect
the pent up demand to drive passenger vehicle volumes. We expect the recovery to
accelerate further over FY2016-17 on account of (a) Improved economic growth
outlook with the government’s focus on policy reforms, (b) Stable/downward trend
in fuel prices, (c) Inflation being in a downward trajectory which is likely to lead to
lowering in interest rates. We expect the passenger vehicle industry to grow at a
CAGR of 11% over the next two years thereby retracting to its long term double
digit CAGR growth.
The passenger vehicle segment contributes by about 88% to Subros’ revenues. An
expected upcycle in the segment would thus boost Subros’ revenues.
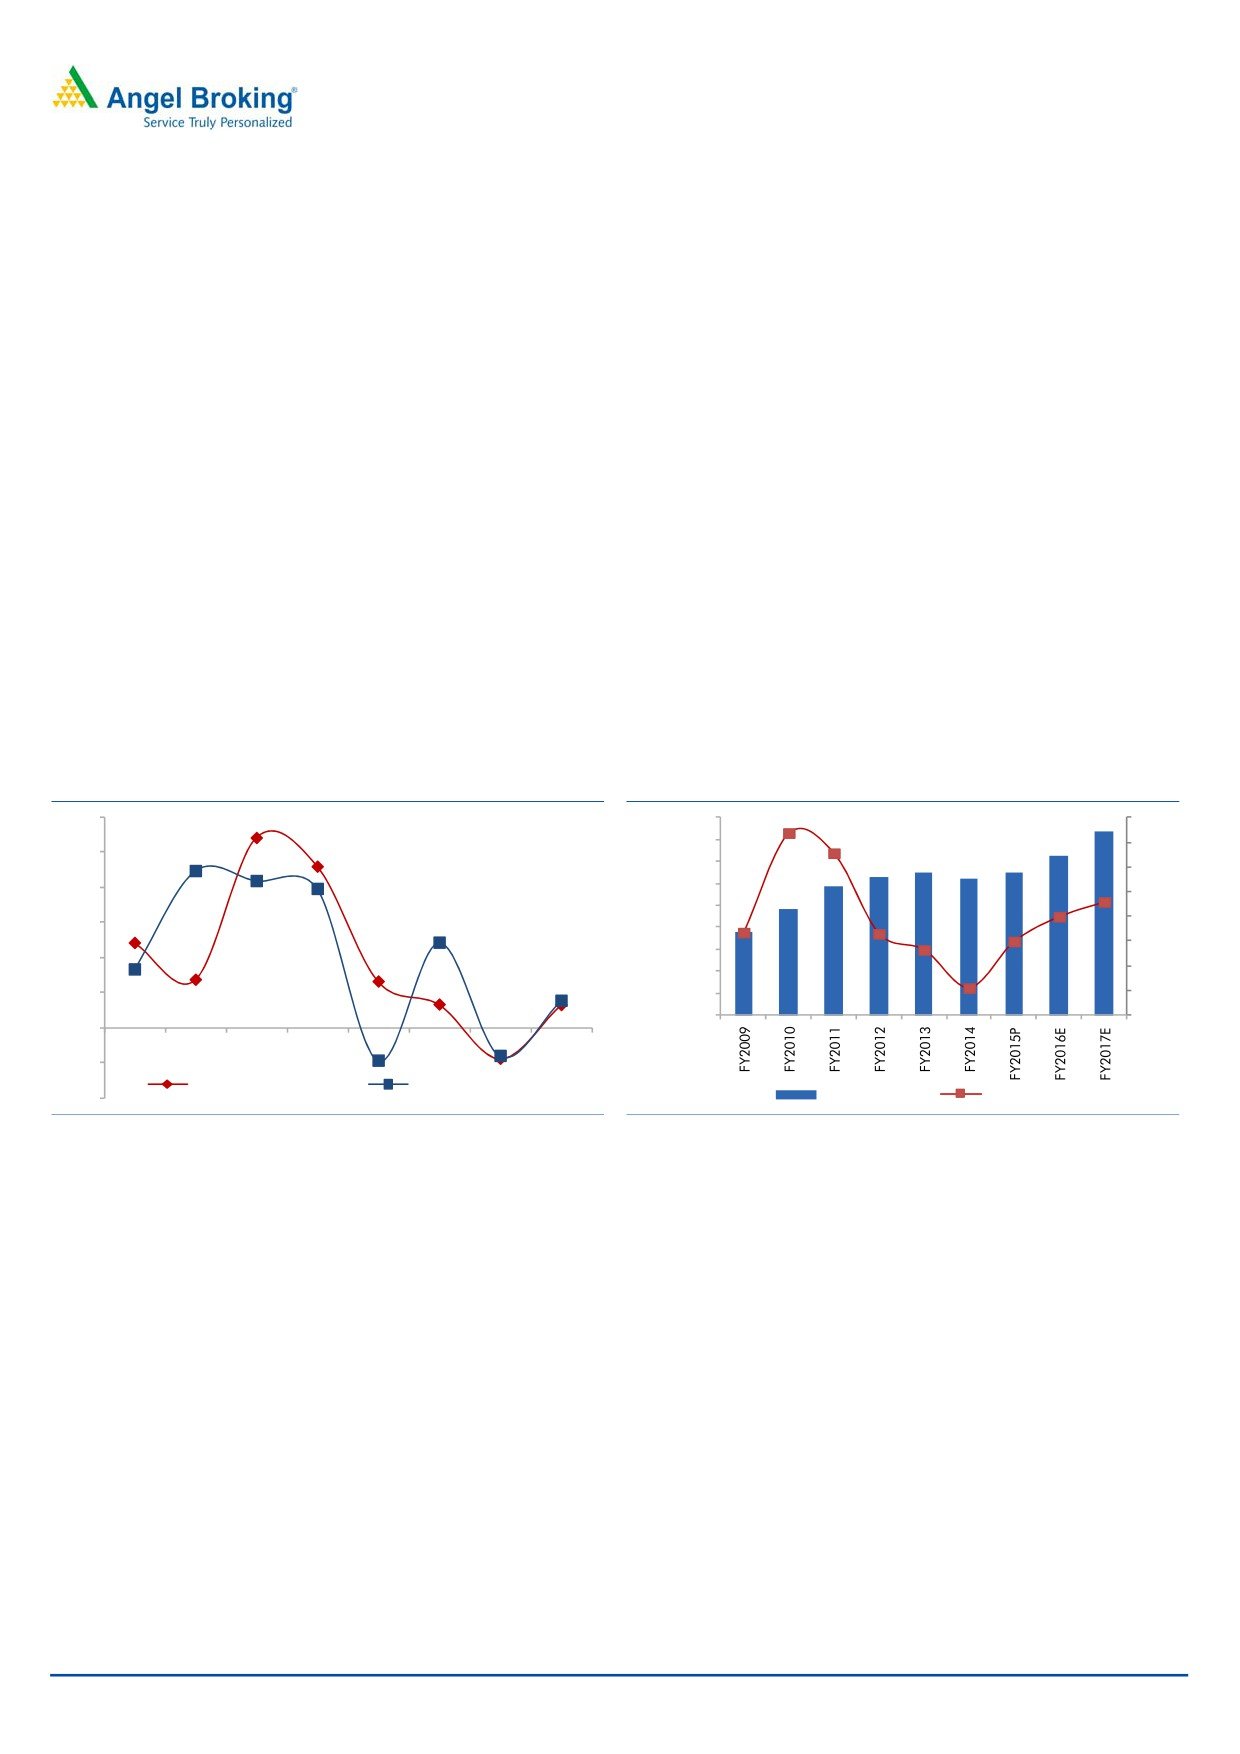
Exhibit 1: Correlation with PV volumes
Exhibit 2: PV industry growth trend
30
45,00,000
30.0
40,00,000
25.0
25
35,00,000
20.0
20
30,00,000
15.0
25,00,000
10.0
15
20,00,000
5.0
15,00,000
10
10,00,000
0.0
5
5,00,000
(5.0)
0
(10.0)
0
FY08
FY09
FY10
FY11
FY12
FY13
FY14
1H FY15
(5)
PV industry Growth (%)
Subros Kits Growth (%)
(10)
PV industry (units)
Growth yoy (%)
Source: Company, Angel Research
Source: SIAM, Angel Research
Market share regain by key clients to help Subros outpace PV
industry growth
Maruti Suzuki is the largest client for Subros constituting about 80% of the overall
revenues. M&M and Tata Motors contribute about 15% of the overall revenues.
Maruti Suzuki has outperformed the passenger vehicle industry in YTD FY2015 and
is likely to retain market share on back of new launches. Subros’ other customers
Mahindra & Mahindra (M&M) and Tata Motors however, have underperformed in
the last two years due to lack of new models and limited presence in the fast
growing petrol segment. The two lost market share by 250bp and 510bp,
respectively, over the aforementioned period. Overall, the market share of Subros’
customers viz Maruti Suzuki, M&M and Tata Motors, declined by ~400bp, over the
past two years.
January 8, 2015
2
Subros | Initiating Coverage
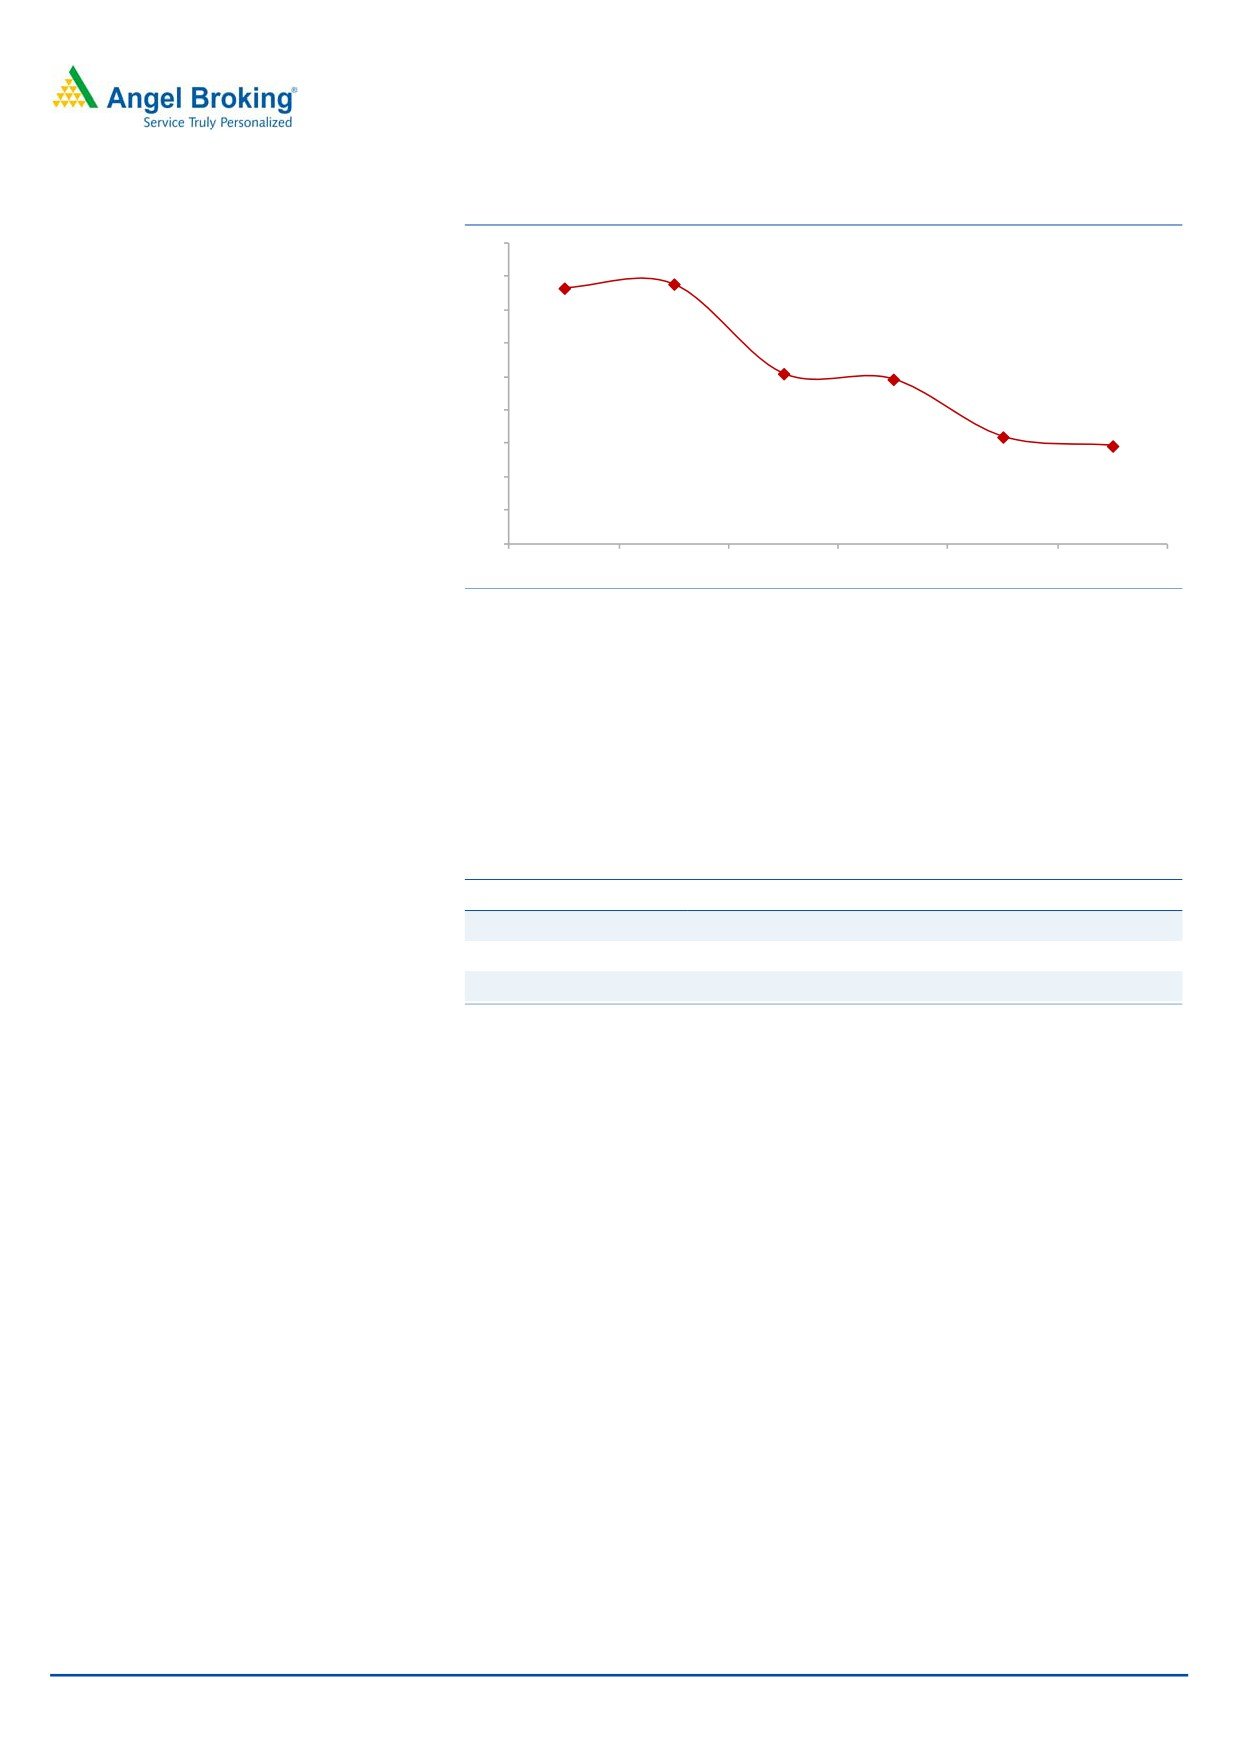
Exhibit 3: Cumulative Market share of key clients
64
62
60
58
56
54
52
50
48
46
FY2010
FY2011
FY2012
FY2013
FY2014
YTD FY2015
Source: SIAM, Angel Research
However, both M&M and Tata Motors have lined up new products which would
enable them to regain market share. M&M has planned three new product
launches in the compact UV space. It also aims to launch petrol variants
commencing from 4QFY2015. Further, Tata Motors has recently introduced “Zest”
and also plans to launch compact car “Bolt” in 4QFY2015. New product launches
by Subros’ key customers would enable it to outpace growth in passenger vehicles.
Exhibit 4: New product launches by key clientle
Clients
New launches
Maruti Suzuki
Crossover, Utility vehicle and LCV
M&M
Two compact utility vehicles and new LCV
Tata Motors
Bolt (hatchback) Nexon (Compact UV)
Source: Angel Research
Improving passenger vehicle outlook
Increased in-house manufacturing, operating leverage and JPY
coupled with new launches by key
depreciation to keep margins at elevated levels
customers will enable to outpace
Subros is focusing on increasing in-house manufacturing of components in order
industry growth
to reduce material costs. It earlier procured raw materials in the CKD format and
has recently shifted focus on in-house manufacturing. Increased localization has
enabled the company to bring down raw material costs from 72% of sales in
FY2012 to 69% in FY2014, thus resulting in margin improvement. Subros is
working on localization of critical parts such as evaporators, compressors and heat
exchangers. Further, it has also invested in the tooling center at Noida to prepare
dies and moulds, leading to in-house manufacturing of critical components. It
aims to accelerate the localization process further and is targeting to bring down
the raw material cost by about 300bp to 65% of sales over the next three years.
January 8, 2015
3
Subros | Initiating Coverage
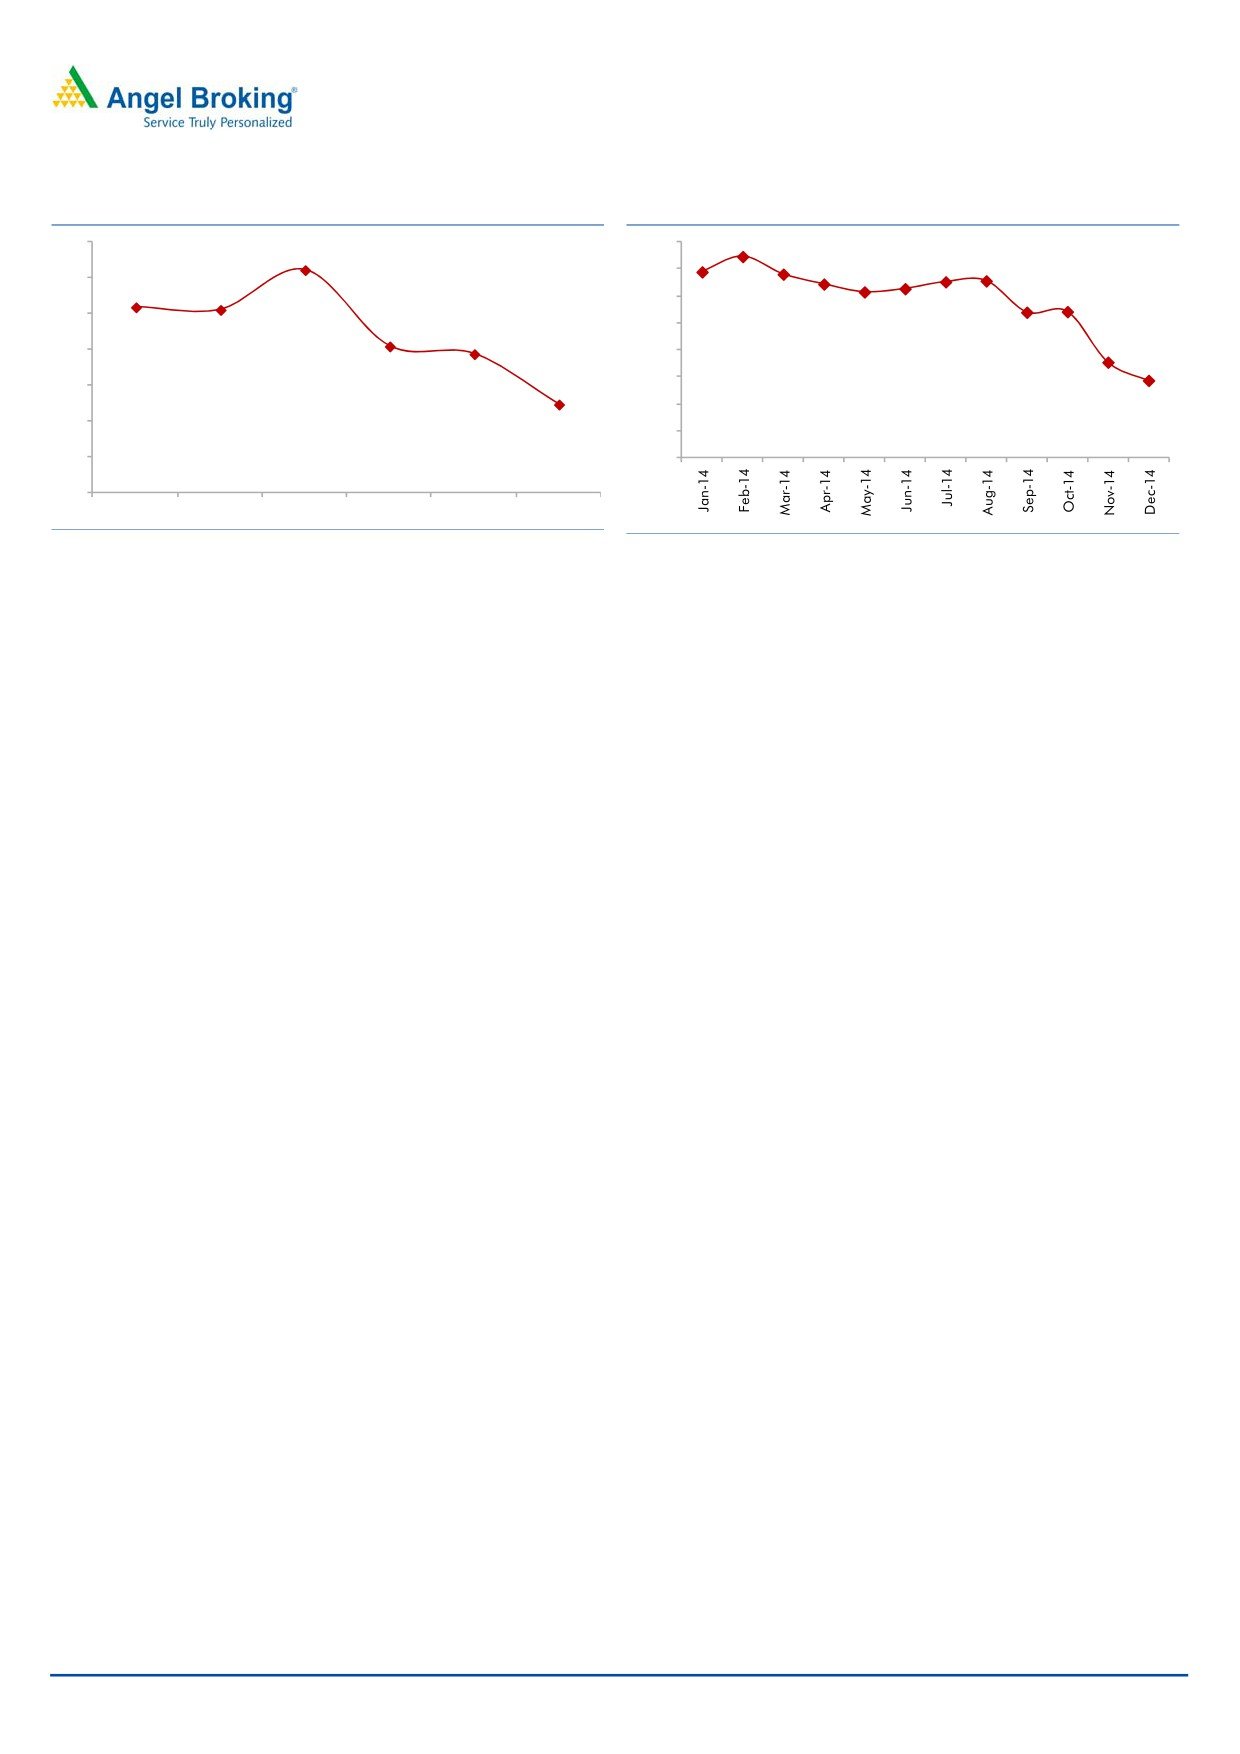
Exhibit 5: Raw material costs (% of sales)
Exhibit 6: INR-JPY trend
78
0.62
0.60
76
0.58
74
0.56
72
0.54
0.52
70
0.50
68
0.48
66
0.46
64
FY 2009
FY 2010
FY 2011
FY 2012
FY 2013
FY 2014
Source: Company, Angel Research
Source: Angel Research
Subros’ capacity utilisation levels are expected to improve on back of increased
offtake from its key customers. We expect the utilization levels to inch up from 55%
currently to 75% in FY2017, thus resulting in benefits of operating leverage. Also,
JPY has recently depreciated against the INR on back of monetary easing policy by
the Japanese government. The outlook for JPY remains weak in the medium term.
Subros would be the prime beneficiary of the weak JPY as raw material imports
from Japan constitute about 30% of overall sales.
Supply to Denso Corporation for Cooling modules and Radiators
to boost top-line and turnover ratios
Subros entered into a MoU with Denso Corporation for supply of cooling modules
and radiators. Subros would manufacture these products at its Manesar plant and
supply to Denso Corporation. The production would commence by early FY2017
and the company is aiming at revenues of `80cr in FY2017. At full utilization, the
project has a revenue potential of `200cr. The agreement entails a capex of `50cr
to be invested over FY2015-2017. The new order will require minimal capex as
the radiators would be manufactured at the existing Manesar plant and would also
utilize current machinery. Thus, the new order is expected to boost Subros’ top-line
and turnover ratios, going forward.
Capex cycle over, return ratios to improve on back of increased
capacity utilisation and debt reduction
Post the recent commissioning of the Chennai plant and increase in the kits
capacity, there is no major capex lined up for Subros over the next two years. The
capacity utilization is expected to improve due to recovery in the passenger vehicle
segment. Also, Subros plans to reduce the debt levels going ahead which will
boost its return ratios. We expect the company’s ROCE to improve from 7.7% in
FY2014 to 12.3% in FY2017. Similarly, ROE is estimated to reach 12% in FY2017
from 7% levels currently.
January 8, 2015
4
Subros | Initiating Coverage
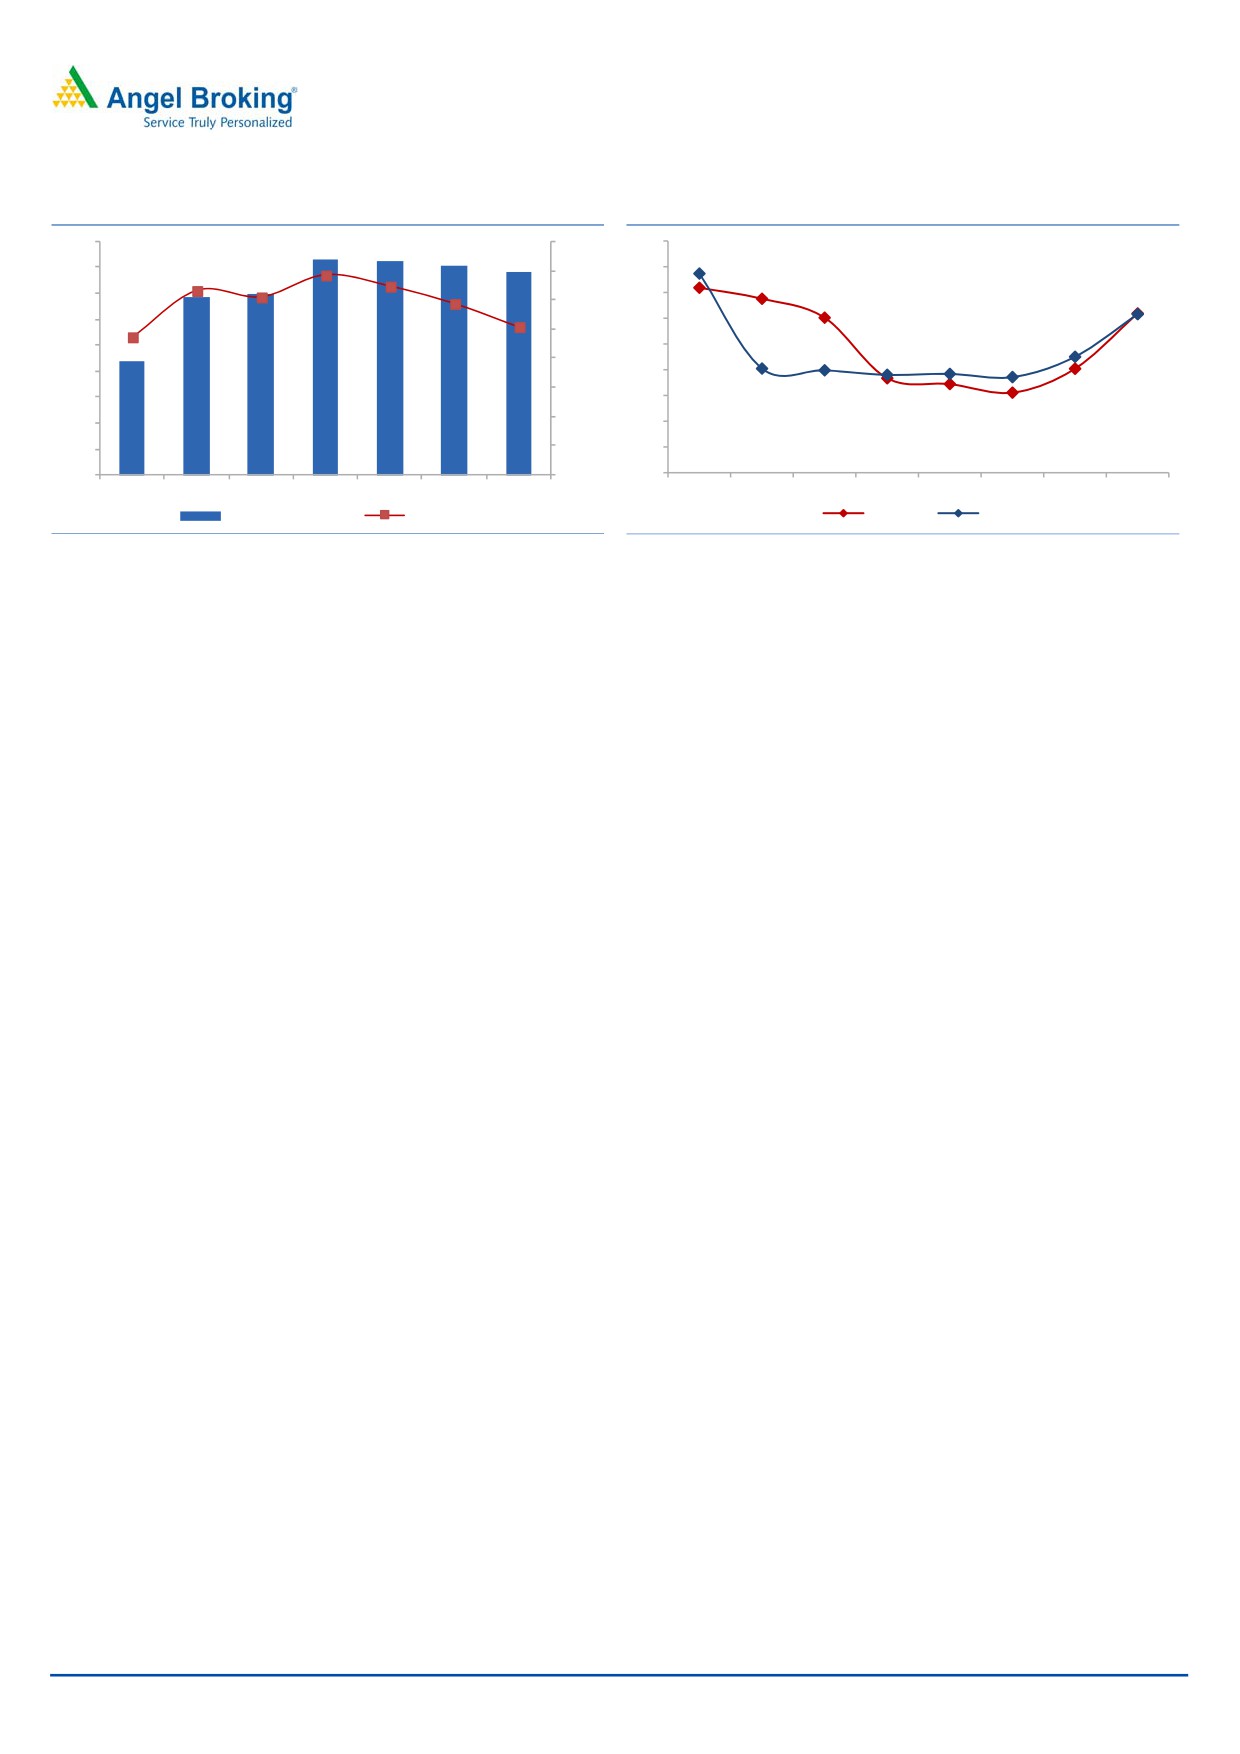
Exhibit 7: Debt levels
Exhibit 8: Return ratios
450
1.60
18
400
1.40
16
350
14
1.20
300
12
1.00
250
10
0.80
200
8
0.60
150
6
100
0.40
4
50
0.20
2
0
0.00
0
FY2011
FY2012
FY2013
FY2014
FY2015E FY2016E FY2017E
FY2010
FY2011
FY2012
FY2013
FY2014 FY2015E FY2016E FY2017E
Debt (` cr)
D/E Ratio (x)
ROE (%)
ROCE (%)
Source: Company, Angel Research
Source: Company, Angel Research
Commercial vehicle A/C and refrigerated units to provide the
next leg of growth
The trend for air-conditioning (A/C) in commercial vehicles is expected to pick up
going forward. State Transport Undertakings are increasingly placing orders for
air-conditioned buses to improve passenger comfort. Also, light commercial
vehicle (LCV) manufacturers such as Tata Motors, M&M and Ashok Leyland have
introduced air conditioned cabins in their top-end vehicles. We expect commercial
vehicle manufacturers to increasingly opt for A/C systems in line with the trend in
the developed markets. However, we expect the trend to take some time and a
meaningful opportunity to emerge only after two to three years. Subros, being the
only integrated manufacturer with established supplies to the passenger vehicle
segment, would benefit immensely from this trend.
Also, in order to tap new business segments, Subros provides complete
refrigerated solutions to automotive OEMs. It offers fully integrated solutions
comprising of refrigeration kit and a specially insulated container which is fitted on
vehicle chassis. It currently supplies to Ashok Leyland “Dost” vehicles and has also
tied up with Tata Motors and M&M. Subros aims to ramp supplies to CV
manufacturers from its Chennai plant, enabling it to diversify its business model
and reduce concentration on a particular segment.
Outlook and Valuation
We expect Subros to clock a revenue CAGR of 13% over FY2014-FY2017 aided by
a recovery in the passenger vehicle industry and market share regain by its key
clients. Initiation of supplies to Denso Corporation would also boost Subros’
top-line. Also, Subros’ margins are expected to improve owing to increased
localisation, operating leverage and weakness in JPY. We also expect the
company’s interest costs to recede, given the reduction in the debt levels. We
expect Subros to report a PAT CAGR of 29% over FY2014-FY2017. At the current
market price of `67, the stock trades at 15.3x and 9.2x its FY2016 and FY2017
earnings, respectively. We initiate coverage on the stock with a Buy
recommendation and target price of `80 based on 11x FY2017E EPS, indicating
an upside of 19% from the current levels.
January 8, 2015
5
Subros | Initiating Coverage
Exhibit 9: One-year forward P/E band
140
120
100
80
60
40
20
0
Price
4x
8x
12x
16x
Source: Company, Angel Research
Company Background
Subros was incorporated in 1985 as a joint venture company with 40% ownership
by Suri family and
13% each by Denso Corporation and Suzuki Motor
Corporation. Subros, in technical collaboration with Denso, is the leading
manufacturer of thermal products for automotive applications. It is the only
integrated manufacturer for Auto air-conditioning units. It manufactures
compressors, condensers, heat exchanges and all connecting elements required to
complete AC loop. Subros caters to all the automotive segments viz passenger
vehicles, commercial vehicles, off-roaders and railways. It has a well diversified
presence and is located at almost all automobile manufacturing hubs. It has plants
in Noida and Manesar (Northern region), Pune and Sanand (Western region) and
has recently set up a plant in Chennai to cater to South based OEMs.
The passenger vehicle segment, contributing about 88% of the overall revenues, is
its prime segment. Subros has 30% market share in the segment, supplying to key
customers like Maruti Suzuki, M&M and Tata Motors. The commercial vehicle
segment forms about 7% of the overall revenues with the company supplying to
Force Motors, Ashok Leyland and Daimler (Bharat Benz). It also supplies
refrigerated vans to customers besides supplying to the Railways.
Exhibit 10: Product-wise break up
Exhibit 11: Segment wise revenue break up
Ventilator-Fan
Others, 8%
Commercial
Others, 5%
Motor
vehicle, 7%
Assembly, 3%
Air
Conditioning
Passenger
System, 89%
vehicles, 88%
Source: Company, Angel Research
Source: Company, Angel Research
January 8, 2015
6
Subros | Initiating Coverage
Profit & Loss Statement
Y/E March (` cr)
FY2012
FY2013
FY2014
FY2015E
FY2016E
FY2017E
Total operating income
1,116
1,272
1,171
1,255
1,416
1,706
% chg
2.4
14.0
(7.9)
7.2
12.8
20.6
Total Expenditure
1,019
1,150
1,040
1,114
1,256
1,513
Net Raw Materials
805
912
807
867
980
1,181
Other Mfg costs
60
63
58
64
72
87
Personnel
84
100
105
110
120
145
Other
69
74
69
73
84
101
EBITDA
97
122
131
141
160
193
% chg
30.3
26.1
7.5
6.9
13.8
20.9
(% of Net Sales)
8.7
9.6
11.2
11.2
11.3
11.3
Depreciation & Amortisation
53
73
77
85
91
97
EBIT
44
50
54
56
69
96
% chg
29.7
13.1
9.1
3.3
23.5
39.3
(% of Net Sales)
3.9
3.9
4.6
4.5
4.9
5.6
Interest & other Charges
26
36
37
41
41
40
Other Income
22
11
2
4
5
6
PBT (reported)
40
25
19
18
33
62
% chg
22.3
(39.1)
(21.6)
(4.1)
77.8
89.8
Extraordinary Expense/(Inc.)
18
0
0
0
0
0
PBT (adjusted)
59
25
19
18
33
62
Tax
10
4
(1)
(1)
7
19
(% of PBT)
17.4
16.4
(5.3)
(4.0)
20.0
30.0
PAT (reported)
48
21
20
19
26
44
ADJ. PAT
30
20
20
19
26
44
% chg
2.1
(32.2)
(0.9)
(5.2)
36.8
66.1
(% of Net Sales)
2.7
1.6
1.7
1.5
1.9
2.6
Basic EPS (`)
8.1
3.4
3.4
3.2
4.4
7.3
Fully Diluted EPS (`)
5.0
3.4
3.4
3.2
4.4
7.3
% chg
2.1
(32.2)
(0.9)
(5.2)
36.8
66.1
January 8, 2015
7
Subros | Initiating Coverage
Balance sheet statement
Y/E March (` cr)
FY2012 FY2013 FY2014 FY2015E FY2016E FY2017E
SOURCES OF FUNDS
Equity Share Capital
12
12
12
12
12
12
Reserves& Surplus
259
275
290
304
323
359
Shareholders Funds
271
287
302
316
335
371
Total Loans
342
349
414
416
409
389
Deferred Tax Liability
25
28
27
27
27
27
Other long term liab.
0
0
0
0
0
0
Long term provisions
2
3
2
2
2
2
Total Liabilities
640
667
745
761
774
790
APPLICATION OF FUNDS
Gross Block
720
848
963
1,054
1,132
1,210
Less: Acc. Depreciation
334
403
480
564
655
752
Net Block
386
445
483
490
477
458
Capital WIP
90
107
103
116
125
133
Investments
3
3
3
4
4
4
Loans and adv.
41
42
51
51
51
51
Other non curren assets
0
0
0
0
0
0
Current Assets
324
285
273
285
325
393
Cash
12
11
11
6
11
15
Loans & Advances
58
38
25
31
35
43
Other
255
236
238
247
279
336
Current liabilities
204
214
168
185
209
250
Net Current Assets
120
71
105
100
116
143
Total Assets
640
667
745
761
774
790
January 8, 2015
8
Subros | Initiating Coverage
Cash flow statement
Y/E March (` cr)
FY2012
FY2013
FY2014
FY2015E FY2016E FY2017E
Profit before tax
59
25
19
18
33
62
Depreciation
53
70
76
85
91
97
Change in Working Capital
(59)
48
(34)
1
(12)
(23)
Others
22
3
(11)
(0)
-
-
Other income
(22)
(11)
(2)
(4)
(5)
(6)
Direct taxes paid
(10)
(4)
1
1
(7)
(19)
Cash Flow from Operations
42
131
49
100
100
112
(Inc.)/ Dec. in Fixed Assets
(189)
(145)
(111)
(105)
(86)
(86)
(Inc.)/ Dec. in Investments
(0)
0
0
(1)
(0)
(0)
Other income
22
11
2
4
5
6
Cash Flow from Investing
(167)
(134)
(109)
(102)
(82)
(81)
Issue of Equity
0
0
(0)
0
0
0
Inc./(Dec.) in loans
124
7
64
3
(7)
(20)
Dividend Paid (Incl. Tax)
8
5
5
6
7
8
Cash Flow from Financing
117
2
59
(3)
(14)
(28)
Inc./(Dec.) in Cash
(9)
(1)
(0)
(4)
5
4
Opening Cash balances
20
12
11
11
6
11
Closing Cash balances
12
11
11
6
11
15
January 8, 2015
9
Subros | Initiating Coverage
Key ratios
Y/E March
FY2012
FY2013
FY2014
FY2015E
FY2016E
FY2017E
Valuation Ratio (x)
P/E (on FDEPS)
12.9
19.0
19.3
20.9
15.3
9.2
P/CEPS
4.7
4.2
4.0
3.9
3.4
2.9
P/BV
1.4
1.4
1.3
1.3
1.2
1.1
Dividend yield (%)
1.7
1.1
1.1
1.2
1.5
1.6
EV/Sales
0.6
0.5
0.6
0.6
0.5
0.4
EV/EBITDA
7.4
6.0
6.0
5.8
5.0
4.0
EV / Total Assets
1.1
1.1
1.1
1.1
1.0
1.0
Per Share Data (`)
EPS (Basic)
5.0
3.4
3.4
3.2
4.4
7.3
EPS (fully diluted)
5.0
3.4
3.4
3.2
4.4
7.3
Cash EPS
13.9
15.5
16.2
17.3
19.5
23.5
DPS
1.1
0.7
0.7
0.8
1.0
1.1
Book Value
45.1
47.8
50.3
52.6
55.8
61.8
Dupont Analysis
EBIT margin
3.9
3.9
4.6
4.5
4.9
5.6
Tax retention ratio
0.8
0.8
1.1
1.0
0.8
0.7
Asset turnover (x)
2.1
2.0
1.7
1.7
1.9
2.2
ROIC (Post-tax)
6.8
6.5
8.2
7.8
7.3
8.8
Cost of Debt (Post Tax)
7.6
8.7
10.3
10.4
8.0
7.0
Leverage (x)
1.0
1.2
1.3
1.3
1.2
1.1
Operating ROE
5.8
3.8
5.6
4.4
6.4
10.7
Returns (%)
ROCE (Pre-tax)
8.0
7.6
7.7
7.4
9.0
12.3
Angel ROIC (Pre-tax)
7.0
7.6
7.4
7.4
9.1
12.4
ROE
12.0
7.3
6.9
6.2
8.1
12.4
Turnover ratios (x)
Asset Turnover (Gross Block)
1.7
1.6
1.3
1.2
1.3
1.5
Inventory / Sales (days)
58
55
55
55
55
55
Receivables (days)
21
17
16
17
17
17
Payables (days)
62
60
51
52
52
52
WC cycle (ex-cash) (days)
26
24
24
27
26
25
Solvency ratios (x)
Net debt to equity
1.2
1.2
1.3
1.3
1.2
1.0
Net debt to EBITDA
3.4
2.8
3.0
2.9
2.5
1.9
Interest Coverage (EBIT / Int.)
1.7
1.4
1.5
1.3
1.7
2.4
January 8, 2015
10
Subros | Initiating Coverage
Research Team Tel: 022 - 39357800
DISCLAIMER
This document is solely for the personal information of the recipient, and must not be singularly used as the basis of any investment
decision. Nothing in this document should be construed as investment or financial advice. Each recipient of this document should
make such investigations as they deem necessary to arrive at an independent evaluation of an investment in the securities of the
companies referred to in this document (including the merits and risks involved), and should consult their own advisors to determine
the merits and risks of such an investment.
Angel Broking Pvt. Limited, its affiliates, directors, its proprietary trading and investment businesses may, from time to time, make
investment decisions that are inconsistent with or contradictory to the recommendations expressed herein. The views contained in this
document are those of the analyst, and the company may or may not subscribe to all the views expressed within.
Reports based on technical and derivative analysis center on studying charts of a stock's price movement, outstanding positions and
trading volume, as opposed to focusing on a company's fundamentals and, as such, may not match with a report on a company's
fundamentals.
The information in this document has been printed on the basis of publicly available information, internal data and other reliable
sources believed to be true, but we do not represent that it is accurate or complete and it should not be relied on as such, as this
document is for general guidance only. Angel Broking Pvt. Limited or any of its affiliates/ group companies shall not be in any way
responsible for any loss or damage that may arise to any person from any inadvertent error in the information contained in this report.
Angel Broking Pvt. Limited has not independently verified all the information contained within this document. Accordingly, we cannot
testify, nor make any representation or warranty, express or implied, to the accuracy, contents or data contained within this document.
While Angel Broking Pvt. Limited endeavours to update on a reasonable basis the information discussed in this material, there may be
regulatory, compliance, or other reasons that prevent us from doing so.
This document is being supplied to you solely for your information, and its contents, information or data may not be reproduced,
redistributed or passed on, directly or indirectly.
Angel Broking Pvt. Limited and its affiliates may seek to provide or have engaged in providing corporate finance, investment banking
or other advisory services in a merger or specific transaction to the companies referred to in this report, as on the date of this report or
in the past.
Neither Angel Broking Pvt. Limited, nor its directors, employees or affiliates shall be liable for any loss or damage that may arise from
or in connection with the use of this information.
Note: Please refer to the important `Stock Holding Disclosure' report on the Angel website (Research Section). Also, please refer to the
latest update on respective stocks for the disclosure status in respect of those stocks. Angel Broking Pvt. Limited and its affiliates may
have investment positions in the stocks recommended in this report.
Disclosure of Interest Statement
Subros
1. Analyst ownership of the stock
No
2. Angel and its Group companies ownership of the stock
No
3. Angel and its Group companies' Directors ownership of the stock
No
4. Broking relationship with company covered
No
Note: We have not considered any Exposure below ` 1 lakh for Angel, its Group companies and Directors
Ratings (Returns):
Buy (> 15%)
Accumulate (5% to 15%)
Neutral (-5 to 5%)
Reduce (-5% to -15%)
Sell (< -15%)
January 8, 2015
11
Subros | Initiating Coverage
6th Floor, Ackruti Star, Central Road, MIDC, Andheri (E), Mumbai- 400 093. Tel: (022) 39357800
Research Team
Fundamental:
Sarabjit Kour Nangra
VP-Research, Pharmaceutical
Vaibhav Agrawal
VP-Research (Banking)
Amarjeet Maurya
Analyst (FMCG, Media, Mid-Cap)
Bharat Gianani
Analyst (Automobile)
Rahul Dholam
Analyst (Metal, Oil & Gas)
Santosh Yellapu
Analyst (Infrastructure)
Shrenik Gujrathi
Analyst (Cap Goods, Cement)
Umesh Matkar
Analyst (Banking)
Twinkle Gosar
Analyst (Mid-Cap)
Tejas Vahalia
Research Editor
Technicals and Derivatives:
Siddarth Bhamre
Head - Technical & Derivatives
Sameet Chavan
Technical Analyst
Sneha Seth
Associate (Derivatives)
Institutional Sales Team:
Mayuresh Joshi
VP - Institutional Sales
Meenakshi Chavan
Dealer
Gaurang Tisani
Assistant Manager
Production Team:
Dilip Patel
Production Incharge
CSO & Registered Office: G-1, Ackruti Trade Centre, Road No. 7, MIDC, Andheri (E), Mumbai - 93. Tel: (022) 3083 7700. Angel Broking Pvt. Ltd: BSE Cash: INB010996539 / BSE F&O: INF010996539, CDSL Regn. No.: IN - DP - CDSL - 234 - 2004, PMS Regn. Code: PM/INP000001546, NSE Cash: INB231279838 /
NSE F&O: INF231279838 / NSE Currency: INE231279838, MCX Stock Exchange Ltd: INE261279838 / Member ID: 10500. Angel Commodities Broking (P) Ltd.: MCX Member ID: 12685 / FMC Regn. No.: MCX / TCM / CORP / 0037 NCDEX: Member ID 00220 / FMC Regn. No.: NCDEX / TCM / CORP / 0302.
January 8, 2015
12