OFS note | Petrochemicals
May 20, 2013
Styrolution ABS
SUBSCRIBE
sue Open: March 21, 2013
Is
Attractive Valuation
Issue Close: March 21, 2013
Company Background
Styrolution ABS (name changed from INEOS ABS India Ltd. effective from
Issue details
(`)
March 1, 2012) is a leading manufacturer of an engineering plastic namely
Face Value
10
styrene monomer, polystyrene and ABS. The company is a 50/50 joint venture
Present Equity Paid-up Capital
17.59cr
between BASF and INEOS ABS formed by combining the styrenic business of two
Offer size
86.7cr
of the largest global chemical companies. In the domestic market, Styrolution is the
Post Equity Paid-up Capital
17.59cr
market leader and holds 60% market share in ABS resins segment and 68% in
Issue Size (no of shares)
2,167,562
SAN resins segment.
Issue Size (amount)
86.7cr
The Promoter, Styrolution Jersey, also the parent company proposes to sell
OFS Floor Price
400
2,167,562 equity shares (12.3% of total paid up equity capital) at `400 per share
Promoters holding Pre-Issue
87.3
in order to abide by the June 2010 amendment of ‘Securities Contract Act’
Promoters holding Post-Issue
75.0
mandates listed companies to have a minimum 25% of public shareholding by
June 2013.
Persisting short supply coupled with capacity expansion to boost growth
Styrolution which has expanded its capacity (ABS from 60,000TPA in 2010 to
Post Issue share-holding Pattern
(%)
80,000TPA in 2011) has an opportunity to reap benefits owing to domestic ABS
Promoter
75.0
demand supply gap (met by imports) which has persisted for long and continues to
MF/Banks/Indian Fls/FII/NRIs
25.0
exist. Further, CRISIL Research estimates that the domestic supply of ABS would
/OCBs/Public/Others
grow at 17% CAGR in order to meet the demand growth of 10% CAGR during
CY2010-15E, providing revenue visibility for the company. Thus, persisting short
supply and continued demand growth coupled with capacity expansion is to
enhance the top-line growth of the company.
Outlook and valuation
We expect Styrolution’s revenue to post a CAGR of 11.2% over CY2012-14E to
`1,223cr in CY2014E on the back of consistent developments by the company.
The EBITDA and net profit are expected to post a CAGR of 11.1% and 11.8%
respectively over CY2012-14E. At OFS floor price, the stock is attractively valued at
5.2x PE for CY2014E earnings and at 23% discount to its last traded price
(20th May, 2013). Hence we recommend investors to Subscribe for Styrolution OFS.
Key Financials (Standalone)
Y/E Dec (` cr)
CY2010
CY2011 CY2012 CY2013E
CY2014E
Net Sales
742
825
989
1,068
1,223
% chg
32.8
11.2
19.8
8.1
14.4
Net Profit
70
54
62
67
78
% chg
43.0
(22.9)
14.8
7.9
15.8
EBITDA (%)
15.2
9.9
9.6
9.6
9.6
EPS (`)
39.8
30.7
35.3
38.1
44.1
P/E (x)
13.1
17.0
14.8
13.7
11.8
P/BV (x)
2.7
2.4
2.1
1.9
1.6
RoE (%)
23.1
15.1
15.2
14.4
14.7
RoCE (%)
50.7
17.9
16.9
17.0
18.5
Twinkle Gosar
EV/Sales (x)
1.0
1.1
0.9
0.8
0.7
Tel: 022- 3935 7800 Ext: 6848
EV/EBITDA (x)
6.8
10.8
9.8
8.8
7.4
Source: Company, Angel Research
Please refer to important disclosures at the end of this report
1
Styrolution ABS | OFS note
Company Background
Styrolution ABS (name changed from INEOS ABS India Ltd. effective from March 1,
2012) is a leading manufacturer of an engineering plastic namely styrene
monomer, polystyrene and ABS. The company is a 50/50 joint venture between
BASF and INEOS ABS formed by combining the styrenic business of two of the
largest global chemical companies. In the domestic market, Styrolution is the
market leader and holds 60% market share in ABS resins segment and 68% in
SAN resins segment.
Styrolution (Promoters held 83.33% stake in Dec’11) made an open offer to the
shareholders with the offer cash price of `606.8 for balance 16.67% stake.
Resultant to open offer 4% of the shares were received and Promoters stake stood
at 87.33%.
Issue details
The Promoter, Styrolution Jersey, also the parent company proposes to sell
2,167,562 equity shares of face value `10 each representing 12.3% of the total
paid up equity share capital of the company. The stake sell is offered in order to
abide by the June 2010 amendment of ‘Securities Contract Act’ which mandates
listed companies to have a minimum 25% of public shareholding by June 2013.
Styrolution has fixed the OFS floor price at `400 per share.
Exhibit 1: Shareholding Pattern
Pre issue
Post issue
Particulars
No of shares
%
No of shares
%
Promoter and promoter group
15,356,780
87.3
13,189,218
75.0
Total public holding
2,228,845
12.7
4,396,407
25.0
Total
17,585,625
100
17,585,625
100
Source: Company, Angel Research
May 20, 2013
2
Styrolution ABS | OFS note
Investment Rationale
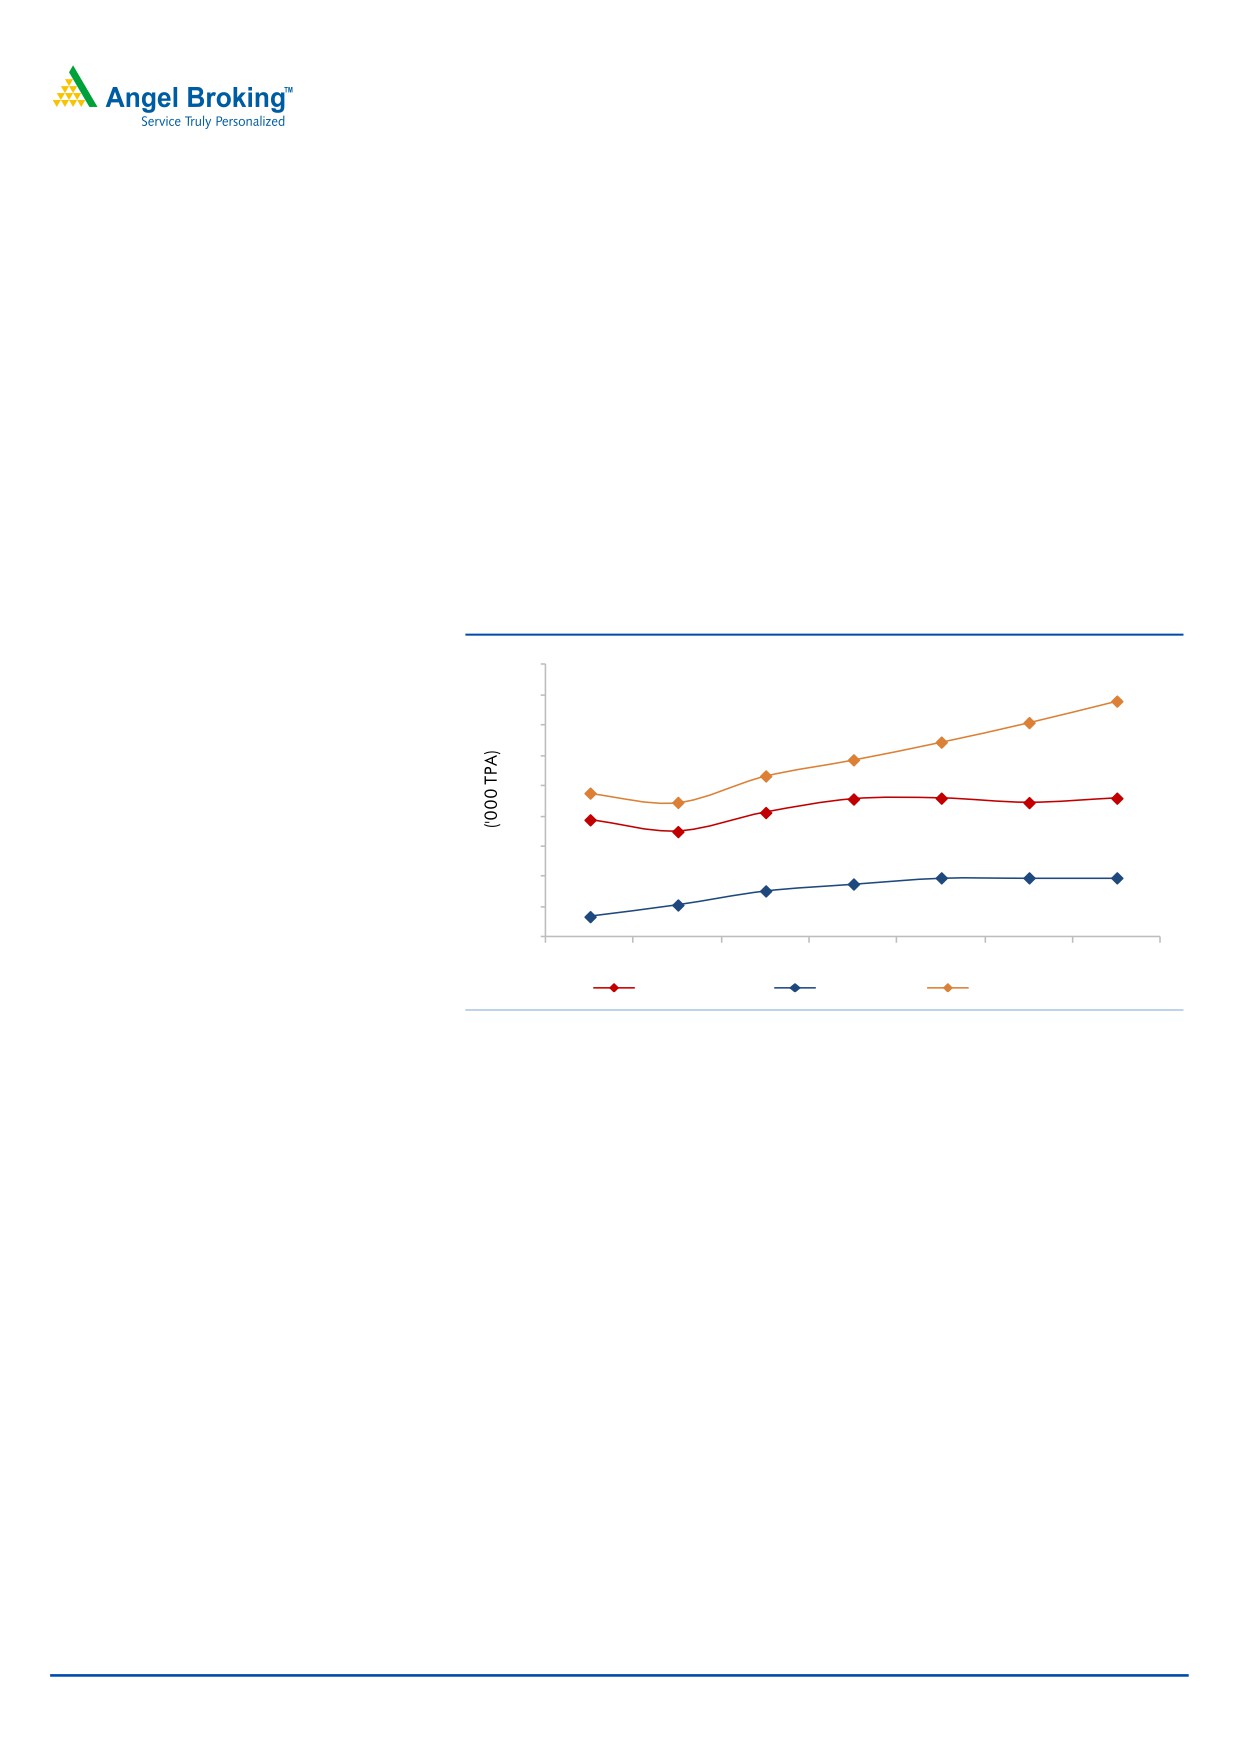
Capacity expansion to compliment unfulfilled ABS demand
The gap between domestic demand for ABS vis-a-vis supply has persisted for long
and the same still continues to exist. The unfulfilled demand is being met by
imports. CRISIL Research estimates that the supply of ABS would grow at 17%
CAGR in order to meet the demand growth of 10% CAGR during CY2010-15E.
Styrolution has expanded its capacity of ABS from
60,000TPA in
2010to
80,000TPA in 2011 and has plans to extend capacity further to 110,000TPA in
CY2013. This extended capacity will enable Styrolution to tap the unfulfilled
demand in the industry. Assuming the market share of Styrolution to remain
constant at 60%, volumes for ABS are likely to grow by ~12% over this period.
Exhibit 2: Unfulfilled domestic demand owing to demand supply gap
180
160
140
120
100
80
60
40
20
0
CY2008
CY2009
CY2010
CY2011
CY2012
CY2013E CY2014E
ABS Production
ABS import
ABS demand
Source: Company, Angel Research
Debt free and high return ratios
The company has its Debt to Equity at 0.2 times while Net Debt is at almost
negligible level. Moreover, Styrolution has successfully delivered handsome returns
of more than 15% on equity as well as invested capital over last five years, thereby
assuring robust returns.
Tailor-made products as per market and consumer demand
Considering the rising demand for polymers in varied industries, Styrolution has
been consistently expanding its capacity and simultaneously co-polymerising ABS
ie, changing polymer composition and blending. The company has come up with
many tailor made products taking advantage of ABS’ flexibility of composition and
structure, which allows its use in diverse applications.
May 20, 2013
3
Styrolution ABS | OFS note
Exhibit 3: Application Industry Composition
Textiles
Others
Stationary/
Home
3%
6%
helmet
Appliances
9%
30%
Luggage & bus
body
4%
Business
machine office
automation
8%
Electrical &
Automobiles
electronics
Telecom
28%
7%
5%
Source: Company
Outlook and valuation
We expect Styrolution’s revenue to post a CAGR of 11.2% to `1,223cr over
CY2012-14E on the back of consistent expansion plans of the company coupled
with revival in user industry. EBITDA is expected to grow at 11.1% CAGR to `117cr
in CY2014E. The rise in manufacturing cost due to high feedstock prices and
currency depreciation is expected to be passed on to the consumers by price hike,
thereby offsetting any negative impact on EBITDA margin. Hence, EBITDA margin
is expected to remain constant at 9.6% in CY2013E and CY2014E. The net profit is
expected to post a CAGR of 11.8% to `78cr in CY2014E while margins are to
remain stable at 6.3% owing to stable operating performance. At OFS floor price,
the stock is attractively valued at 5.2x PE for CY2014E earnings and at 23%
discount to its last traded price (20th May, 2013). Hence, we recommend investors
to Subscribe for Styrolution OFS.
May 20, 2013
4
Styrolution ABS | OFS note
Profit and Loss (Standalone)
Y/E December (` cr)
CY2010
CY2011
CY2012
CY2013E
CY2014E
Gross sales
816
910
1,090
1,178
1,348
Less: Excise duty
74
84
101
109
125
Net Sales
742
825
989
1,068
1,223
Other operating income
-
-
-
-
-
Total operating income
742
825
989
1,068
1,223
% chg
32.8
11.2
19.8
8.1
14.4
Net Raw Materials
522
620
750
814
932
% chg
44.8
18.8
21.0
8.6
14.5
Other Mfg costs
36
41
46
45
52
% chg
5.7
12.9
10.7
(0.6)
14.4
Personnel
20
24
27
30
34
% chg
16.1
16.1
16.2
8.1
14.4
Other
51
59
71
77
88
% chg
(15.9)
15.9
19.8
8.1
14.4
Total Expenditure
629
744
894
965
1,105
EBITDA
113
82
95
103
117
% chg
31.0
(27.6)
16.4
8.2
14.1
EBITDA Margin
15.2
9.9
9.6
9.6
9.6
Depreciation & Amortisation
14
14
14
16
16
EBIT
99
68
82
87
102
% chg
38.0
(31.5)
20.3
7.2
16.0
(% of Net Sales)
13.3
8.2
8.3
8.2
8.3
Interest & other Charges
2
2
1
-
-
Other Income
5
11
11
12
13
(% of Net Sales)
0.7
1.4
1.1
1.1
1.1
Recurring PBT
97
66
81
87
102
% chg
37.9
(31.9)
22.0
8.3
16.0
PBT (reported)
103
78
92
99
115
Tax
33
24
30
32
37
(% of PBT)
31.8
30.3
32.6
32.6
32.6
PAT (reported)
70
54
62
67
78
Extraordinary Expense/(Inc.)
(0)
(0)
-
-
-
ADJ. PAT
70
54
62
67
78
% chg
43.0
(22.9)
14.8
7.9
15.8
(% of Net Sales)
9.4
6.5
6.3
6.3
6.3
Basic EPS (`)
40
31
35
38
44
Fully Diluted EPS (`)
40
31
35
38
44
% chg
43.0
(22.9)
14.8
7.9
15.8
May 20, 2013
5
Styrolution ABS | OFS note
Balance Sheet (Standalone)
Y/E December (` cr)
CY2010
CY2011
CY2012
CY2013E
CY2014E
SOURCES OF FUNDS
Equity Share Capital
18
18
18
18
18
Preference Capital
-
-
-
-
-
Reserves& Surplus
317
362
416
475
544
Shareholders’ Funds
334
380
434
493
562
Minority Interest
-
-
-
-
-
Total Loans
-
131
67
67
67
Deferred Tax Liability (Net)
21
18
17
17
17
Other long term liabilities
-
0
0
0
0
Long term provisions
-
15
15
15
15
Total Liabilities
356
544
533
592
661
APPLICATION OF FUNDS
Gross Block
318
335
362
372
384
Less: Acc. Depreciation
181
195
209
224
240
Net Block
136
140
153
148
144
Capital Work-in-Progress
12
-
-
-
-
Lease adjustment
-
-
-
-
-
Goodwill
-
-
-
-
-
Investments
93
101
17
21
25
Long Term Loans and advances
-
35
28
43
49
Other non-current assets
-
0
0
0
0
Current Assets
281
318
439
492
572
Cash
60
63
31
57
87
Loans & Advances
41
35
136
147
169
Inventory
71
95
95
98
100
Debtor
109
124
175
189
216
Other current assets
-
1
1
1
1
Current liabilities
166
51
104
112
128
Net Current Assets
115
268
335
380
444
Mis. Exp. not written off
-
-
-
-
-
Total Assets
356
544
533
592
661
May 20, 2013
6
Styrolution ABS | OFS note
Cash Flow (Standalone)
Y/E December (` cr)
CY2010
CY2011
CY2012
CY2013E
CY2014E
Profit Before Tax
103
78
92
99
115
Depreciation
14
14
14
16
16
Change in WC
16
(330)
(99)
(20)
(34)
Other income
(5)
(11)
(11)
(12)
(13)
Direct taxes paid
(33)
(24)
(30)
(32)
(37)
Cash Flow from Operations
95
(273)
(34)
51
46
(Incr)/ Decr in Fixed Assets
(8)
(5)
(27)
(11)
(11)
(Incr)/Decr In Investments
(21)
(43)
91
(18)
(10)
Other income
5
11
11
12
13
Cash Flow from Investing
(24)
(37)
75
(17)
(8)
Issue of Equity/Preference
-
0
-
-
-
Incr/(Decr) in Debt
(2)
142
(65)
-
-
Dividend Paid (Incl. Tax)
(7)
(7)
(8)
(8)
(8)
Others
(39)
179
-
-
-
Cash Flow from Financing
(48)
314
(73)
(8)
(8)
Incr/(Decr) In B/S Cash
22
4
(32)
25
30
Opening Cash balance
37
60
63
31
57
Closing cash balance
60
63
31
57
87
May 20, 2013
7
Styrolution ABS | OFS note
Key Ratios (Standalone)
Y/E December
CY2010
CY2011
CY2012
CY2013E
CY2014E
Valuation Ratio (x)
P/E (on FDEPS)
13.1
17.0
14.8
13.7
11.8
P/CEPS
10.9
13.5
12.1
11.1
9.8
P/BV
2.7
2.4
2.1
1.9
1.6
Dividend yield (%)
0.8
0.8
0.9
0.9
0.9
EV/Net sales
1.0
1.1
0.9
0.8
0.7
EV/EBITDA
6.8
10.8
9.8
8.8
7.4
EV / Total Assets
2.1
1.6
1.8
1.5
1.3
Per Share Data (`)
EPS (Basic)
40
31
35
38
44
EPS (fully diluted)
40
31
35
38
44
Cash EPS
48
39
43
47
53
DPS
4
4
4
4
4
Book Value
190
216
247
280
320
DuPont Analysis
EBIT margin
13.3
8.2
8.3
8.2
8.3
Tax retention ratio
0.7
0.7
0.7
0.7
0.7
Asset turnover (x)
3.8
2.2
2.0
2.1
2.2
ROIC (Post-tax)
34.6
12.5
11.4
11.5
12.5
Cost of Debt (Post Tax)
-
-
-
-
-
Leverage (x)
(0.5)
(0.1)
0.0
(0.0)
(0.1)
Operating ROE
18.8
11.4
11.9
11.2
11.5
Returns (%)
ROCE (Pre-tax)
27.5
12.5
15.3
14.8
15.4
Angel ROIC (Pre-tax)
50.7
17.9
16.9
17.0
18.5
ROE
23.1
15.1
15.2
14.4
14.7
Turnover ratios (x)
Asset TO (Gross Block)
2.3
2.5
2.7
2.9
3.2
Inventory / Net sales (days)
35
36
36
36
36
Receivables (days)
54
54
54
54
54
Payables (days)
96
92
96
95
94
WC cycle (ex-cash) (days)
27
90
112
110
107
Solvency ratios (x)
Net debt to equity
(0.5)
(0.1)
0.0
(0.0)
(0.1)
Net debt to EBITDA
(1.3)
(0.4)
0.2
(0.1)
(0.4)
Int. Coverage (EBIT/ Int.)
55.0
42.1
102.0
-
-
May 20, 2013
8
Styrolution ABS | OFS note
Research Team Tel: 022 - 39357800
DISCLAIMER
This document is solely for the personal information of the recipient, and must not be singularly used as the basis of any investment
decision. Nothing in this document should be construed as investment or financial advice. Each recipient of this document should make
such investigations as they deem necessary to arrive at an independent evaluation of an investment in the securities of the companies
referred to in this document (including the merits and risks involved), and should consult their own advisors to determine the merits and
risks of such an investment.
Angel Broking Limited, its affiliates, directors, its proprietary trading and investment businesses may, from time to time, make
investment decisions that are inconsistent with or contradictory to the recommendations expressed herein. The views contained in this
document are those of the analyst, and the company may or may not subscribe to all the views expressed within.
Reports based on technical and derivative analysis center on studying charts of a stock's price movement, outstanding positions and
trading volume, as opposed to focusing on a company's fundamentals and, as such, may not match with a report on a company's
fundamentals.
The information in this document has been printed on the basis of publicly available information, internal data and other reliable
sources believed to be true, but we do not represent that it is accurate or complete and it should not be relied on as such, as this
document is for general guidance only. Angel Broking Limited or any of its affiliates/ group companies shall not be in any way
responsible for any loss or damage that may arise to any person from any inadvertent error in the information contained in this report.
Angel Broking Limited has not independently verified all the information contained within this document. Accordingly, we cannot testify,
nor make any representation or warranty, express or implied, to the accuracy, contents or data contained within this document. While
Angel Broking Limited endeavours to update on a reasonable basis the information discussed in this material, there may be regulatory,
compliance, or other reasons that prevent us from doing so.
This document is being supplied to you solely for your information, and its contents, information or data may not be reproduced,
redistributed or passed on, directly or indirectly.
Angel Broking Limited and its affiliates may seek to provide or have engaged in providing corporate finance, investment banking or
other advisory services in a merger or specific transaction to the companies referred to in this report, as on the date of this report or in
the past.
Neither Angel Broking Limited, nor its directors, employees or affiliates shall be liable for any loss or damage that may arise from or in
connection with the use of this information.
Note: Please refer to the important `Stock Holding Disclosure' report on the Angel website (Research Section). Also, please refer to the
latest update on respective stocks for the disclosure status in respect of those stocks. Angel Broking Limited and its affiliates may have
investment positions in the stocks recommended in this report.
Disclosure of Interest Statement
Styrolution
1. Analyst ownership of the stock
No
2. Angel and its Group companies ownership of the stock
No
3. Angel and its Group companies' Directors ownership of the stock
No
4. Broking relationship with company covered
No
Note: We have not considered any Exposure below ` 1 lakh for Angel, its Group companies and Directors
Ratings (Returns):
Buy (> 15%)
Accumulate (5% to 15%)
Neutral (-5 to 5%)
Reduce (-5% to -15%)
Sell (< -15%)
May 20, 2013
9
Styrolution ABS | OFS note
6th Floor, Ackruti Star, Central Road, MIDC, Andheri (E), Mumbai- 400 093. Tel: (022) 39357800
Research Team
Fundamental:
Sarabjit Kour Nangra
VP-Research, Pharmaceutical
Vaibhav Agrawal
VP-Research, Banking
Bhavesh Chauhan
Sr. Analyst (Metals & Mining)
Viral Shah
Sr. Analyst (Infrastructure)
Sharan Lillaney
Analyst (Mid-cap)
V Srinivasan
Analyst (Cement, FMCG)
Yaresh Kothari
Analyst (Automobile)
Ankita Somani
Analyst (IT, Telecom)
Sourabh Taparia
Analyst (Banking)
Bhupali Gursale
Economist
Vinay Rachh
Research Associate
Amit Patil
Research Associate
Shareen Batatawala
Research Associate
Twinkle Gosar
Research Associate
Tejashwini Kumari
Research Associate
Akshay Narang
Research Associate
Harshal Patkar
Research Associate
Technicals:
Shardul Kulkarni
Sr. Technical Analyst
Sameet Chavan
Technical Analyst
Sacchitanand Uttekar
Technical Analyst
Derivatives:
Siddarth Bhamre
Head - Derivatives
Institutional Sales Team:
Mayuresh Joshi
VP - Institutional Sales
Hiten Sampat
Sr. A.V.P- Institution sales
Meenakshi Chavan
Dealer
Gaurang Tisani
Dealer
Akshay Shah
Sr. Executive
Production Team:
Tejas Vahalia
Research Editor
Dilip Patel
Production Incharge
CSO & Registered Office: G-1, Ackruti Trade Centre, Road No. 7, MIDC, Andheri (E), Mumbai - 93. Tel: (022) 3083 7700. Angel Broking Pvt. Ltd: BSE Cash: INB010996539 / BSE F&O: INF010996539, CDSL Regn. No.: IN - DP - CDSL - 234 - 2004, PMS Regn. Code: PM/INP000001546, NSE Cash: INB231279838 /
NSE F&O: INF231279838 / NSE Currency: INE231279838, MCX Stock Exchange Ltd: INE261279838 / Member ID: 10500. Angel Commodities Broking (P) Ltd.: MCX Member ID: 12685 / FMC Regn. No.: MCX / TCM / CORP / 0037 NCDEX: Member ID 00220 / FMC Regn. No.: NCDEX / TCM / CORP / 0302.
May 20, 2013
10