Initiating Coverage | Auto Ancillary
September 12, 2014
Sterling Tools
BUY
CMP
`332
STL to ride on auto industry recovery
Target Price
`397
Investment Arguments
Investment Period
12 Months
Recovery in Automobile industry would benefit Sterling Tools (STL): The
Stock Info
automobile industry’s performance in the past two consecutive years (FY2013 and
Sector
Auto Ancillary
FY2014) was disappointing. But In YTD FY2015 (April to August), the 2W industry
Market Cap (` cr)
231
has reported a strong growth of ~17% due to recovery in domestic and export
Net Debt (` cr)
54
markets and PVs have also shown an ~4% yoy growth. However, the commercial
Beta
0.6
vehicle (CV) segment is still under pressure due to poor performance of light
52 Week High / Low
341 / 93
commercial vehicles (LCVs), although early signs of recovery are now visible
Avg. Daily Volume
3,117
(since June 2014). Considering overall sales volumes in the past five months, we
Face Value (`)
10
expect growth momentum to continue and expect the Indian automobile industry
BSE Sensex
26,996
to report a healthy ~14% CAGR over FY2014-16E which would benefit auto
Nifty
8,086
ancillary companies like Sterling Tools (STL).
Reuters Code
STTL.BO
Strong customer base would provide revenue visibility for STL: OEMs are a major
Bloomberg Code
STRT@IN
contributor to STL’s revenues
(~81%). STL is among the top
3 fastener
manufacturers in India, supplying to major OEMs like Honda (STL is the largest
Shareholding Pattern (%)
supplier of HT fasteners to the company), Maruti Suzuki India and Tata Motors
(STL is the second-largest supplier of fasteners to the two companies). STL’s other
Promoters
70.2
blue chip customers include Ashok Leyland, Daimler, Fiat, Hero Motocorp,
MF / Banks / Indian Fls
0.3
Mahindra & Mahindra, Volvo, Eicher, TAFE and General Motors. This gives the
FII / NRIs / OCBs
0.0
company a diversified customer base and positions it for strong growth, driven by
Indian Public / Others
29.5
the sharp uptick in volume growth across a range of segments in the industry.
Abs. (%)
3m 1yr
3yr
Outlook and Valuation: We forecast STL to report a Net Sales CAGR of ~14%
Sensex
6.0
35.0
60.1
over FY2014-16E to ~`394cr and net profit CAGR of ~20% during the same
STL
68.1
242.3
204.6
period to `23cr. At the current market price of `332, the stock trades at a PE of
12.1x and 10.0x its FY2015E and FY2016E EPS of `27.4 and `33.1, respectively.
We initiate coverage on the stock with a Buy recommendation and target price of
`397, based on 12x FY2016E EPS, indicating an upside of ~20% from the
current levels.
Key financials
Y/E March (` cr)
FY2013
FY2014
FY2015E
FY2016E
Net sales
283
301
342
394
% chg
(4.2)
6.7
13.4
15.4
Net profit
11
16
19
23
% chg
(26.3)
43.6
19.8
20.8
EBITDA margin (%)
12.4
13.9
13.9
13.9
EPS (`)
15.9
22.8
27.4
33.1
P/E (x)
20.8
14.5
12.1
10.0
P/BV (x)
2.5
2.3
2.0
1.7
RoE (%)
12.2
15.5
16.2
16.7
RoCE (%)
15.4
19.5
20.6
21.8
Amarjeet S Maurya
EV/Sales (x)
1.1
0.9
0.8
0.7
022-39357800 Ext: 6831
EV/EBITDA (x)
8.6
6.7
5.8
5.0
Source: Company, Angel Research, Note: CMP as of September 11, 2014
Please refer to important disclosures at the end of this report
1
Sterling Tools | Initiating Coverage
Investment Arguments
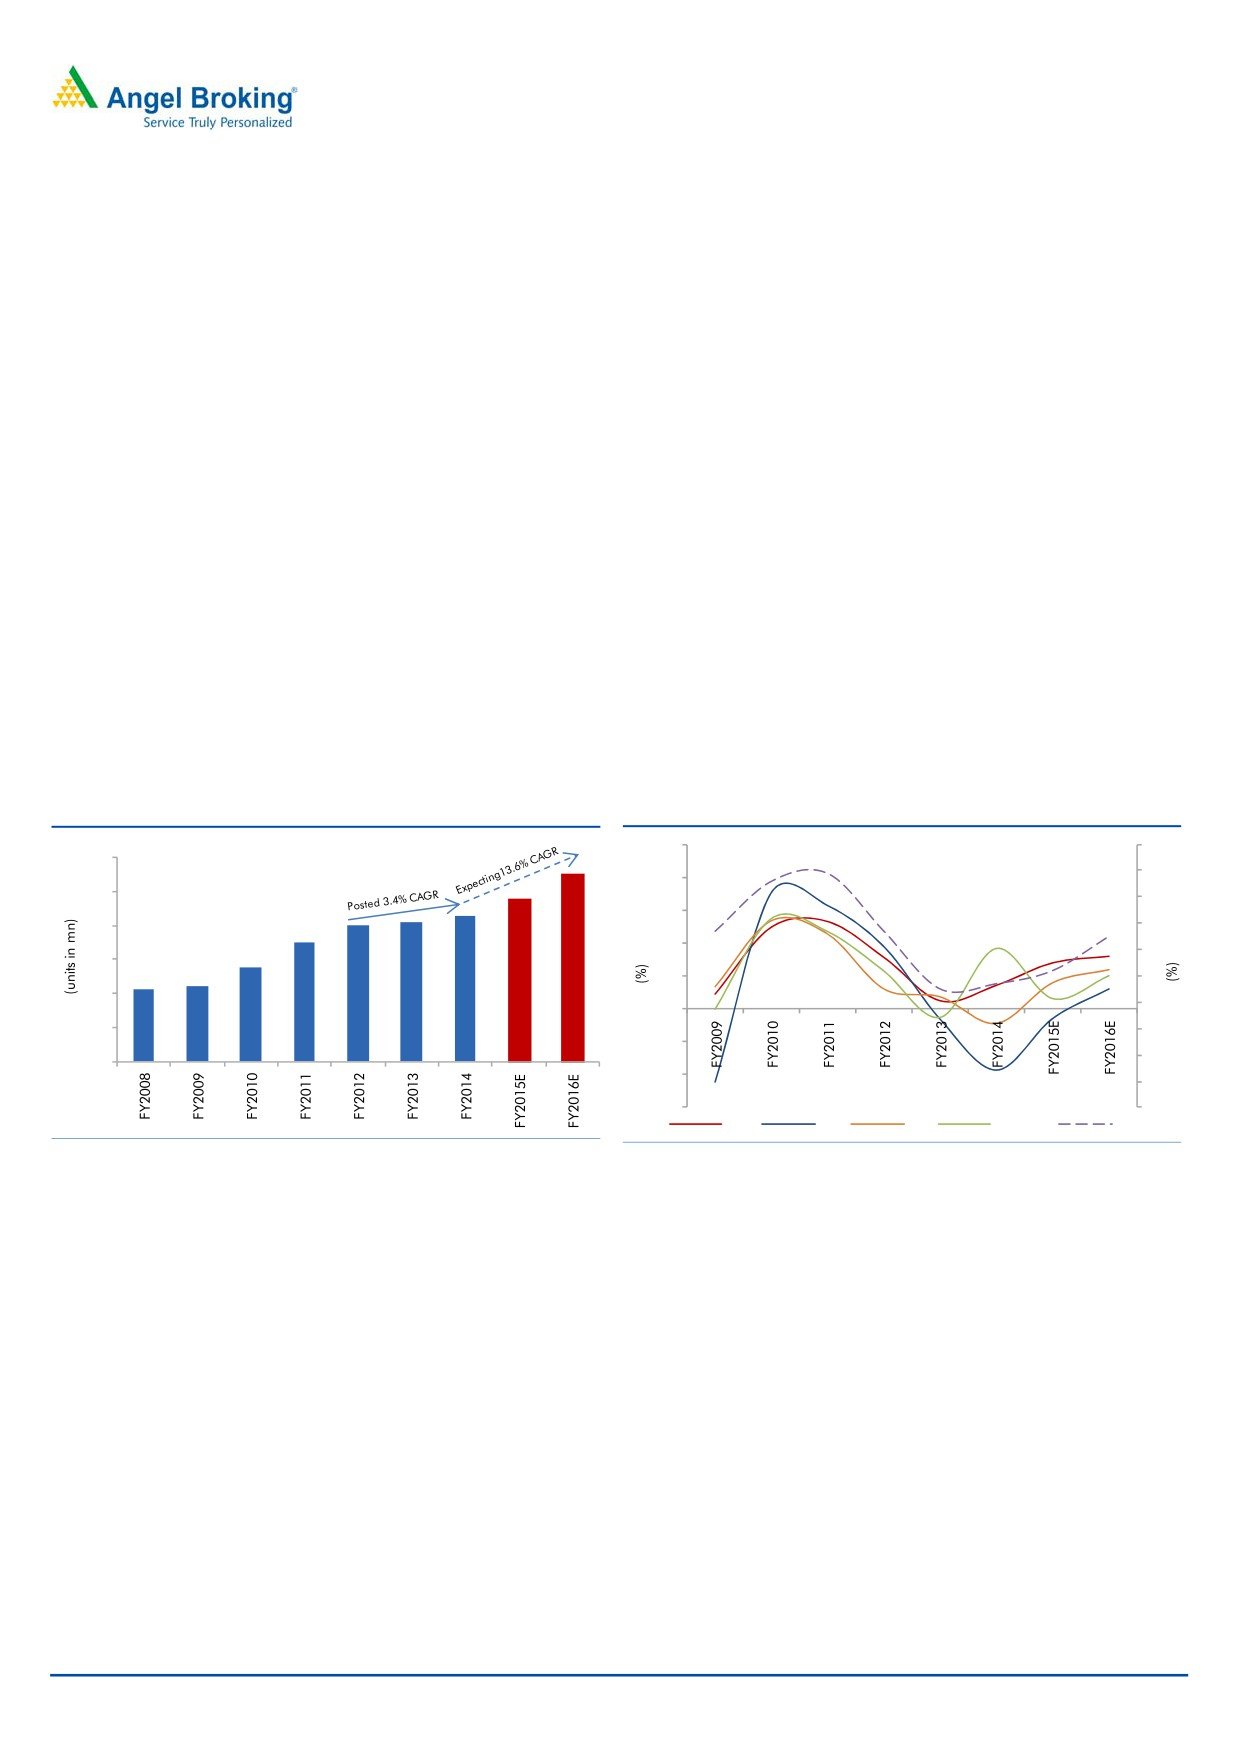
Recovery in Automobile industry would benefit STL
India has been amongst the fastest growing automobile markets in the world in the
last five years. For FY2014, automobile volumes (2W, commercial vehicles [CVs],
passenger vehicles [PVs] and tractors), domestic and exports, stood at ~21.4
During YTD FY2015 (April to August),
million units (a 4.6% yoy growth). The industry has recovered from a subdued
the 2W industry has reported a strong
volume growth in FY2013, which was owing to a slowdown in the domestic
growth of ~17% due to strong recovery
in domestic and export markets
economy, higher inflation and increase in fuel prices. Further, overall automobile
export numbers were also subdued. However, in FY2014, the Indian automobile
industry showed some recovery in domestic and export sales volumes, mainly
driven by the 2W segment.
During YTD FY2015 (April to August), the 2W industry has reported a strong
growth of ~17% (vs 7.2% yoy growth in FY2014). PVs have also shown an ~4%
yoy growth (vs a degrowth of 4.4% in FY2014) due to recovery in domestic and
export markets. However, the CV segment is still under pressure due to poor
performance of LCVs. Nonetheless, the MHCV segment has also started showing
recovery (from June 2014) and going forward we expect CV volumes to be driven
by improvement in the Indian economy.
Exhibit 1: Automobile Industry trend
Exhibit 2: GDP & Automobile Industry growth projection
50
10
30
9
40
25
8
30
20
7
20
6
15
10
5
10
4
0
5
3
(10)
2
0
(20)
1
(30)
0
2W
CV
PV
Tractors
GDP
Source: SIAM, Angel Research,
Source: SIAM, Angel Research
# Includes data of Two Wheelers, Commercial Vehicle, Passenger Vehicle and Tractors
Considering the overall improvement in demand in the domestic and export
markets with Indian automobile OEMs expanding presence in new geographical
We expect the Indian automobile
regions in the last three quarters, we expect the Indian automobile industry to
industry to report a healthy
~14%
report a healthy ~14% CAGR over FY2014-16E. Also, with the formation of the
CAGR over FY2014-16E
new government at the centre, we expect inflationary pressures to subside, thus
leading to lower interest rates.
September 12, 2014
2
Sterling Tools | Initiating Coverage
This coupled with the anticipation of an increase in personal disposable incomes
due to recovery in the domestic economy would create a positive sentiment for
Indian consumers, and in turn lead to an improvement in 2W and PV volumes.
Further, we expect improvement in GDP growth (in 1QFY2015 India’s GDP growth
was 5.7%, which is the highest in the last nine quarters) in FY2015 and FY2016;
this would assist growth in the CV segment, mainly in the LCV segment, which is
currently underperforming.
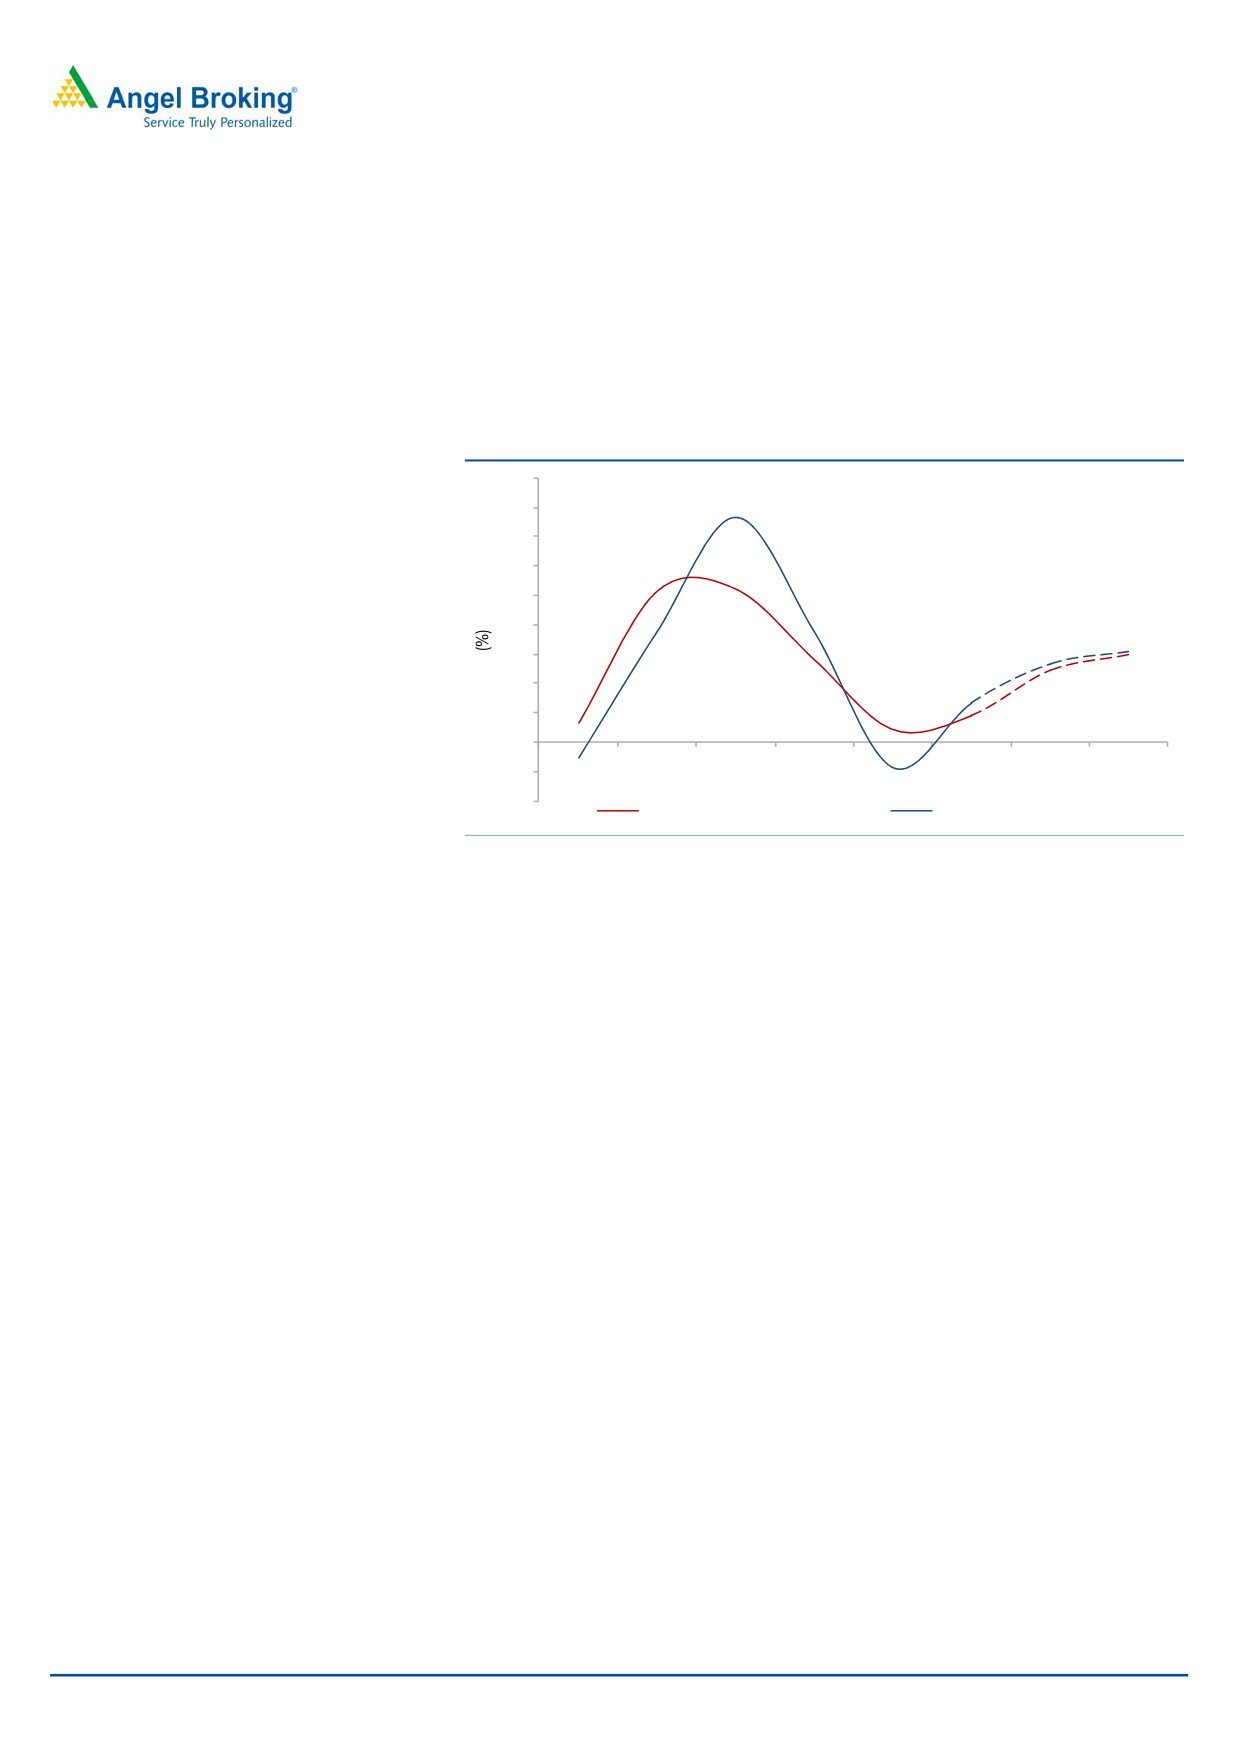
Exhibit 3: Correlation bet. Automobile vol. and STL’s vol. performance
45
40
35
30
25
20
15
10
5
0
FY2009
FY2010
FY2011
FY2012
FY2013
FY2014 FY2015E FY2016E
(5)
(10)
Automobile Industry Volumes
Sterling Tools Volumes
Source: Company, Angel Research
STL caters to all segments of the automobile industry. 2Ws and CVs account for the
2Ws and CVs account for the largest
largest chunk of its sales (21% each), followed by PVs at 11%, farm equipment
chunk of STL’s sales
(21% each),
(tractors) at 10%, replacement at 10% while export account for 9% of total sales.
followed by PVs at
11%, farm
Thus, we believe that STL is best placed to take advantage of an expected recovery
equipment
(tractors)
at
10%,
in the automobile industry.
replacement segment at
10%, while
Moreover, over the last six years, we have witnessed a strong correlation between
exports account for 9% of total sales.
volume growth in the automobile industry and volume growth of STL. We expect
this trend to continue going forward. Thus, in our view, STL would benefit from a
recovery in the automobile industry going forward.
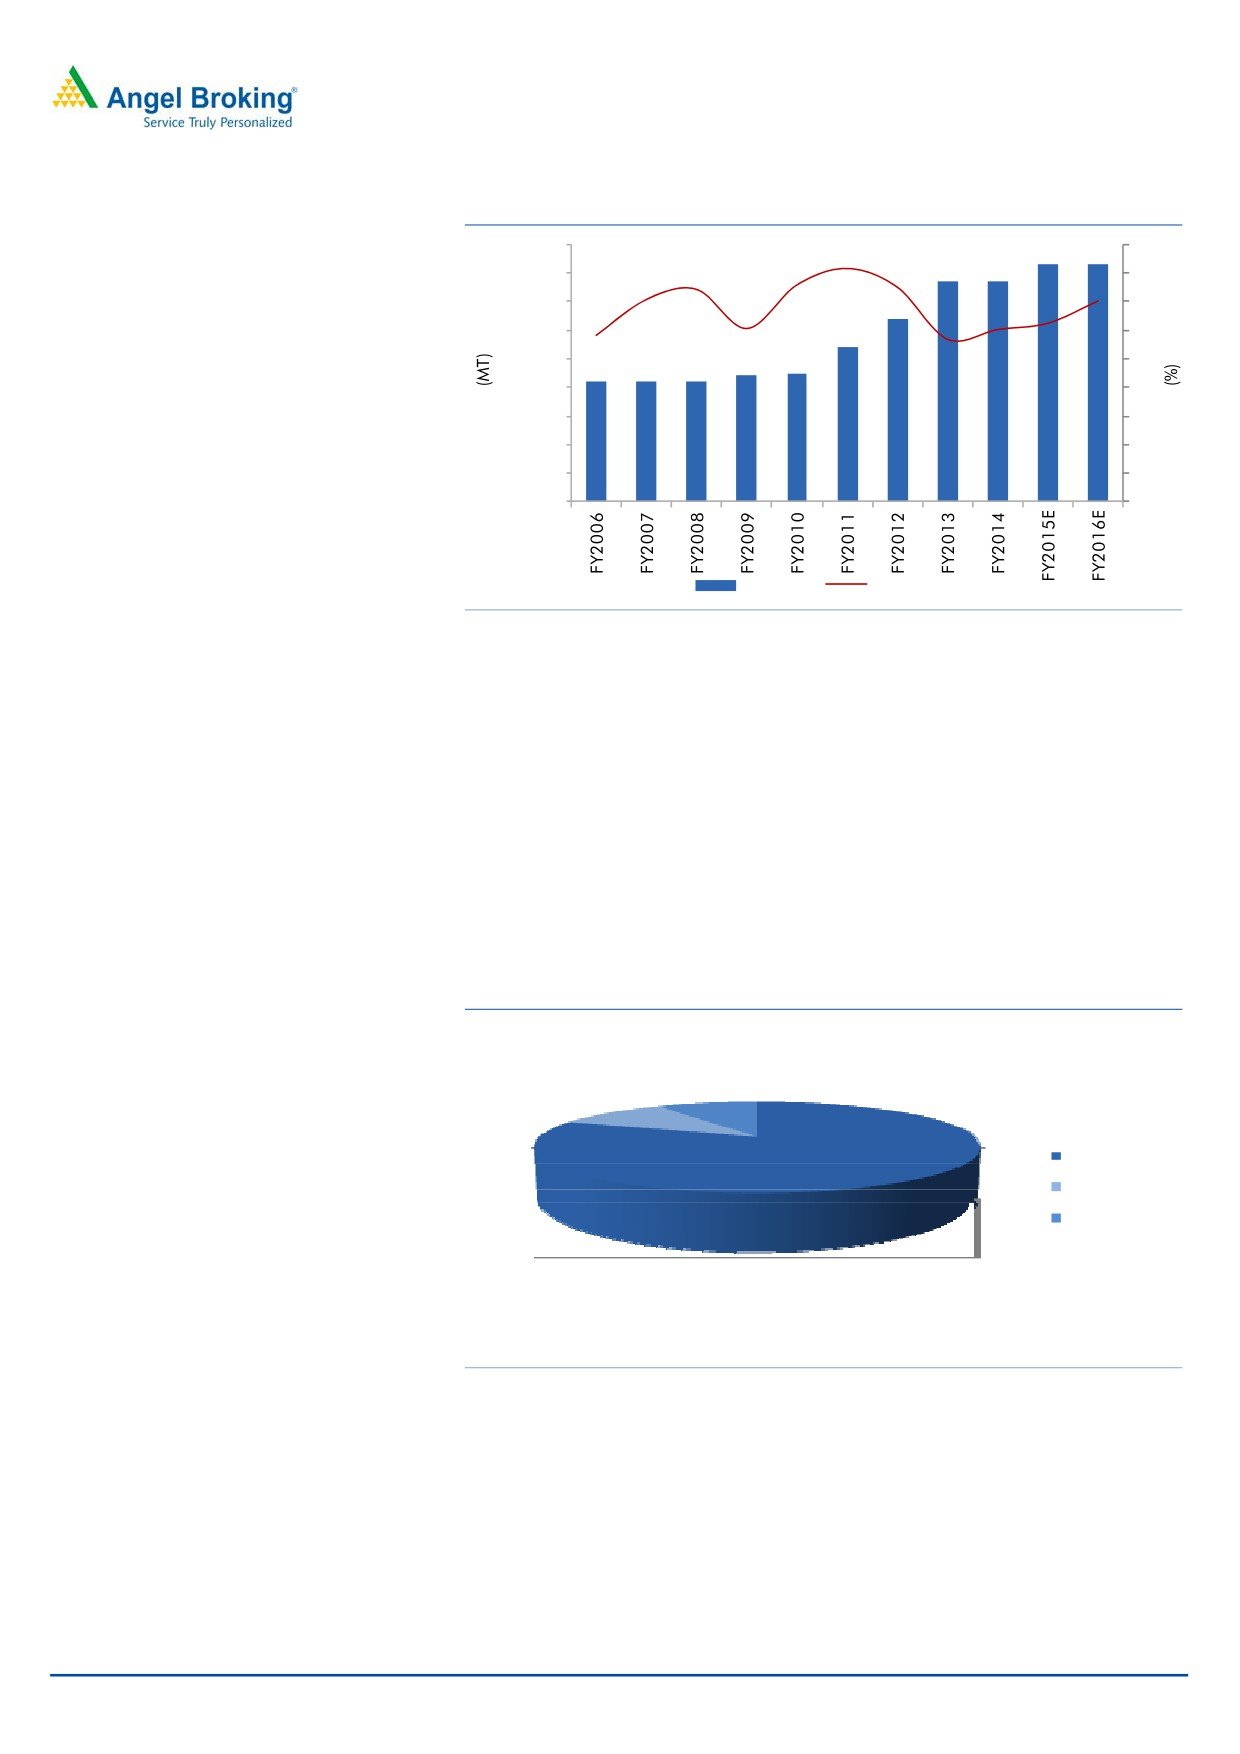
Consistent capacity expansion will trigger top-line growth
STL has undertaken several expansions in the past 8-9 years. Since FY2006, it has
almost doubled its capacity from 21,000 MTPA to 41,600 MTPA (the company has
undergone several periodical upgradations and modernization). Recently the
company has increased its manufacturing capacity in the Fasteners segment from
38,400 MT per annum to 41,600 MT per annum (by the end of FY2014) to cater
Since FY2006, STL has almost doubled
to the increasing demand from the automobile industry. Automobile industry sales
its capacity from
21,000 MTPA to
volumes have started improving owing to improvement in the demand scenario.
41,600 MTPA
Also, the OEMs are increasing their capacity and geographical reach. The
enhancement in capacity by STL will enable it to service the increase in demand.
September 12, 2014
3
Sterling Tools | Initiating Coverage
Exhibit 4: Installed Capacity & Utilised Capacity trend
45,000
90
40,000
80
35,000
70
30,000
60
25,000
50
20,000
40
15,000
30
10,000
20
5,000
10
0
0
Capacity
Utilisation (%)
Source: Company, Angel Research
Strong customer base would provide revenue visibility for STL
OEMs are a major contributor to STL’s revenues (~81%). STL is among the top 3
fastener manufacturers in India, supplying to major OEMs like Honda (STL is the
largest supplier of HT fasteners to the company), Maruti Suzuki India and Tata
Motors (STL is the second-largest supplier of fasteners to the two companies). STL’s
The company’s key clients are Honda
other blue chip customers include Ashok Leyland, Daimler, Fiat, Hero Motocorp,
Motorcycle & Scooters India, Maruti
Mahindra & Mahindra, Volvo, Eicher, TAFE and General Motors. This gives the
Suzuki India and Tata Motors
company a diversified customer base and positions it for strong growth, driven by
the sharp uptick in volume growth across a range of segments in the industry.
Exhibit 5: Break-up of Revenue mix
9%
10%
OEMs
Replacement
Exports
81%
Source: Company, Angel Research
September 12, 2014
4
Sterling Tools | Initiating Coverage
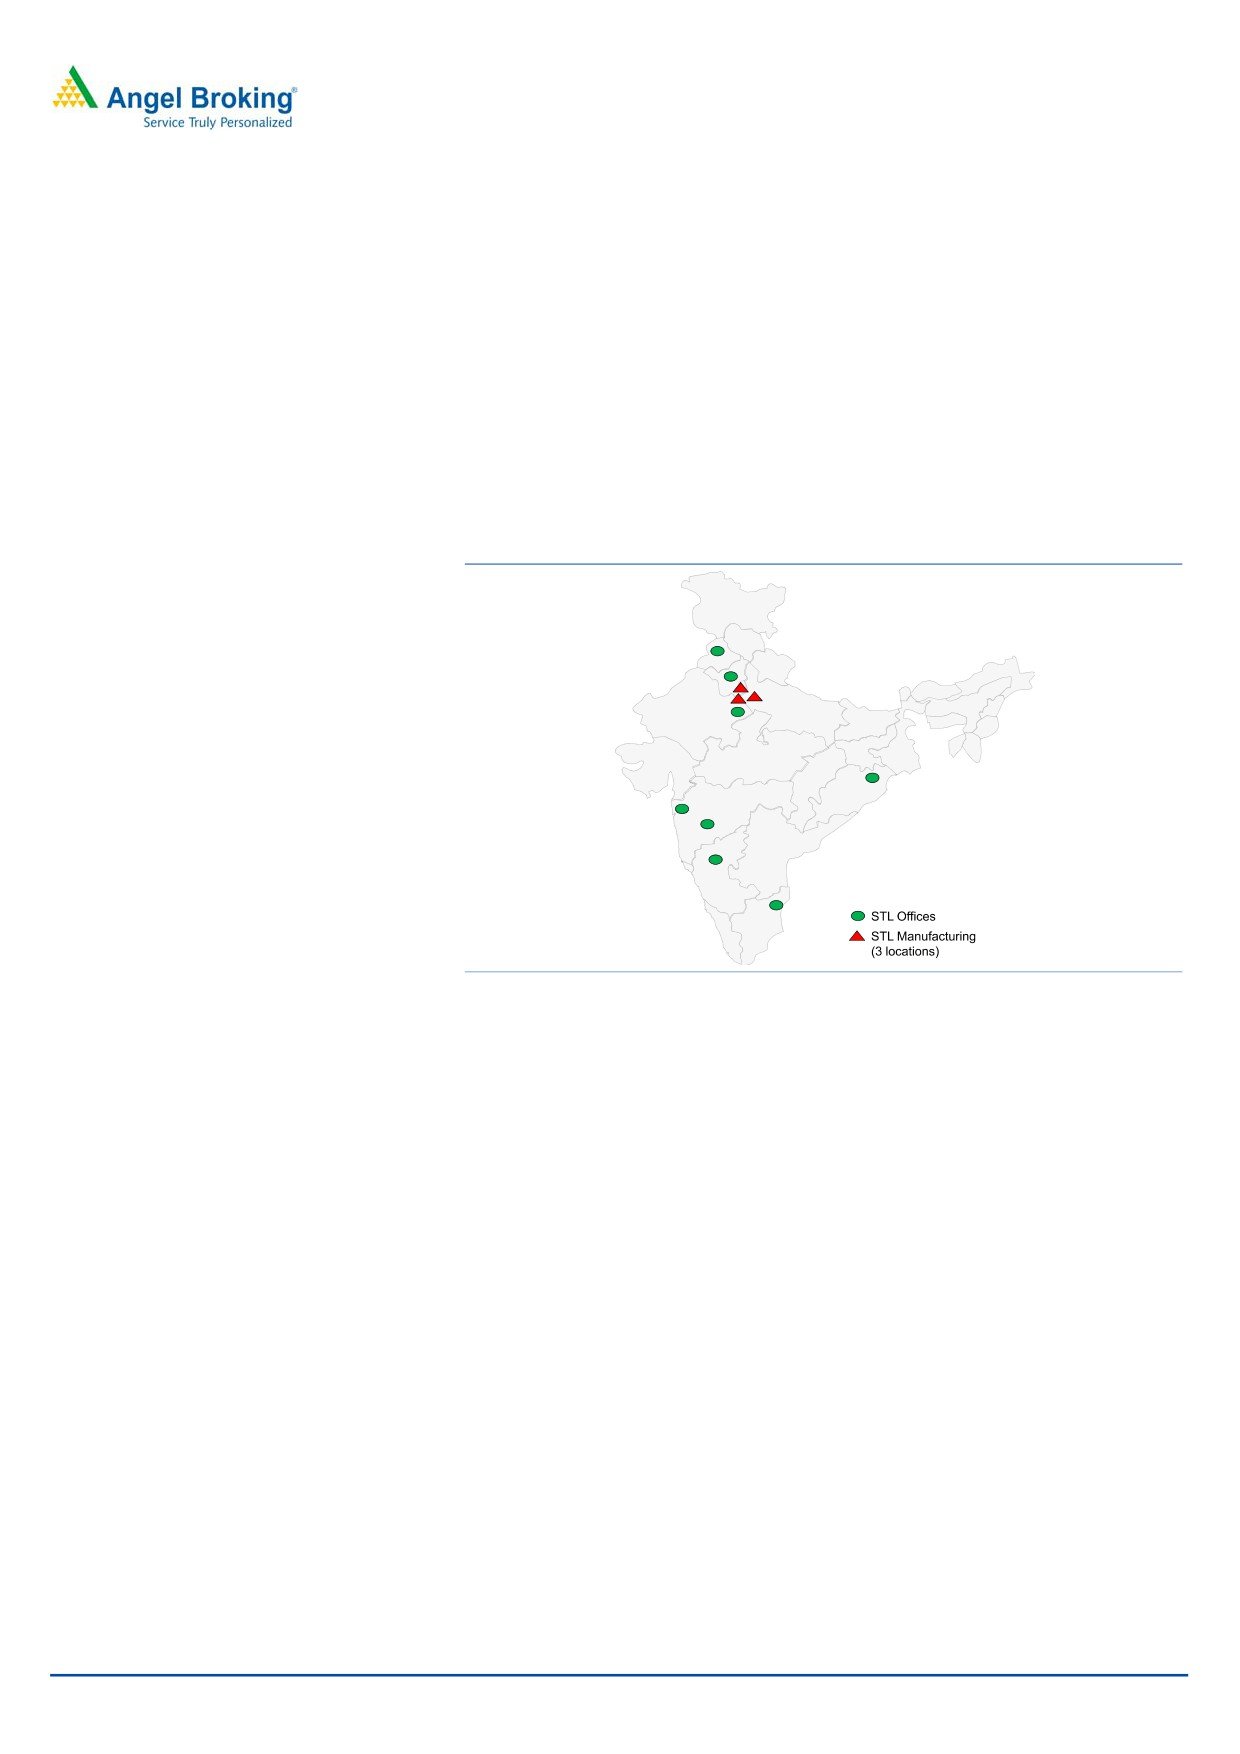
Focus on expansion of distribution network
To push replacement market sales, the company is continuously focusing on
increasing dealerships for its products. Currently, the company has more than 60
dealers and the number is growing rapidly. With regional offices in both Chennai
and Pune and residential representatives in places such as Jamshedpur, Mumbai
Currently, the company has more than
and many more cities, STL has been able to interact closely with automobile
60 dealers and the number is growing
dealers, fleet owners and mechanics. This has helped it to gain a better
rapidly
understanding of their needs and enabled it to serve them better. By further
strengthening foothold in this segment, the company intends to make its presence
felt in every part of the country.
Exhibit 6: Domestic Network of STL
Source: Company, Angel Research
September 12, 2014
5
Sterling Tools | Initiating Coverage
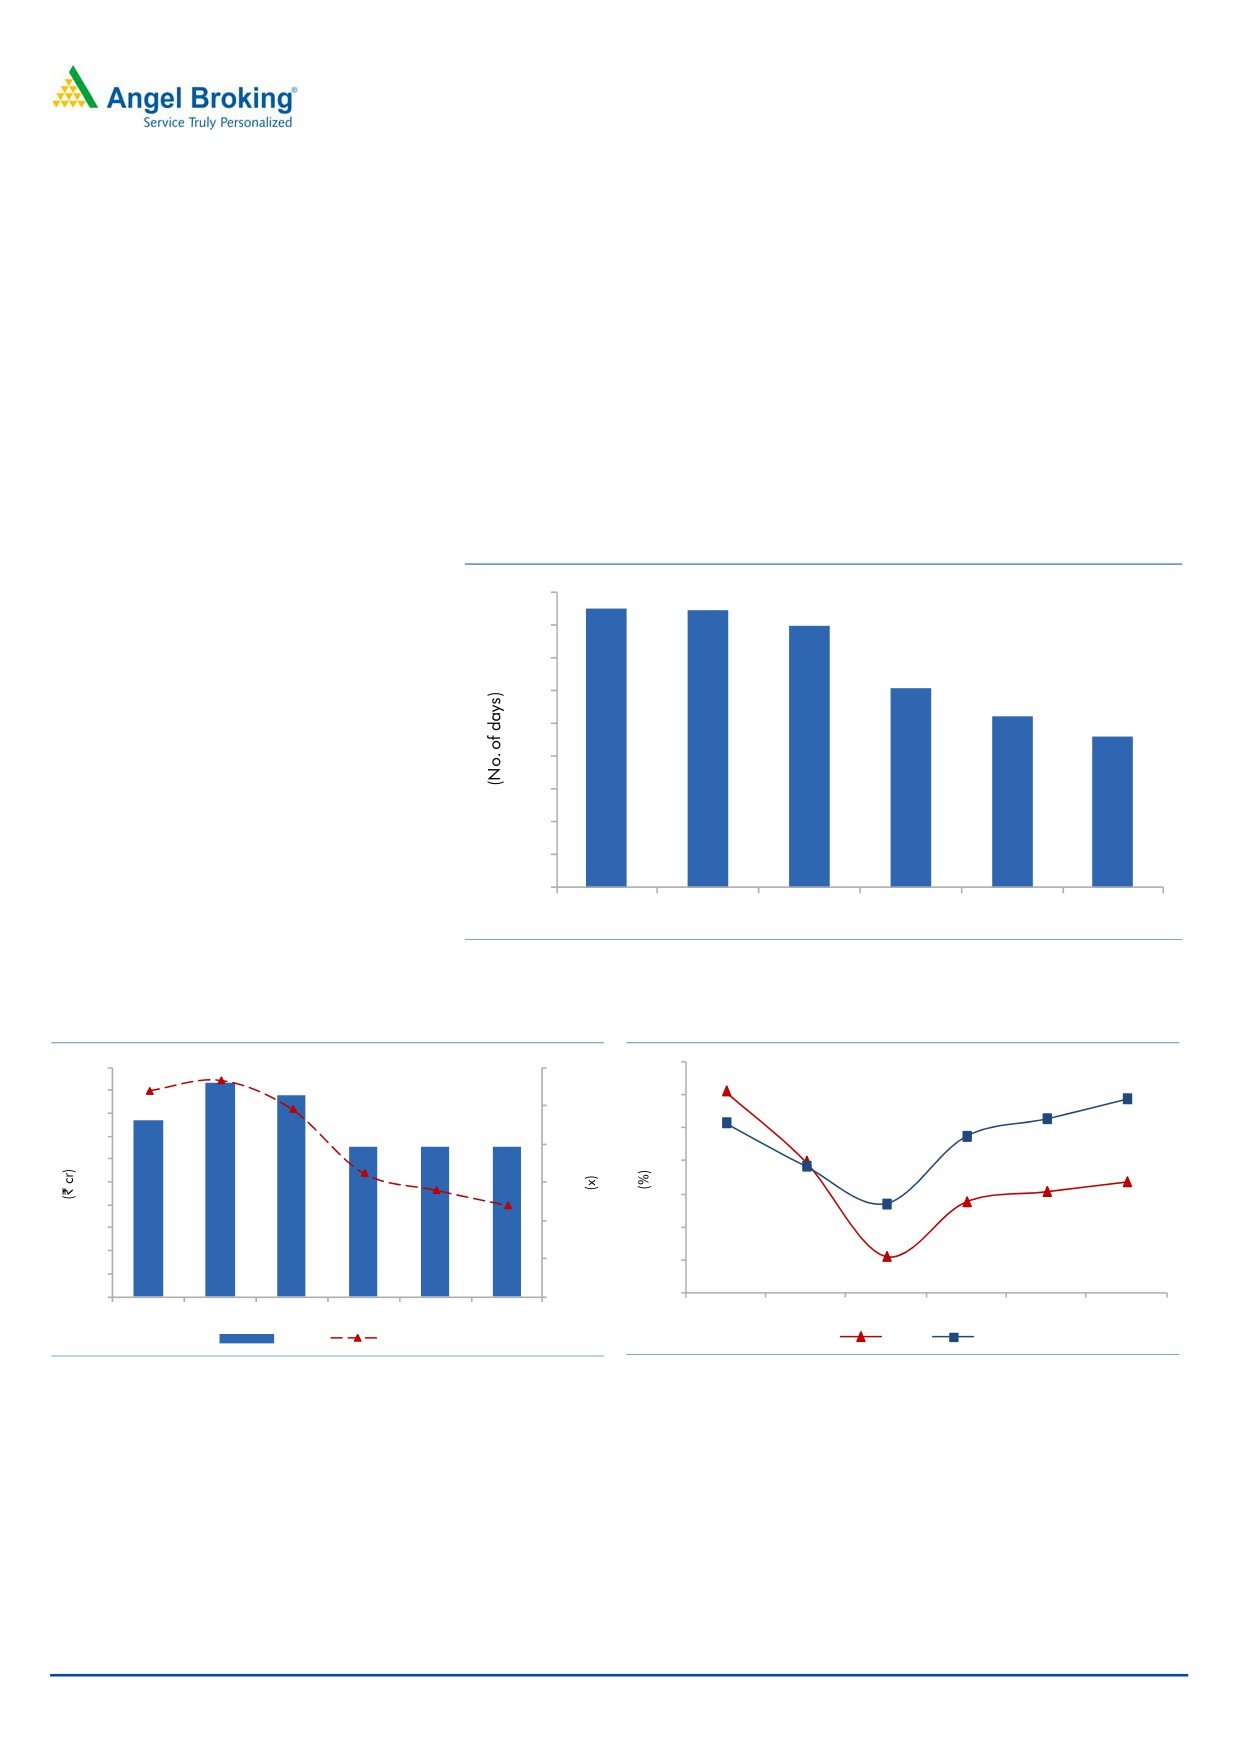
Healthy return ratios, lower D/E and better working capital
The company’s working capital cycle
We expect the company to report improvement in its ROE and ROCE on the back
has reduced from 85 days in FY2011 to
of healthy profitability with strong sales, healthy operating margin due to better
61 days in FY2014
product mix, higher capacity utilization. A decline in interest expenses would also
aid profitability. Further, the company’s working capital cycle has reduced from 85
days in FY2011 to 61 days in FY2014. We expect it to come down further, ie in the
range of 45-50days, owing to improvement in inventory days and receivable days.
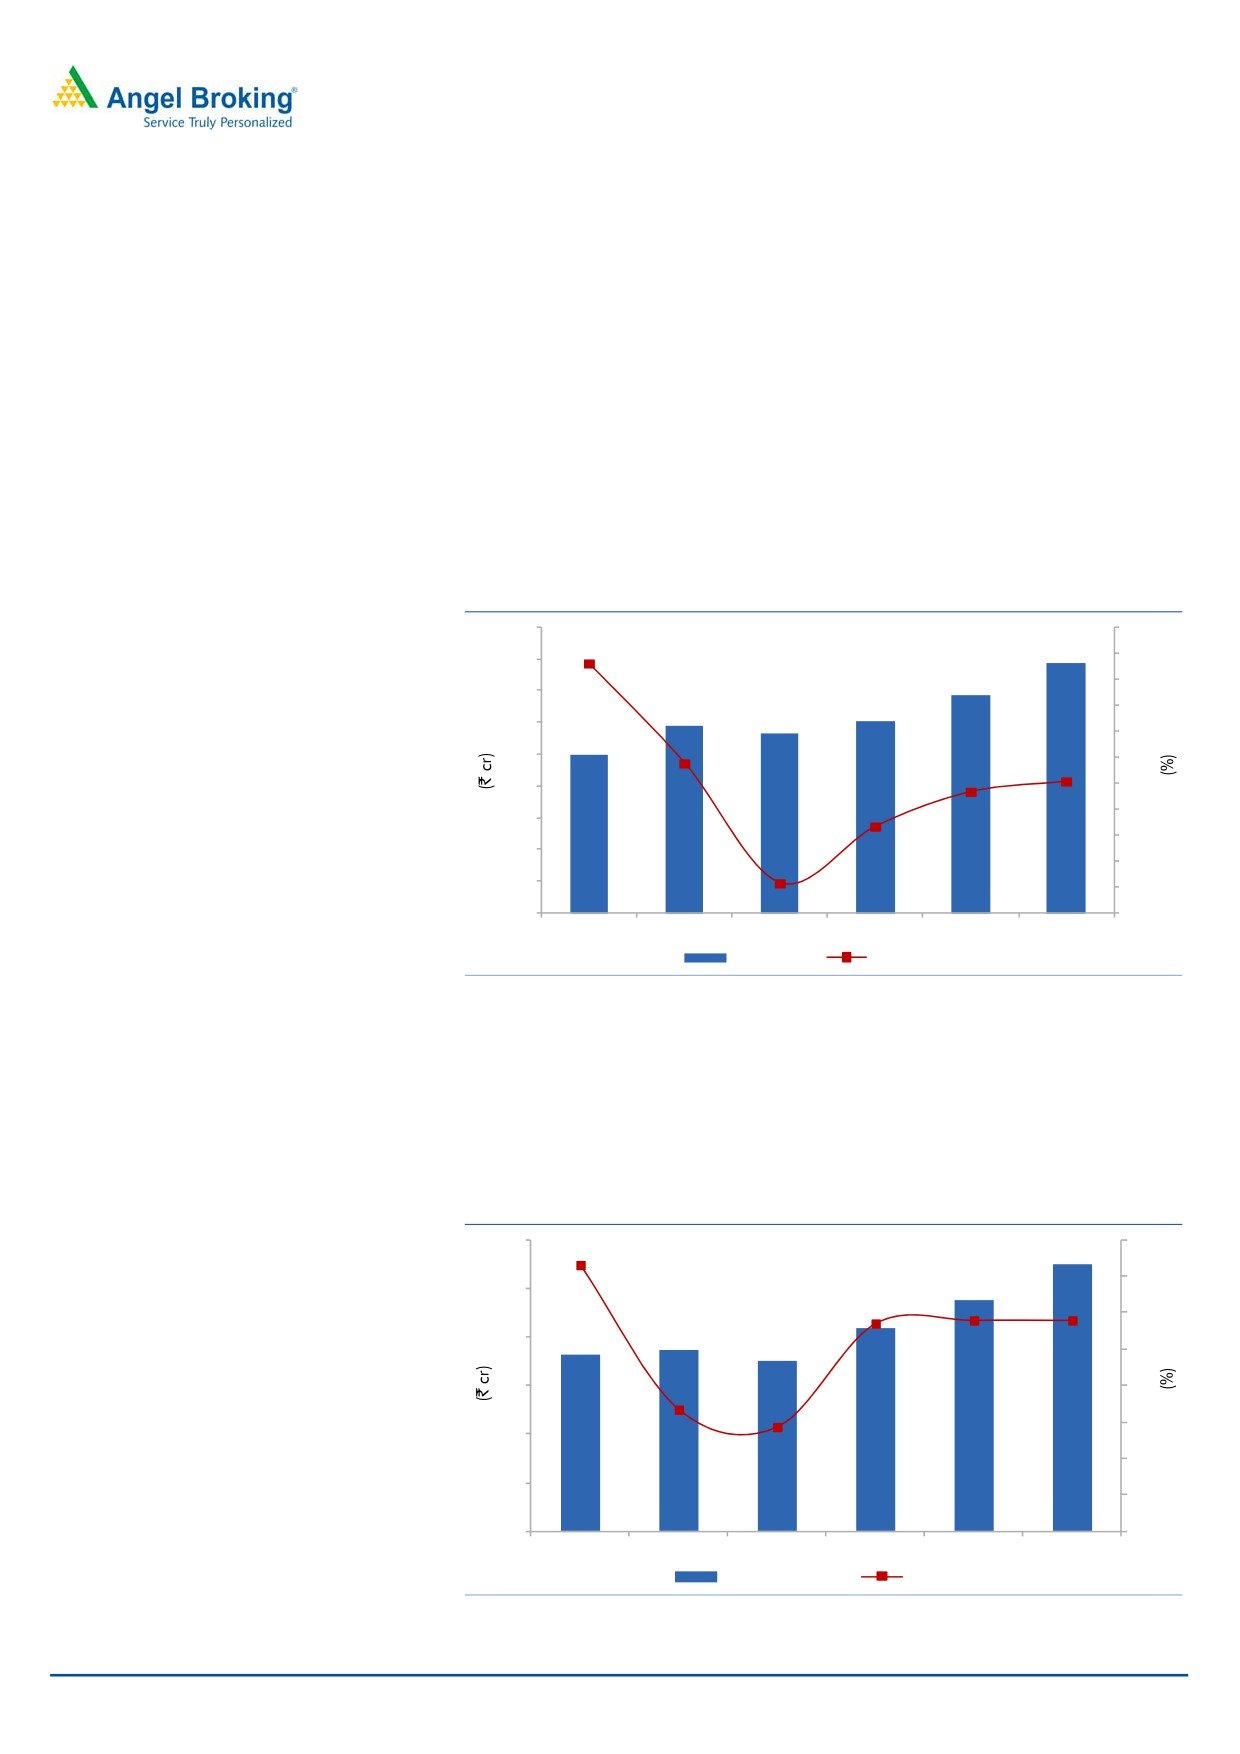
Moreover, the company’s debt has reduced from `93cr in FY2012 to `65cr in
FY2014 and we do not expect any significant debt raising by the company due to
absence of any major capex plans in the near term.
Exhibit 7: Decreasing working capital days
90
85
84
80
80
70
61
60
52
50
46
40
30
20
10
0
FY2011
FY2012
FY2013
FY2014
FY2015E FY2016E
Source: Company, Angel Research
Exhibit 8: Decreasing Debt/Equity ratio
Exhibit 9: Improvement in ROE and ROCE ratios
1.1
24
100
1.1
1.2
21.8
90
1.0
20.3
22
20.6
1.0
80
19.5
20
70
22.2
0.8
17.7
60
0.7
18
0.6
50
0.5
0.6
18.0
15.4
16
40
16.7
16.2
0.4
15.5
14
30
20
0.2
12
10
12.2
77
93
88
65
65
65
0
0.0
10
FY2011
FY2012
FY2013
FY2014
FY2015E FY2016E
FY2011
FY2012
FY2013
FY2014
FY2015E FY2016E
Debt
D/E Ratio
ROE
ROCE
Source: Company, Angel Research
Source: Company, Angel Research
September 12, 2014
6
Sterling Tools | Initiating Coverage
Financial outlook
Top-line likely to clock a CAGR of ~14% over FY2014-16E
STL has reported standalone sales CAGR of ~1% over FY2012-14. During
Going forward, we expect STL to
FY2013, the company was unable to perform well due to slowdown in Indian
register a healthy sales CAGR of ~14%
economy and subdued automobile sales volumes, which affected overall OEM
over FY2014-16E
sales performance. Going forward, we expect STL to register healthy net sales
CAGR of ~14% over FY2014-16E supported by healthy sales volume in the
automobile industry owing to recovery in the Indian economy. Further, the
company is also increasing its distribution network which would improve sales from
the replacement markets. Hence, we expect STL’s net sales to grow by ~13% yoy
and ~15% yoy in FY2015 and FY2016, respectively.
Exhibit 10: Projected Net Sales growth trend
450
45
394
400
40
342
35
350
38.0
295
301
30
283
300
25
248
250
20
200
18.8
15
15.4
10
150
13.4
5
100
6.7
(4.2)
0
50
(5)
0
(10)
FY2011
FY2012
FY2013
FY2014
FY2015E FY2016E
Net Sales
yoy growth (%)
Source: Company, Angel Research
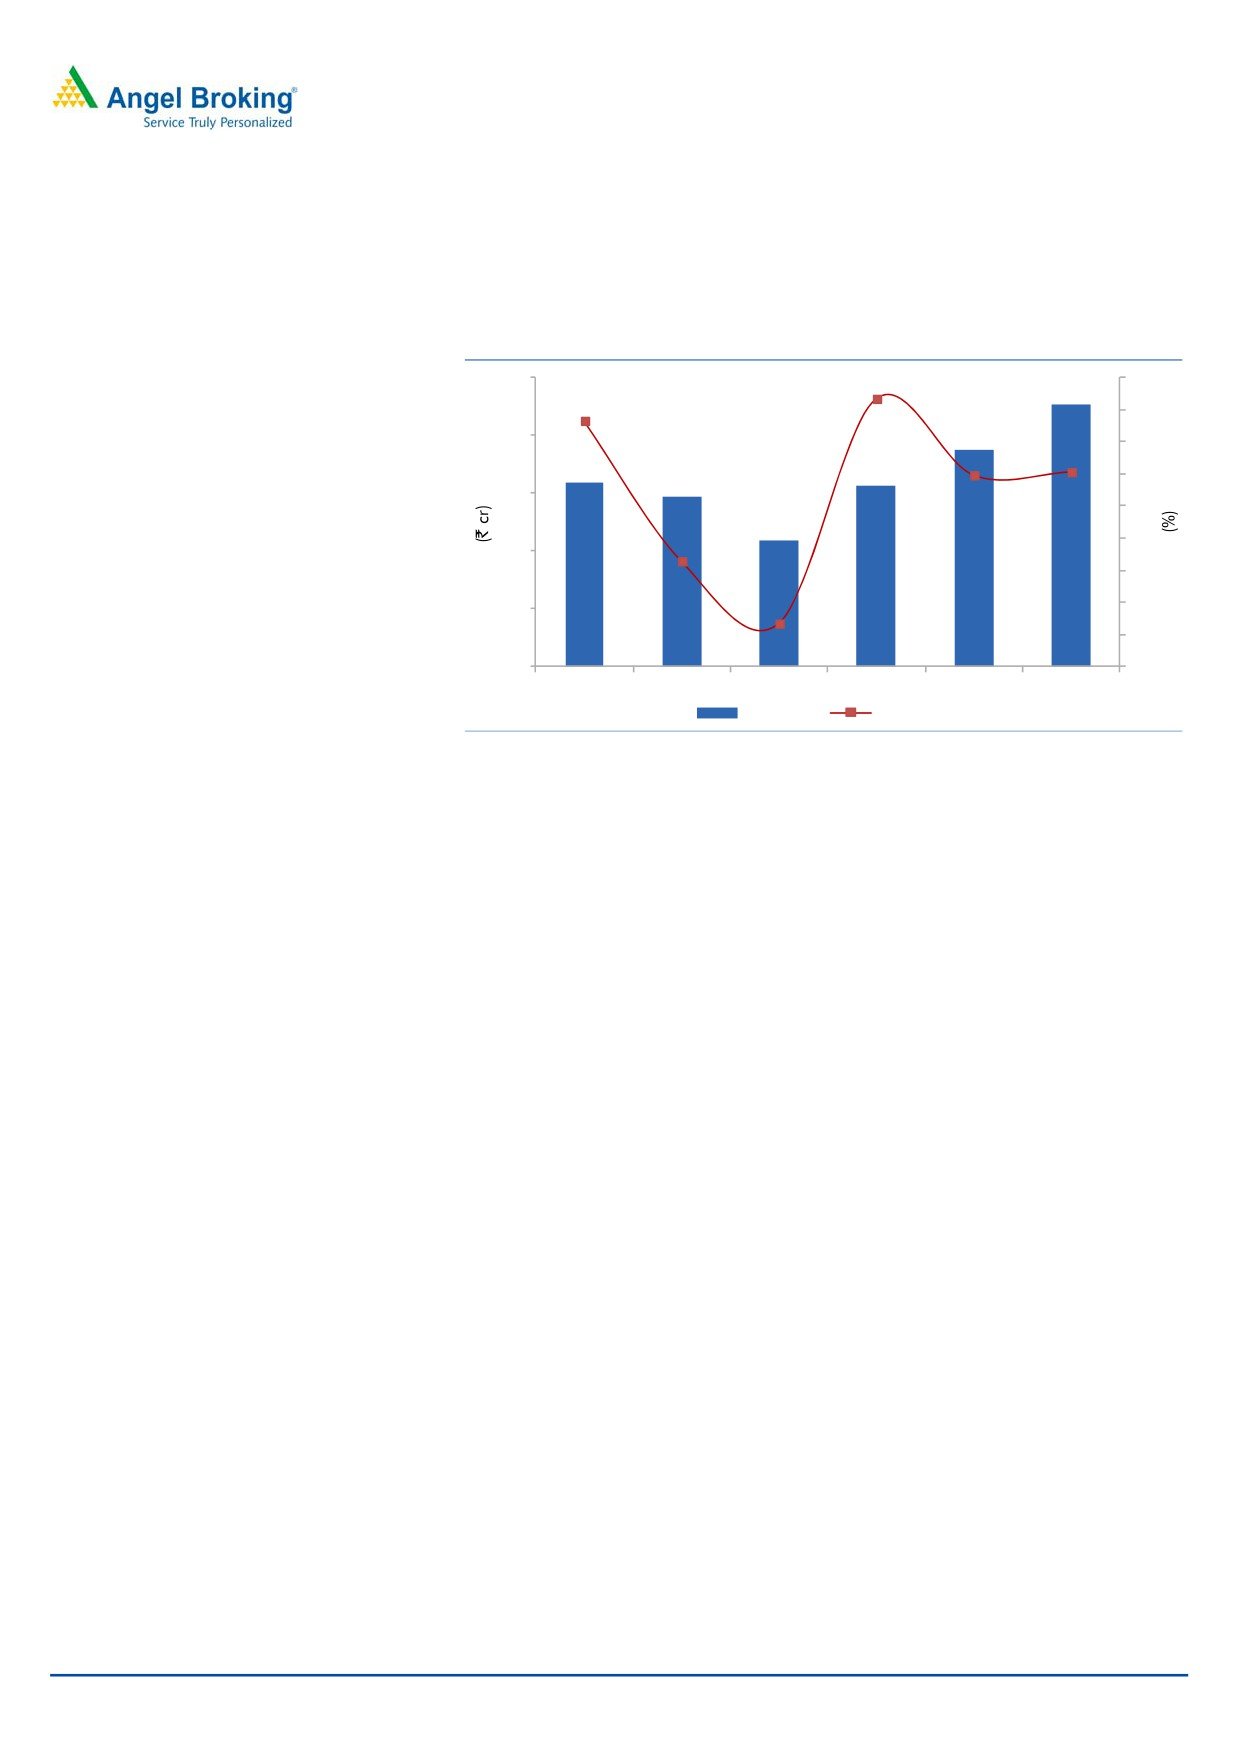
EBITDA to witness a CAGR of ~15% over FY2014-16E
Going forward, we expect the
Going forward, we expect the company’s operating margin to be in the range of
company’s operating margin to be in
13.5-13.9% owing to cost effective management strategy, higher capacity
the range of 13.5-13.9%
utilization, and better product mix.
Exhibit 11: Projected Operating profit growth and margin trend
60
15
55
47
15
50
14.7
42
14
40
36
37
35
13.9
13.9
13.9
14
30
13
13
20
12.7
12.4
12
10
12
0
11
FY2011
FY2012
FY2013
FY2014
FY2015E FY2016E
Operating Profit
Margin (%)
Source: Company, Angel Research
September 12, 2014
7
Sterling Tools | Initiating Coverage
Company to report healthy Net Profit growth
We expect ~20% CAGR in Net Profit
We expect the company to post an ~20% CAGR in net profit over FY2014-16E,
over FY2014-16E
mainly led by strong revenue growth, better margin and lower interest cost.
Exhibit 12: Projected Net Profit growth trend
25
43.6
50
23
36.8
40
20
19
30
20.8
16
16
15
20
15
19.8
10
11
(6.9)
0
10
(10)
(20)
5
(26.3)
(30)
0
(40)
FY2011
FY2012
FY2013
FY2014
FY2015E FY2016E
Net Profit
Growth (%)
Source: Company, Angel Research
September 12, 2014
8
Sterling Tools | Initiating Coverage
Outlook and Valuation
Going ahead, we expect STL to report net sales CAGR of ~14% over FY2014-16
to ~`394cr owing to recovery in automobile sales volumes in both domestic as
well as export markets. This will lead to recurring business opportunities for auto
ancillary companies like STL. Going ahead, the company would improve its
volume growth in the fasteners segment driven by healthy volume growth from
OEMs customers like Honda Motorcycle & Scooters India, Maruti Suzuki India, Tata
Motors, Ashok Leyland, Daimler, Fiat, Hero Motocorp, Mahindra & Mahindra,
Volvo, Eicher, TAFE and General Motors.
On the profitability front, we forecast STL to report a net profit CAGR of ~20%
over FY2014-16 to ~`23cr owing to healthy sales and better operating margins
due to better product mix and cost effective management strategy.
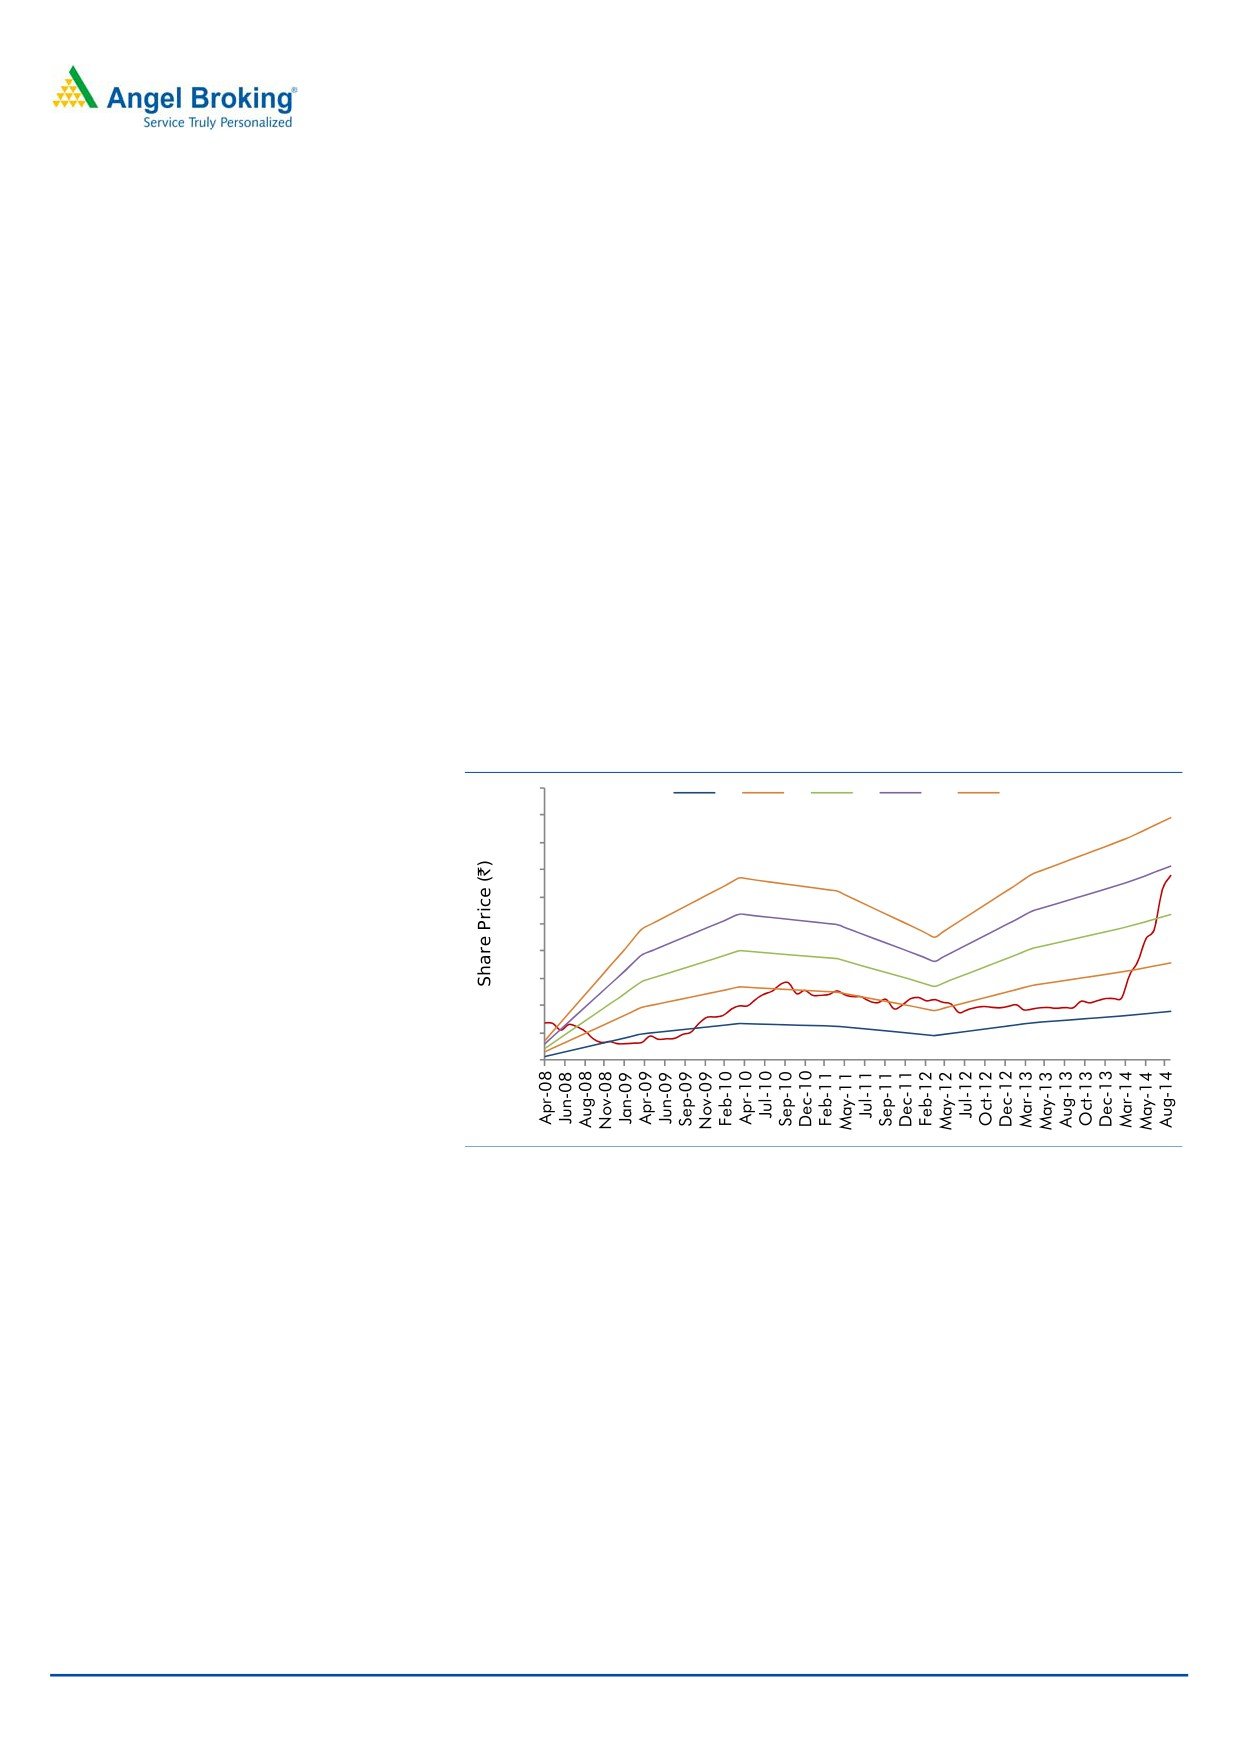
At the current market price of `332, the stock trades at a PE of 12.1x and 10.0x
its FY2015E and FY2016E EPS of `27.4 and `33.1, respectively. We initiate
coverage on the stock with a Buy recommendation and target price of `397, based
on 12x FY2016E EPS, indicating an upside of ~20% from the current levels.
Exhibit 13: One-year forward P/E band
500
3x
6x
9x
12x
15x
450
400
350
300
250
200
150
100
50
0
Source: Company, Angel Research
The downside risks to our estimates include 1) any increase in input costs (ie steel,
iron, etc.) could negatively impact profitability, and 2) downturn in the automobile
industry could affect business growth.
September 12, 2014
9
Sterling Tools | Initiating Coverage
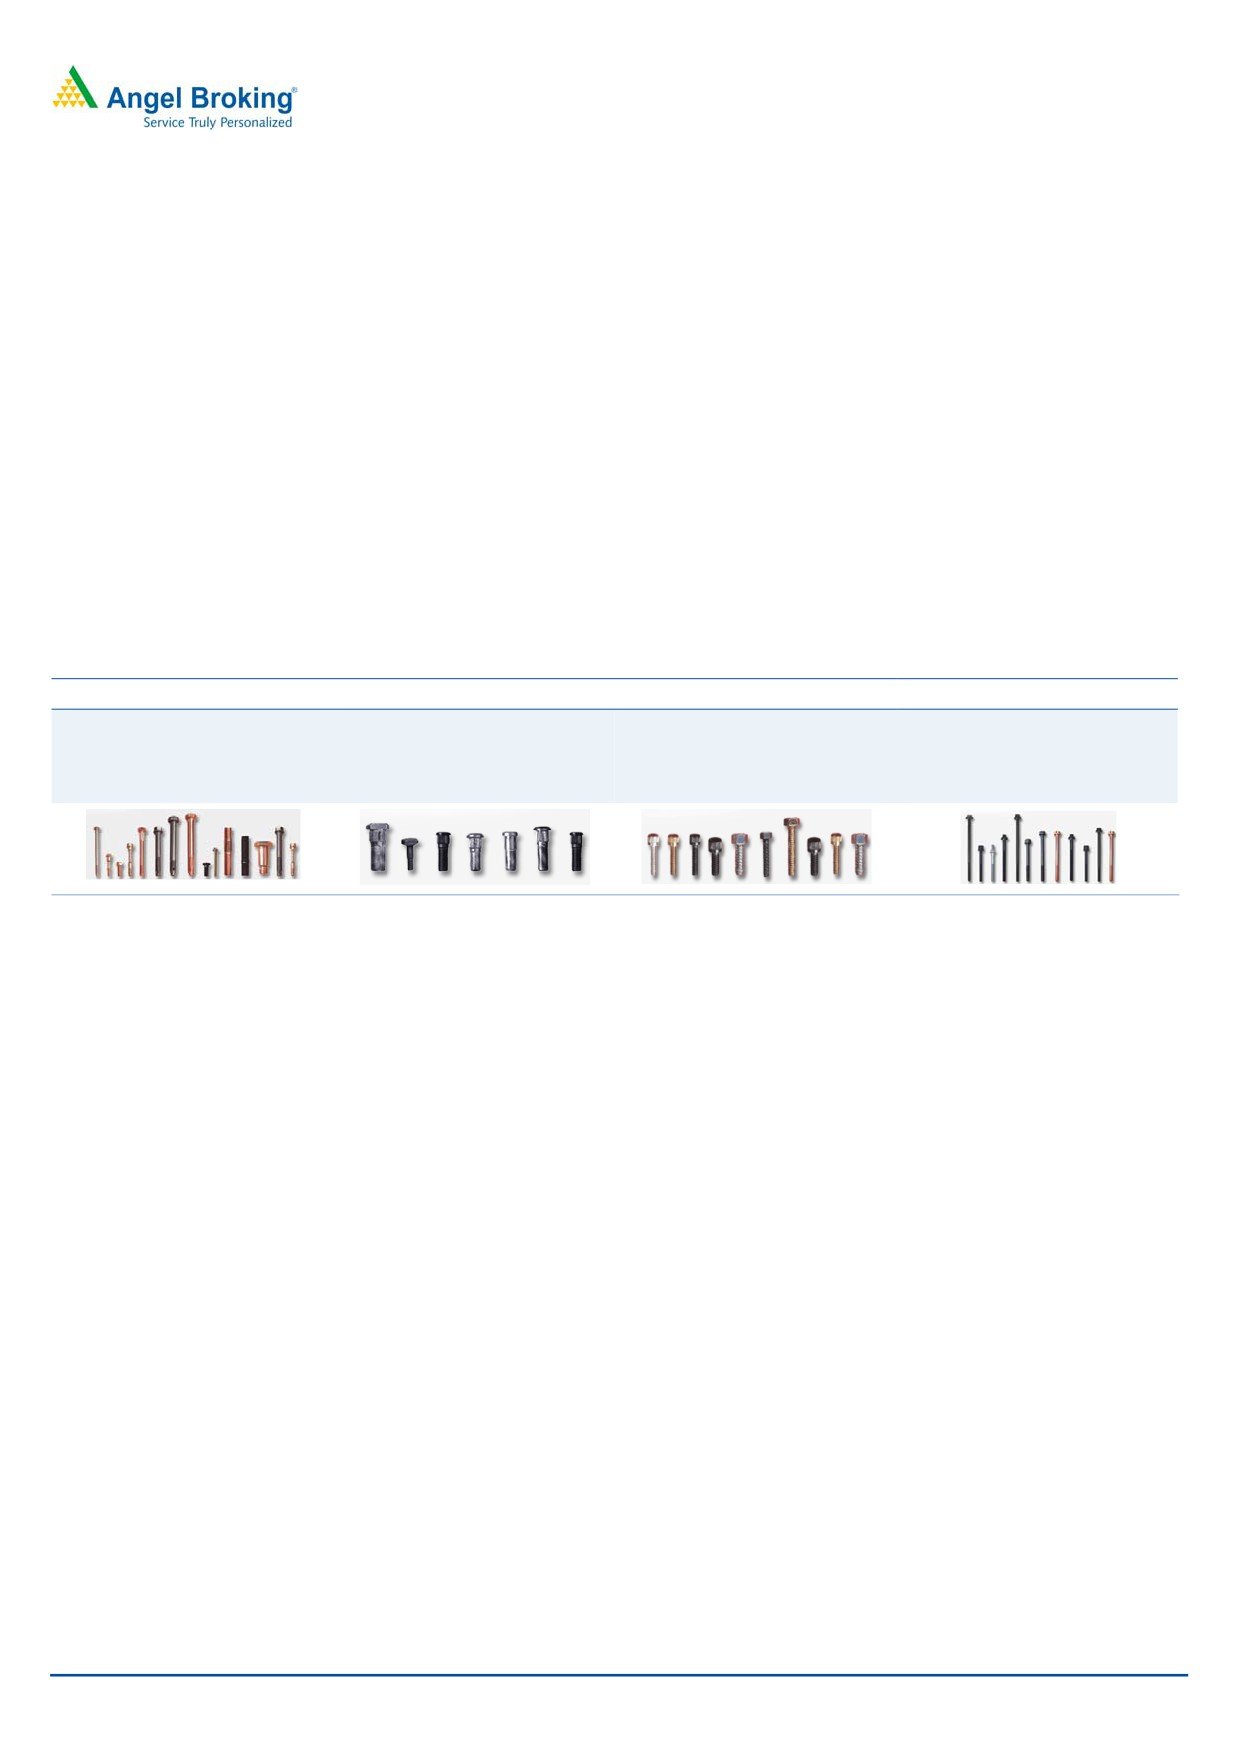
Company Background
Sterling Tools Limited (STL), founded in 1979, engages in manufacturing of high-
tensile (HT) cold forged fasteners mainly for automobiles. The company is one of
the top-3 fastener manufacturers in India and caters to leading automotive
companies in India, Europe, South America and USA-NAFTA. Its product portfolio
includes special fasteners, standard fasteners, surface treatment and coatings,
chassis fasteners and engine fasteners. Its product range includes over 2,000 types
of fasteners ranging from 5mm to 24mm in diameter. The company has three
manufacturing plants in Haryana with a total capacity of 41,600 MT and has over
1,000 employees. STL is the largest supplier of HT fasteners to Honda Motorcycle
& Scooters India and the second largest supplier to Maruti Suzuki India and Tata
Motors. The company’s other blue chip customers include Ashok Leyland, Daimler,
Fiat, Hero Motocorp, Mahindra & Mahindra, Volvo, Eicher, TAFE and General
Motors.
Exhibit 14: Product Profile
Special Fasteners
Standard Fasteners
Chassis Fasteners
Engine Fasteners
Designed specially for unique
Include socket head cap screws,
Include hub/wheel bolts, hub
Include
cylinder
head
customer specifications, available
hexagonal head bolts, studs,
nuts, wheel studs, bolts, rivets
bolts/screws, fly wheel
bolts,
in a variety of surface protection
hexagon nuts and weld nuts
and two wheeler spindles/ wheel
connecting
rod
bolts/nuts,
coatings
axles
balance weight bolts
Source: Company, Angel Research
September 12, 2014
10
Sterling Tools | Initiating Coverage
Profit & Loss Statement
Y/E March (` cr)
FY2011
FY2012 FY2013 FY2014
FY2015E FY2016E
Total operating income
248
295
283
301
342
394
% chg
38.0
18.8
(4.2)
6.7
13.4
15.4
Total Expenditure
212
258
247
260
294
339
Cost of Materials
113
135
130
131
150
175
Personnel
21
24
24
26
30
35
Others
78
99
93
103
114
129
EBITDA
36
37
35
42
47
55
% chg
19.6
2.7
(6.0)
18.8
13.7
15.4
(% of Net Sales)
14.7
12.7
12.4
13.9
13.9
13.9
Depreciation & Amortisation
6
8
9
10
11
12
EBIT
30
29
26
31
36
42
% chg
24.2
(1.8)
(12.6)
22.3
15.2
16.8
(% of Net Sales)
12.1
10.0
9.1
10.4
10.6
10.7
Interest & other Charges
7
10
10
8
8
8
Other Income
0
1
2
1
1
1
(% of PBT)
1.4
3.0
9.2
3.6
3.4
2.8
Share in profit of Associates
-
-
-
-
-
-
Recurring PBT
24
20
17
24
29
35
% chg
26.9
(14.1)
(14.9)
39.9
20.8
20.8
Prior Period & Extraordinary Exp./(Inc.)
-
-
-
-
-
-
PBT (reported)
24
20
17
24
29
35
Tax
8
6
6
9
11
13
(% of PBT)
33.0
27.4
37.1
35.5
36.0
36.0
PAT (reported)
16
15
11
16
19
23
ADJ. PAT
16
15
11
16
19
23
% chg
36.8
(6.9)
(26.3)
43.6
19.8
20.8
(% of Net Sales)
6.4
5.0
3.9
5.2
5.5
5.7
Basic EPS (`)
23.2
21.6
15.9
22.8
27.4
33.1
Fully Diluted EPS (`)
23.2
21.6
15.9
22.8
27.4
33.1
% chg
36.8
(6.9)
(26.3)
43.6
19.8
20.8
September 12, 2014
11
Sterling Tools | Initiating Coverage
Balance Sheet
Y/E March (` cr)
FY2011
FY2012
FY2013
FY2014
FY2015E FY2016E
SOURCES OF FUNDS
Equity Share Capital
7
7
7
7
7
7
Reserves& Surplus
64
75
82
94
109
128
Shareholders Funds
71
82
89
101
116
135
Minority Interest
-
-
-
-
-
-
Total Loans
77
93
88
65
65
65
Deferred Tax Liability
10
10
13
13
13
13
Total Liabilities
158
186
190
179
194
213
APPLICATION OF FUNDS
Gross Block
135
155
170
186
206
228
Less: Acc. Depreciation
47
54
64
74
85
98
Net Block
87
101
107
112
121
131
Capital Work-in-Progress
0
1
0
-
-
-
Investments
2
4
4
5
6
7
Current Assets
95
108
99
90
100
113
Inventories
37
47
40
36
37
41
Sundry Debtors
40
41
37
35
37
41
Cash
8
5
8
6
10
12
Loans & Advances
10
8
10
11
13
17
Other Assets
1
7
4
2
2
2
Current liabilities
27
29
21
28
32
37
Net Current Assets
69
79
78
62
67
76
Deferred Tax Asset
1
1
1
-
-
-
Mis. Exp. not written off
-
-
-
-
-
-
Total Assets
158
186
190
179
194
213
September 12, 2014
12
Sterling Tools | Initiating Coverage
Cashflow Statement
Y/E March (` cr)
FY2011
FY2012
FY2013
FY2014
FY2015E FY2016E
Profit before tax
24
20
17
24
29
35
Depreciation
6
8
9
10
11
12
Change in Working Capital
(18)
(12)
8
11
(2)
(7)
Interest / Dividend (Net)
6
9
10
7
8
8
Direct taxes paid
(7)
(7)
(4)
(7)
(11)
(13)
Others
(0)
(0)
0
2
0
0
Cash Flow from Operations
11
19
41
49
36
36
(Inc.)/ Dec. in Fixed Assets
(17)
(22)
(15)
(16)
(20)
(22)
(Inc.)/ Dec. in Investments
(2)
(2)
-
(1)
(1)
(1)
Cash Flow from Investing
(18)
(24)
(15)
(17)
(21)
(23)
Issue of Equity
0
0
0
0
0
0
Inc./(Dec.) in loans
30
17
(6)
(22)
(0)
0
Dividend Paid (Incl. Tax)
(2)
(4)
(8)
(4)
(3)
(3)
Interest / Dividend (Net)
(15)
(10)
(10)
(7)
(8)
(8)
Cash Flow from Financing
13
4
(23)
(33)
(12)
(11)
Inc./(Dec.) in Cash
6
(2)
3
(2)
3
2
Opening Cash balances
2
8
5
8
6
10
Closing Cash balances
8
5
8
6
10
12
September 12, 2014
13
Sterling Tools | Initiating Coverage
Key Ratios
Y/E March
FY2011
FY2012
FY2013
FY2014
FY2015E FY2016E
Valuation Ratio (x)
P/E (on FDEPS)
14.3
15.4
20.8
14.5
12.1
10.0
P/CEPS
10.2
10.0
11.2
8.7
7.6
6.5
P/BV
3.2
2.8
2.5
2.3
2.0
1.7
Dividend yield (%)
1.5
1.5
1.5
1.5
1.5
1.5
EV/Sales
1.2
1.1
1.1
0.9
0.8
0.7
EV/EBITDA
8.1
8.3
8.6
6.7
5.8
5.0
EV / Total Assets
1.6
1.4
1.4
1.4
1.2
1.1
Per Share Data (`)
EPS (Basic)
23.2
21.6
15.9
22.8
27.4
33.1
EPS (fully diluted)
23.2
21.6
15.9
22.8
27.4
33.1
Cash EPS
32.6
33.2
29.7
37.9
43.8
51.2
DPS
5.0
5.0
5.0
5.0
5.0
5.0
Book Value
104.2
120.0
130.0
147.0
169.4
197.5
Returns (%)
ROCE
20.3
17.7
15.4
19.5
20.6
21.8
Angel ROIC (Pre-tax)
21.7
18.6
16.5
20.9
22.5
24.0
ROE
22.2
18.0
12.2
15.5
16.2
16.7
Turnover ratios (x)
Asset Turnover (Gross Block)
2.8
2.9
2.6
2.7
2.8
3.0
Inventory / Sales (days)
55
58
52
43
40
38
Receivables (days)
59
50
48
42
40
38
Payables (days)
29
24
20
25
28
30
WC cycle (ex-cash) (days)
85
84
80
61
52
46
September 12, 2014
14
Sterling Tools | Initiating Coverage
Research Team Tel: 022 - 39357800
DISCLAIMER
This document is solely for the personal information of the recipient, and must not be singularly used as the basis of any investment
decision. Nothing in this document should be construed as investment or financial advice. Each recipient of this document should
make such investigations as they deem necessary to arrive at an independent evaluation of an investment in the securities of the
companies referred to in this document (including the merits and risks involved), and should consult their own advisors to determine
the merits and risks of such an investment.
Angel Broking Pvt. Limited, its affiliates, directors, its proprietary trading and investment businesses may, from time to time, make
investment decisions that are inconsistent with or contradictory to the recommendations expressed herein. The views contained in this
document are those of the analyst, and the company may or may not subscribe to all the views expressed within.
Reports based on technical and derivative analysis center on studying charts of a stock's price movement, outstanding positions and
trading volume, as opposed to focusing on a company's fundamentals and, as such, may not match with a report on a company's
fundamentals.
The information in this document has been printed on the basis of publicly available information, internal data and other reliable
sources believed to be true, but we do not represent that it is accurate or complete and it should not be relied on as such, as this
document is for general guidance only. Angel Broking Pvt. Limited or any of its affiliates/ group companies shall not be in any way
responsible for any loss or damage that may arise to any person from any inadvertent error in the information contained in this report.
Angel Broking Pvt. Limited has not independently verified all the information contained within this document. Accordingly, we cannot
testify, nor make any representation or warranty, express or implied, to the accuracy, contents or data contained within this document.
While Angel Broking Pvt. Limited endeavours to update on a reasonable basis the information discussed in this material, there may be
regulatory, compliance, or other reasons that prevent us from doing so.
This document is being supplied to you solely for your information, and its contents, information or data may not be reproduced,
redistributed or passed on, directly or indirectly.
Angel Broking Pvt. Limited and its affiliates may seek to provide or have engaged in providing corporate finance, investment banking
or other advisory services in a merger or specific transaction to the companies referred to in this report, as on the date of this report or
in the past.
Neither Angel Broking Pvt. Limited, nor its directors, employees or affiliates shall be liable for any loss or damage that may arise from
or in connection with the use of this information.
Note: Please refer to the important `Stock Holding Disclosure' report on the Angel website (Research Section). Also, please refer to the
latest update on respective stocks for the disclosure status in respect of those stocks. Angel Broking Pvt. Limited and its affiliates may
have investment positions in the stocks recommended in this report.
Disclosure of Interest Statement
Sterling Tools
1. Analyst ownership of the stock
No
2. Angel and its Group companies ownership of the stock
No
3. Angel and its Group companies' Directors ownership of the stock
No
4. Broking relationship with company covered
No
Note: We have not considered any Exposure below ` 1 lakh for Angel, its Group companies and Directors
Ratings (Returns):
Buy (> 15%)
Accumulate (5% to 15%)
Neutral (-5 to 5%)
Reduce (-5% to -15%)
Sell (< -15%)
September 12, 2014
15
Sterling Tools | Initiating Coverage
6th Floor, Ackruti Star, Central Road, MIDC, Andheri (E), Mumbai- 400 093. Tel: (022) 39357800
Research Team
Fundamental:
Sarabjit Kour Nangra
VP-Research, Pharmaceutical
Vaibhav Agrawal
VP-Research, Banking
Amarjeet Maurya
Analyst
Bharat Gianani
Analyst
Shrenik Gujrathi
Analyst
Umesh Matkar
Analyst
Twinkle Gosar
Analyst
Tejas Vahalia
Research Editor
Technicals and Derivatives:
Siddarth Bhamre
Head - Technical & Derivatives
Sameet Chavan
Technical Analyst
Nagesh Arekar
Executive
Sneha Seth
Associate (Derivatives)
Institutional Sales Team:
Mayuresh Joshi
VP - Institutional Sales
Meenakshi Chavan
Dealer
Gaurang Tisani
Dealer
Production Team:
Dilip Patel
Production Incharge
CSO & Registered Office: G-1, Ackruti Trade Centre, Road No. 7, MIDC, Andheri (E), Mumbai - 93. Tel: (022) 3083 7700. Angel Broking Pvt. Ltd: BSE Cash: INB010996539 / BSE F&O: INF010996539, CDSL Regn. No.: IN - DP - CDSL - 234 - 2004, PMS Regn. Code: PM/INP000001546, NSE Cash: INB231279838 /
NSE F&O: INF231279838 / NSE Currency: INE231279838, MCX Stock Exchange Ltd: INE261279838 / Member ID: 10500. Angel Commodities Broking (P) Ltd.: MCX Member ID: 12685 / FMC Regn. No.: MCX / TCM / CORP / 0037 NCDEX: Member ID 00220 / FMC Regn. No.: NCDEX / TCM / CORP / 0302.
September 12, 2014
16