IPO Note | Auto Ancillary
April 30, 2012
SMFL
AVOID
Issue Open: May 02, 2012
Stretched Valuations
Issue Close: May 04, 2012
Samvardhana Motherson Finance Ltd. (SMFL) is the principal holding company of
Issue Details
the Samvardhana Motherson group with 18 subsidiaries, 19 Joint Ventures and
86 other consolidated entities catering to the domestic and global automotive
Face Value: `10
industry. The principal investments of SMFL constitute a 36.1% stake in Motherson
Present Eq. Paid-up Capital: `473.6cr
Sumi Systems (MSSL), 49% stake in Samvardhana Motherson Reflectec Group
Holdings Ltd. (SMR, erstwhile Visiocorp) and
49% stake in Samvardhana
Offer Size*: 14.7cr shares
Motherson Polymers Ltd. (SMPL). Together the three companies accounted for
~94% of the consolidated revenues in 9MFY2012.
Post Eq. Paid-up Capital: `592.5cr
MSSL: MSSL is the flagship company of the group and is the market leader in the
Issue size (amount): `1,665cr
domestic wiring harness segment with a market share of ~65%.
Price Band: `113-118
SMR: SMR, acquired in March 2009, is the world’s second largest exterior rear
Post-issue implied market cap**: `6,696cr -
6,933cr
view mirror manufacturer with ~22% global market share.
Promoters holding Pre-Issue: 90.4%
SMPL: SMPL is engaged in the business of high quality plastic components and
assemblies for exterior and interior trims for passenger vehicles through Peguform
Promoters holding Post-Issue*: 67.4%
companies acquired in November 2011.
Note:* At the lower price band, **At the lower and
upper price band, respectively
SMFL’s major customers include the Volkswagen group, BMW, Daimler, Renault
Nissan, Ford India Private Limited, Volvo Car Corporation, Maruti Suzuki, Tata
Book Building
Motors, Honda Siel Cars India Limited, Toyota Kirloskar Motor Private Limited and
Fiat India Automobiles Limited.
QIBs
Up to 50%
Outlook and valuation: We value SMFL’s 36.1% stake in MSSL based on our
Non-Institutional
At least 15%
target price for the company
(`216 based on
15x FY2014E consolidated
Retail
At least 35%
earnings). We value SMFL’s stake in SMR and SMPL on an EV/Sales basis instead
of earnings based multiples as current earnings of these companies’ do not reflect
their true potential. Currently the profitability at SMR and SMPL has been
Post Issue Shareholding Pattern
impacted due to significant start up costs in relation to new manufacturing
facilities and due to one-time costs related to the acquisition and refinancing of
Promoters Group
67.4
Peguform Group.
MF/Banks/Indian
FIs/FIIs/Public & Others
32.6
Based on our SOTP methodology we arrive at a value of `97/share against the
IPO price band of `113-`118. Management expects to turnaround the financial
performances of SMR and SMPL over the medium term. However, we believe that
it is early to factor in the anticipated turnaround in these two subsidiaries and
valuations in our view are not providing sufficient margin of safety to investors
considering the execution risks involved in the turnaround process. Hence we
recommend Avoid on the issue.
Key financials (Consolidated)
Y/E March (` cr)
FY2009
FY2010
FY2011 9MFY2012
Net Sales
843
4,914
5,635
5,957
% chg
67.3
483.0
14.7
5.7
Net Profit
57
70
140
(91)
% chg
76.3
23.6
100.1
-
EBITDA Margin (%)
5.3
4.7
7.5
3.3
EPS (`)
1.6
1.3
3.0
(1.9)
P/E (x) Lower End
69.3
87.2
37.8
-
Yaresh Kothari
P/E (x) Upper End
72.3
91.0
39.5
-
022 - 39357800 Ext: 6844
RoE (%)
7.0
6.0
10.1
(6.3)
Source: Company, Angel Research
Please refer to important disclosures at the end of this report
1
SMFL | IPO Note
Company background
Samvardhana Motherson Finance Ltd. (SMFL), a principal holding company with
18 subsidiaries, 19 Joint Ventures and 86 other consolidated entities is an
integrated design and manufacturing company providing full system solutions to
diverse industries. The principal focus of the company is the domestic and global
automotive industry and is catered through Motherson Sumi Systems Ltd. (MSSL),
Samvardhana Motherson Reflectec Group Holdings Ltd. (SMR) and Samvardhana
Motherson Polymers Ltd. (SMPL). As of December 31, 2011, SMFL has a 36.1%
stake in MSSL - listed on domestic stock exchanges, 49% stake in SMR and 49%
stake in SMPL.
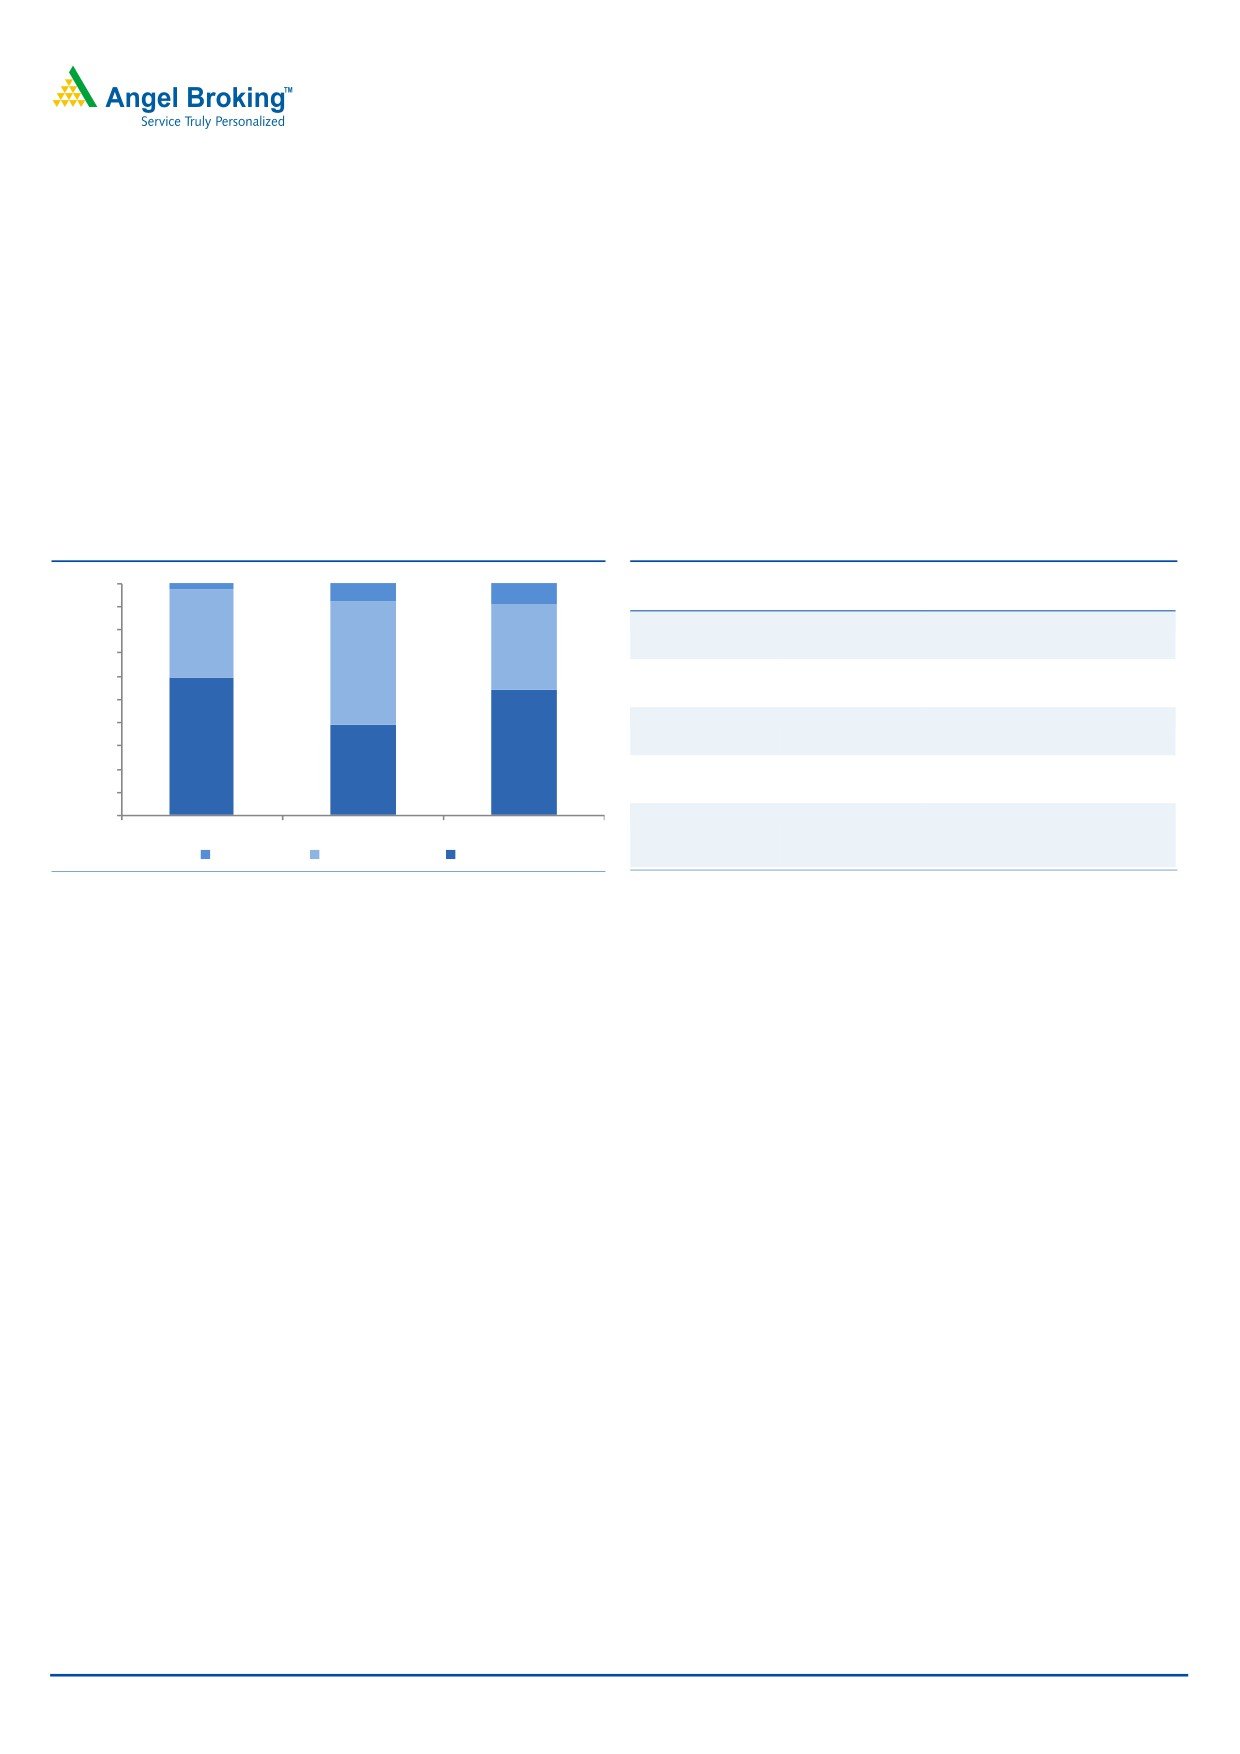
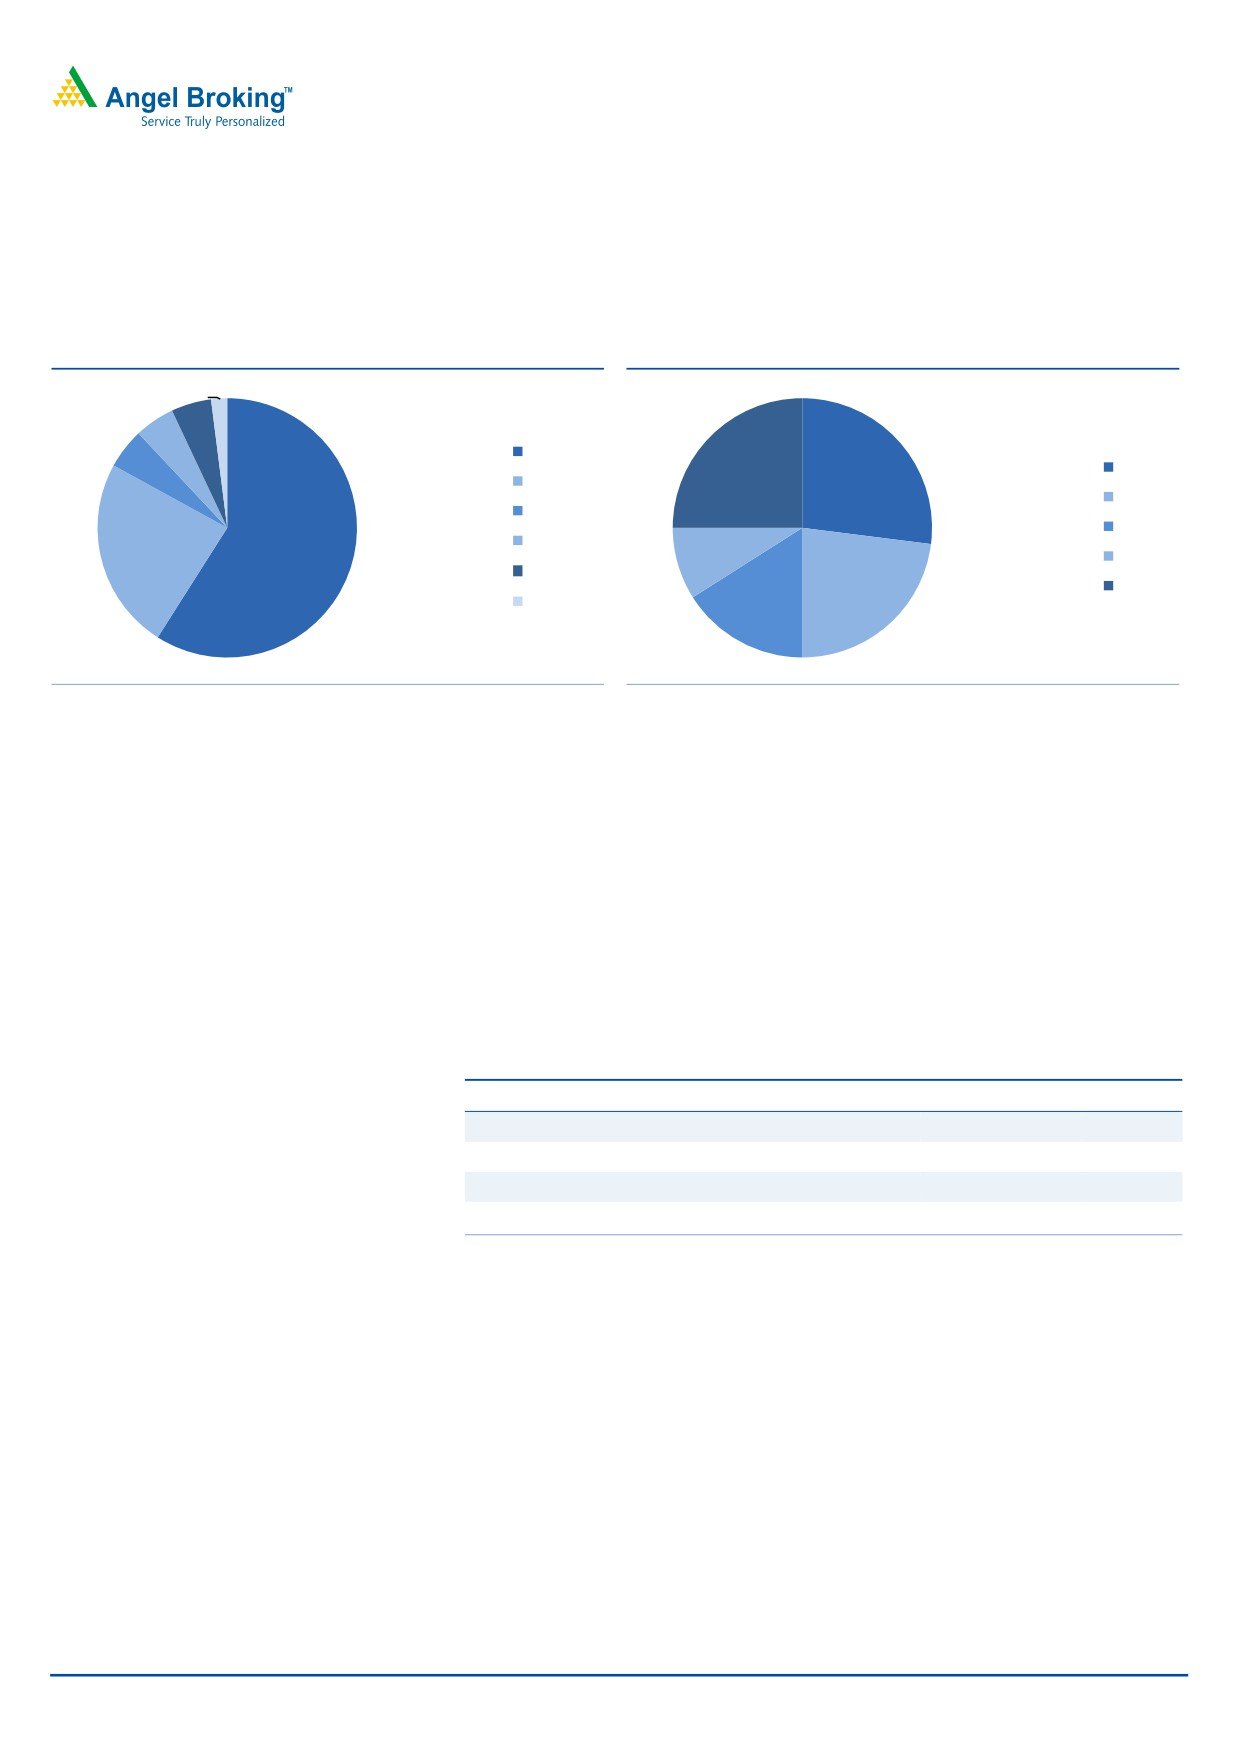
Exhibit 1: Consolidated revenue-mix
Exhibit 2: Product portfolio
Other Subsidiaries and Joint
100.0%
MSSL
SMR
Ventures
99.0%
Wiring harness
Rear view vision
Automotive lighting products
98.0%
3.8
3.7
systems
97.0%
5.3
Polymer
Bus and other commercial
96.0%
processing
vehicles HVAC system
95.0%
94.0%
Elastomer
Cabins for off-highway vehicle
93.0%
95.9
95.4
92.0%
93.9
Metal working
Refrigeration system
91.0%
90.0%
Car HVAC system
Manufatcuring support
FY2010
FY2011
9M FY2012
Information technology and
Unallocated
Non automotive
Automotive
design engineering
Source: RHP, Angel Research
Source: RHP, Angel Research
Through a combination of organic growth and acquisitions, SMFL is now a
multinational company with 120 manufacturing facilities and presence in
25
countries across the world. The company is in the process of establishing new
manufacturing facilities in India, Brazil, Mexico, Spain and Thailand. SMFL’s major
customers include the Volkswagen group, BMW, Daimler, Renault Nissan, Ford
India Private Limited, Volvo Car Corporation, Maruti Suzuki, Tata Motors, Honda
Siel Cars India Limited, Toyota Kirloskar Motor Private Limited and Fiat India
Automobiles Limited.
April 30, 2012
2
SMFL | IPO Note
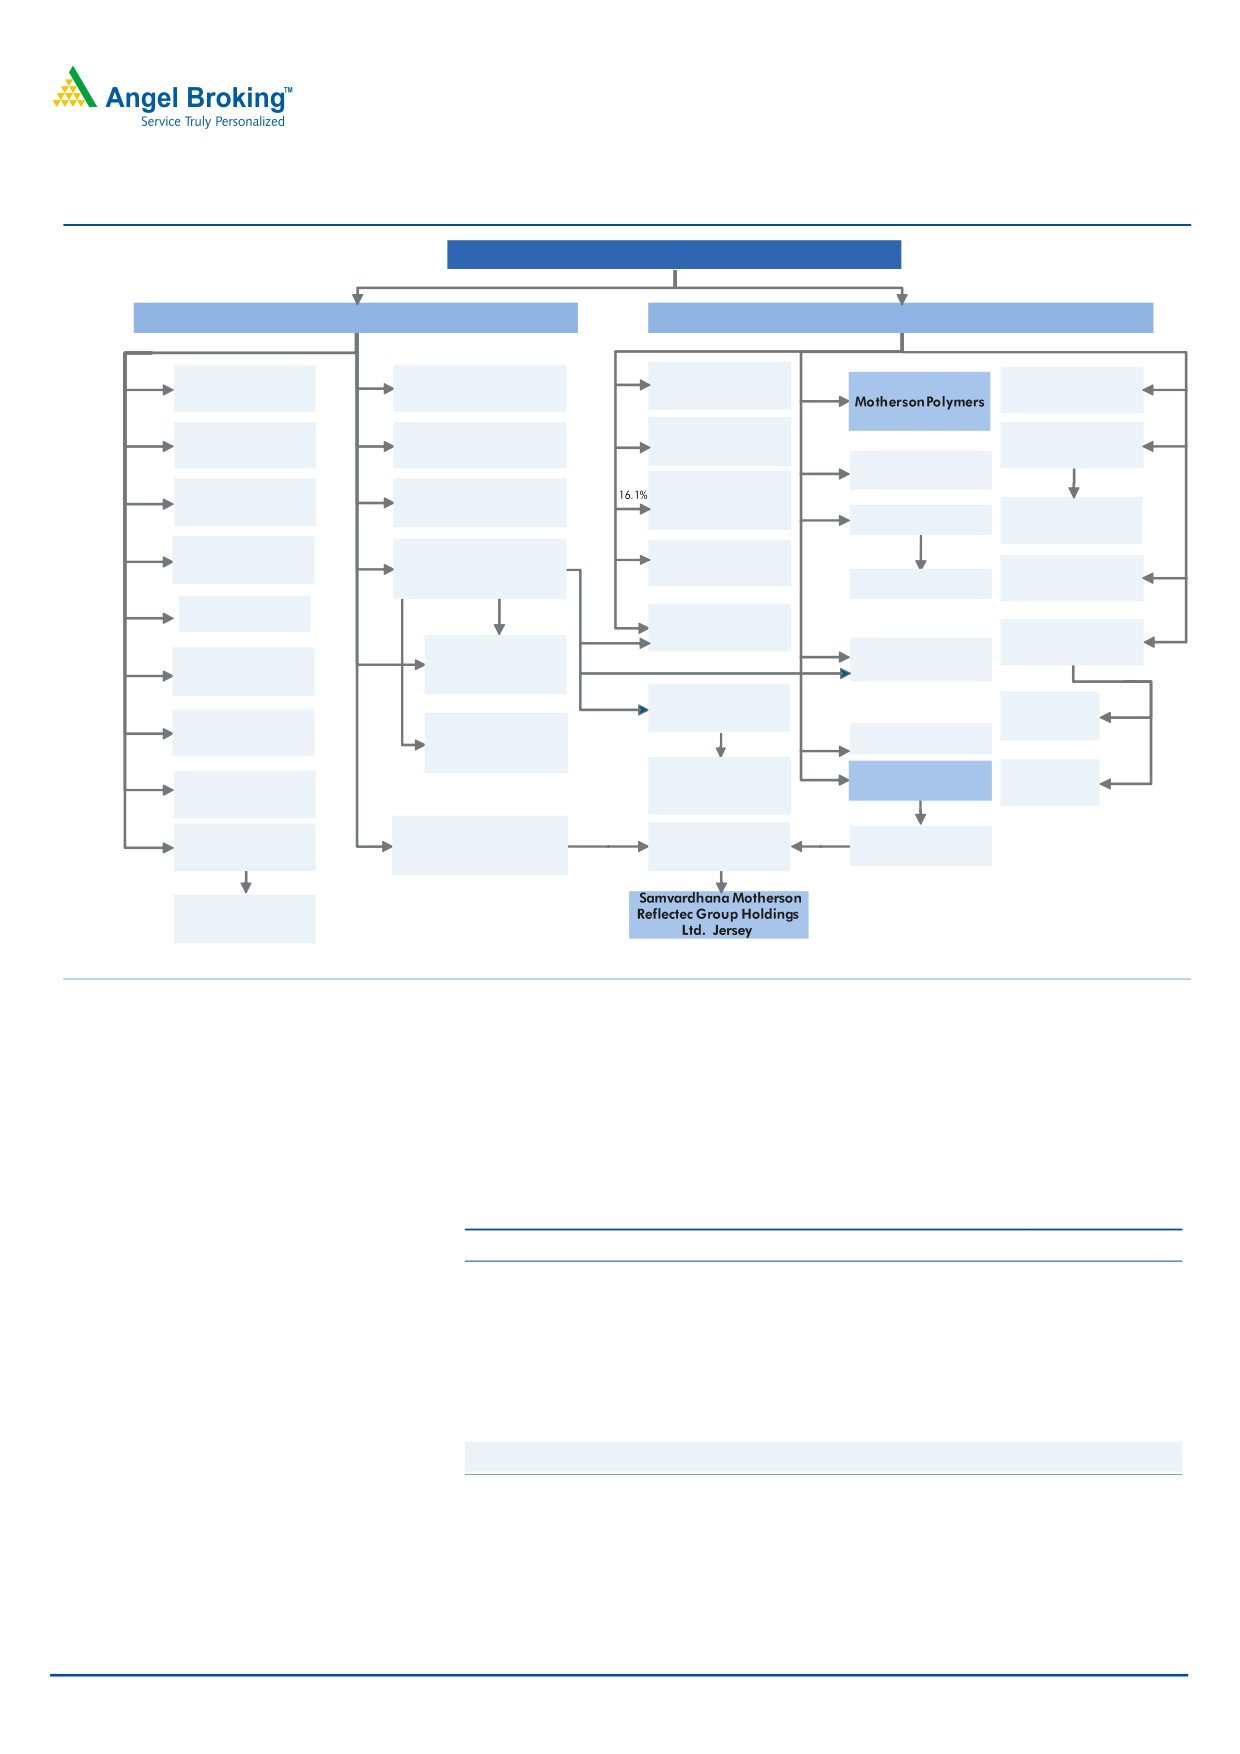
Exhibit 3: SMFL group structure
Samvardhana Motherson Finance Limited (SMFL)
Subsidiary
/ JV with Majority Holding
Other Joint Ventures / Associates
49%
100%
Motherson Climate
100%
Tigers Connect Travel
Spheros Motherson
Nachi Motherson
49%
49%
Samvardhana
System Ltd.
Systems and Solutions Ltd.
Thermal Systems Ltd.
Precision Ltd.
Ltd
Samvardhana
49%
100%
100%
Motherson Machinery and
Anest Iwata Coating
Motherson Techno
14.3%
Motherson Virtual
Automations Ltd.
Equipment Ltd.
Tools Ltd.
Analysis Ltd.
26%
AES (India)
Engineering Ltd.
100%
Sumi Motherson
100%
Motherson Advanced
51%
Motherson Molds and
Innovative Engineering
49%
Tooling Solutions Ltd.
Diecasting Ltd.
Anest Iwata Motherson
Motherson Techno
Ltd.
Ltd.
Tools Mideast (FZE)
100%
Motherson
100%
Samvardhana Motherson
41%
100%
Auto Engineering
CTM India Ltd.
43.3%
Finance Services
Motherson Air Travel
Service Ltd.
Cyprus Ltd.
Air Factory Energy Ltd.
Agencies Ltd.
100%
MSID USA
23.8%
0.8%
Fritzmeier Motherson
Cabin Engineering Ltd.
Systematic Conscom
Motherson
0.5%
26.3%
49.2%
Nissin Advanced
Ltd.
74%
Nachi Motherson Tool
Zanotti Refrigeration
Coating Indo Co.Ltd.
Technology Ltd.
System Ltd.
48.5%
50%
Magneti Marelli
Motherson Holding
SCCL Global
100%
66%
Motherson Auto
Samvardhana
India B.V.
50%
Project (FZE)
Matsui Technologies
Solutions Ltd.
Motherson Finance
100%
India Ltd.
100%
Services Inc.
Magneti Marelli
36.1%
Motherson Sumi
SCCL Infra
100%
58.1%
SAKS Ancillaries
Motherson Auto
Systems Ltd.
Projects Ltd.
Ltd.
System Ltd.
100%
Motherson Sumi
100%
Samvardhana Motherson
Samvardhana
53.6%
49%
51%
MSSL Mauritius
Infotech &
Holding (M) Pvt. Ltd.
Motherson Global
Holdings Ltd
Designs Ltd.
Mauritius
Holdings Ltd. Cyprus
51%
93.6%
Motherson
Bergstrom HVAC
Solutions Pvt. Ltd.
Source: Company, Angel Research
Details of the issue
SMFL intends to raise `1,665cr through the IPO which comprises a fresh equity
issue of `1,344cr and an offer for sale of `321cr by promoter group entity, Radha
Rani Holdings Pte Ltd.
Exhibit 4: Objects of the issue
Particulars
Amount (` cr)
Funding pre-payment and repayment of debt facilities
338.5
Funding strategic investments in SMPL
627.5
Funding investments in rear-view vision systems business
156.0
General corporate purposes
222.0
Total
1,344.0
Offer for sale by Radha Rani Investments
321.0
Total issue size
1,665.0
Source: RHP, Angel Research
April 30, 2012
3
SMFL | IPO Note
Investment arguments
Globally diversified business presence across automotive sector
SMFL has a strong presence across the automotive value chain and provides end
to end solutions to its customer’s right from designing to analysis, prototyping,
manufacturing, assembling to supply of integrated modules to the customers.
SMFL undertakes wiring harnesses business through MSSL and its subsidiaries,
joint ventures and associate companies. The rear view vision systems and the
polymer processing business is undertaken through SMR and SMPL (Peguform
Group companies), respectively.
Rear view vision systems business: SMFL undertakes the rear view vision systems
business through SMR which was acquired from Visiocorp Plc. in March 2009 at a
consideration of €26.5mn. Though SMR was a loss making entity when acquired,
SMFL along with MSSL turned it around and the company turned profitable in
3QFY2011 registering a PAT (before minority interest) of `25.4cr as against loss of
`9.2cr in 3QFY2010. Nearly 80% of SMR’s revenue comes from the exterior mirror
sales and 15% from the interior mirrors.
SMR caters to the requirements of the top ten OEMs globally and has
manufacturing facilities in India, China, Korea, Japan and Mexico. The company
has set up new facilities in Hungary and Brazil which has recently commenced
production. While the management expects SMR margins to return back to 6-7%
levels once the new plants ramp-up, there could be possible delays on account of
delays in launch of new models by customers or demand slowdown.
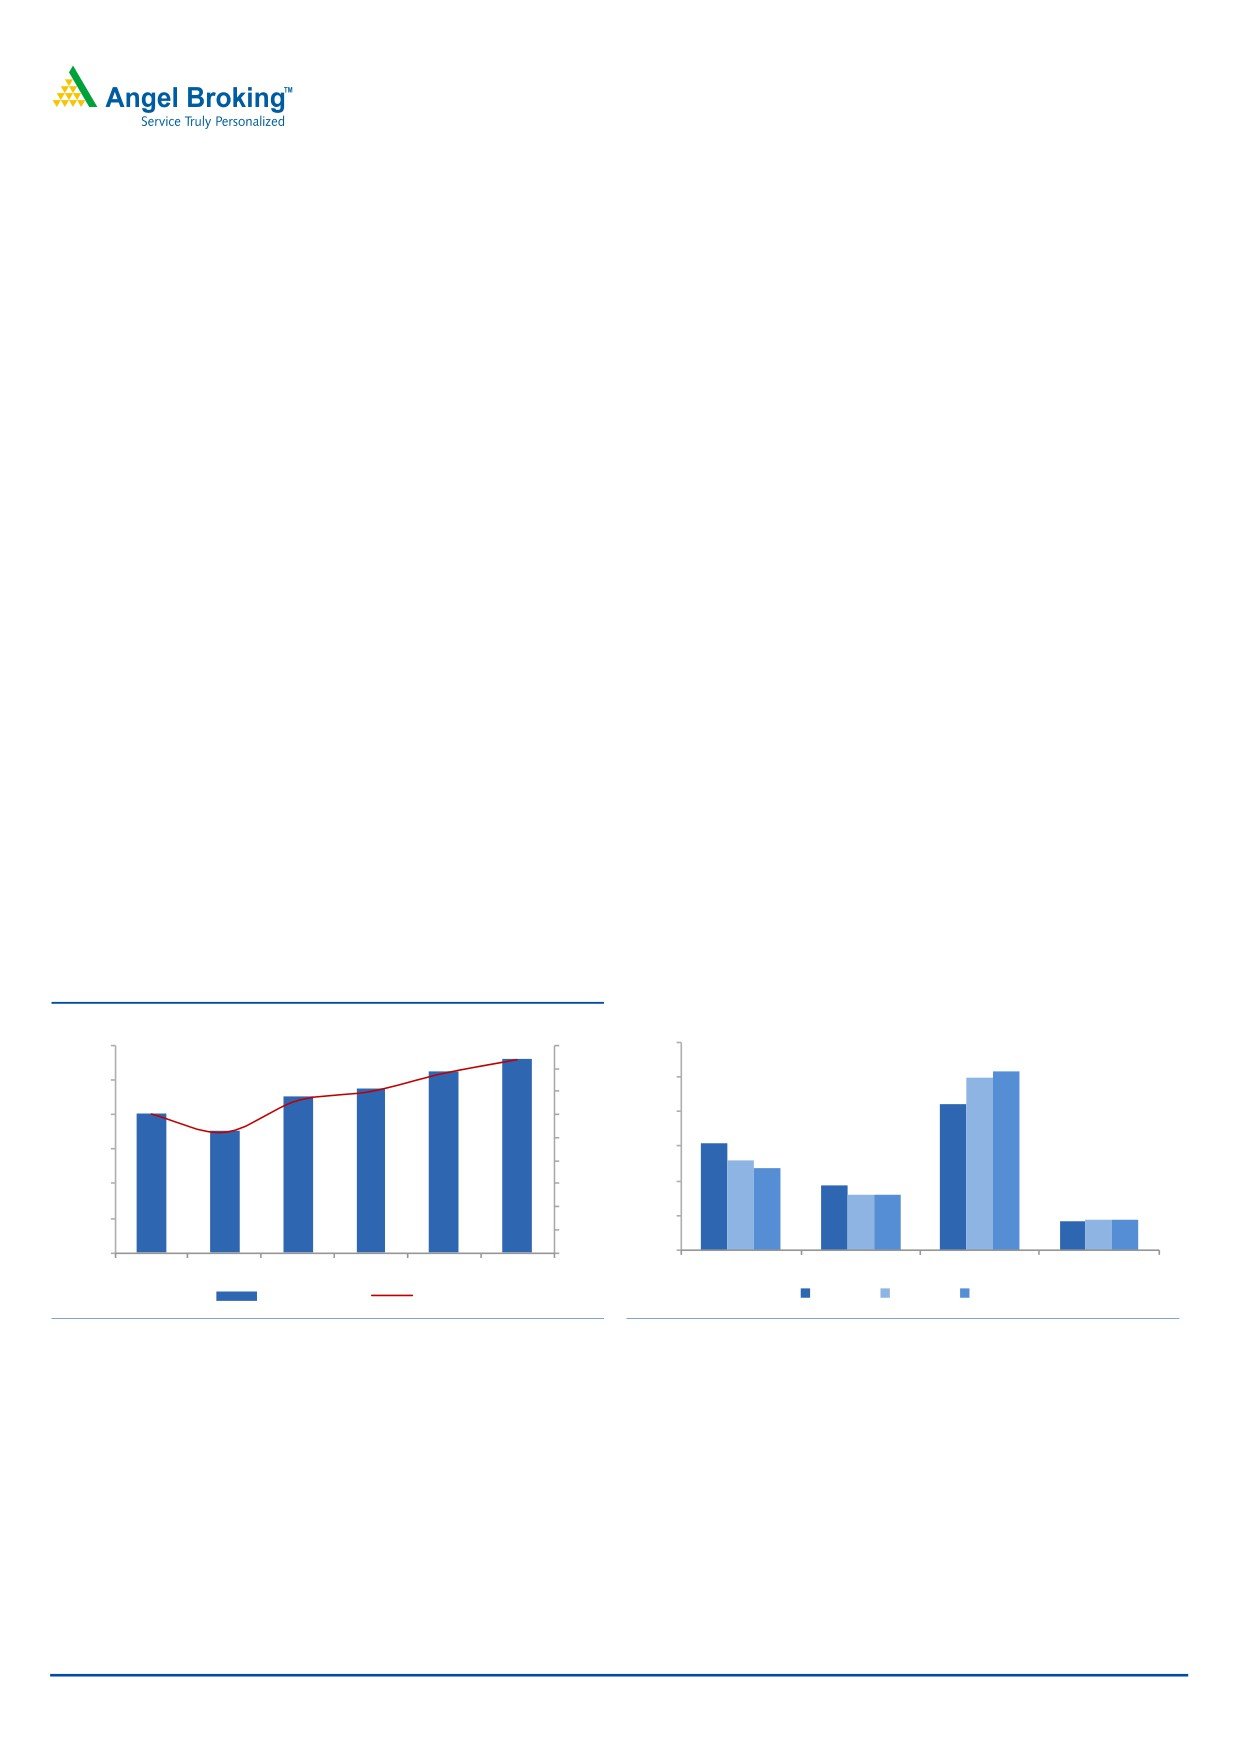
Exhibit 5: SMR - Brief financial summary
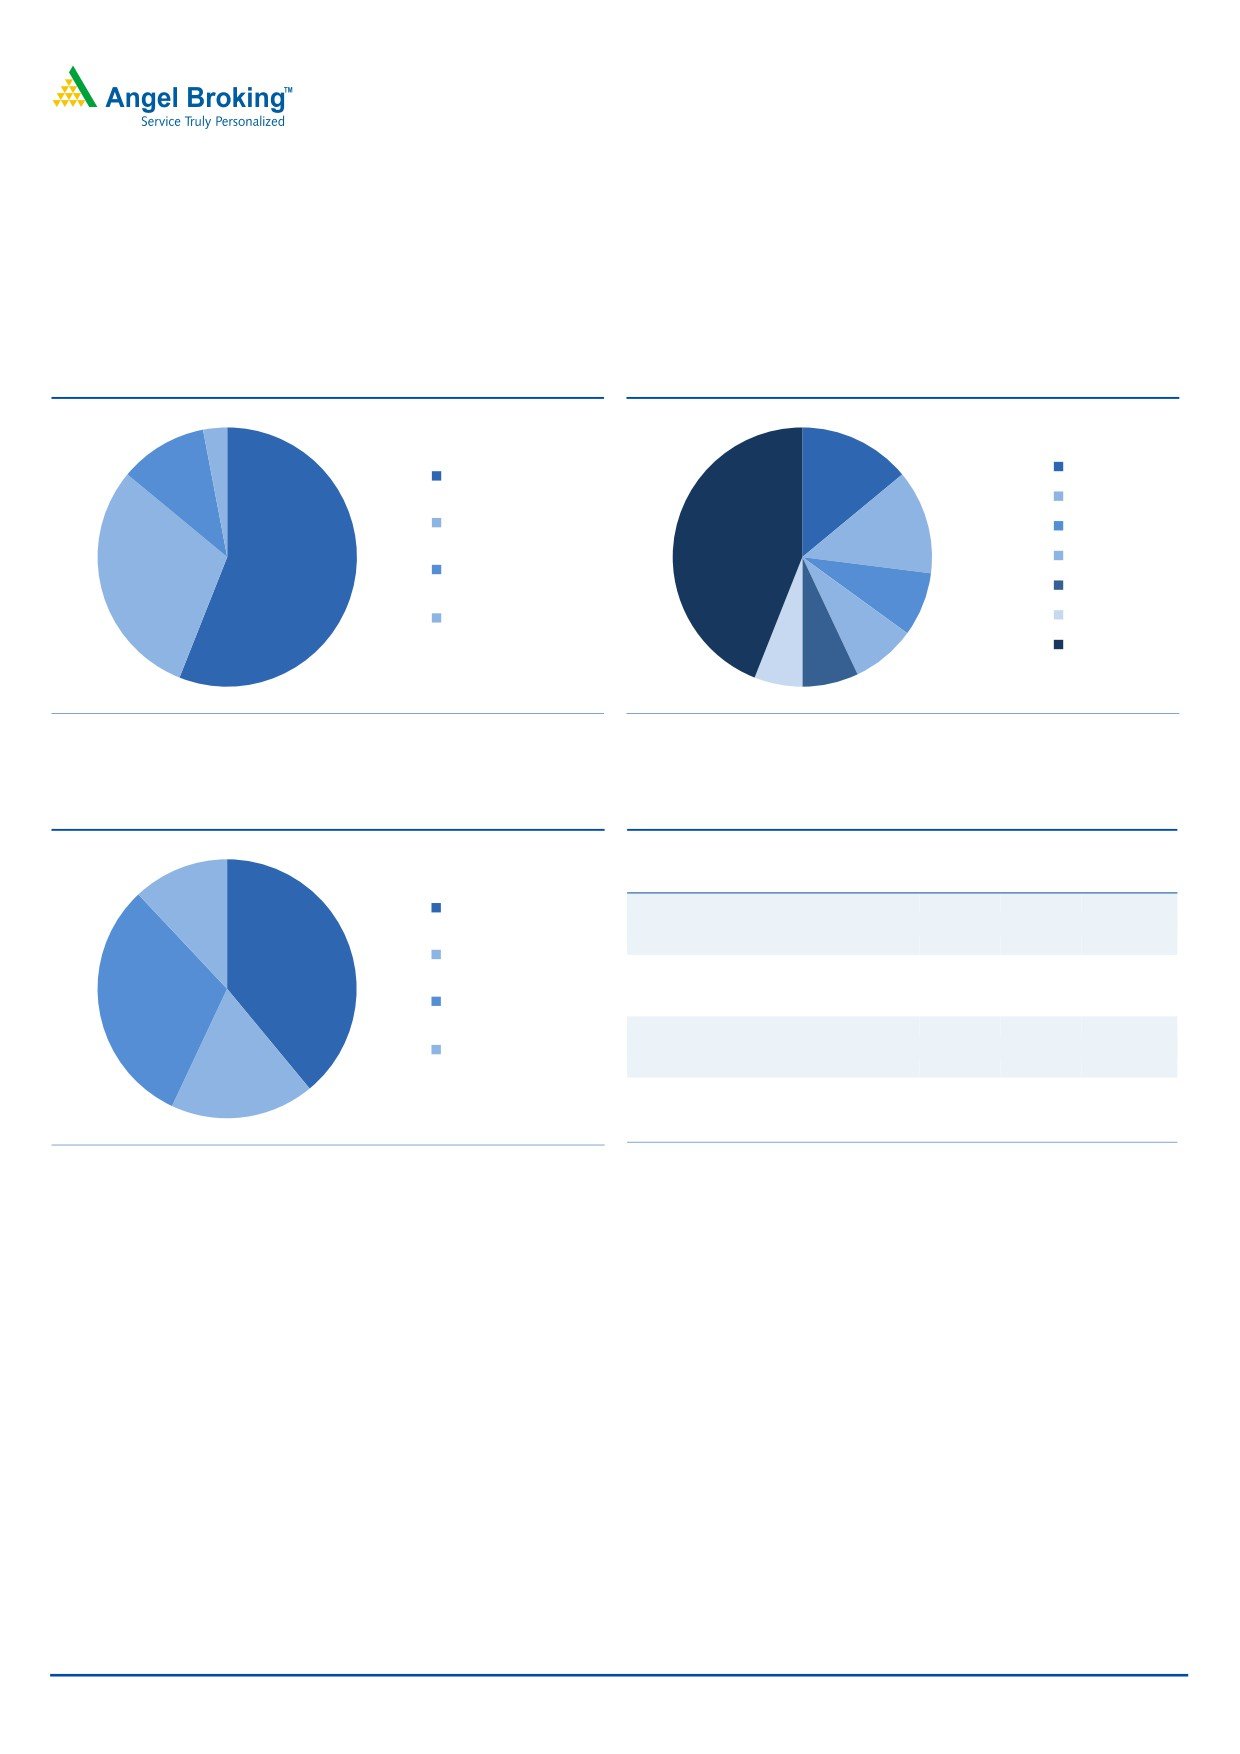
Exhibit 6: SMR - Customer wise sales
(` cr)
FY2010
FY2011
9MFY2012
Hyundai Group
15%
VW
25%
Net sales
4,159
4,547
4,082
GM Group
14%
Renault Nissan
EBITDA
236
314
180
Ford Group
8%
Kia Motors
Ebitda margin (%)
5.7
6.9
4.4
12%
8%
Volvo
Others
9%
9%
PAT
6
48
(6)
Source: Company, Angel Research
Source: Company, Angel Research
SMR is the world’s second-largest exterior rear view mirror manufacturer with a
global market share of ~22% in 2010. The company is the leading player in the
European exterior rear view vision systems market with a market share of ~34%,
and enjoys a leading position in the North America and Asia Pacific regions with a
market share of ~25% and ~17%, respectively. SMFL is also the leading player in
the domestic exterior rear view vision systems market with a 57% market share.
Wiring harnesses business: SMFL operates in the wiring harnesses segment
through Motherson Sumi Systems Ltd (MSSL). MSSL with its technological
partnership with Sumitomo Wiring Systems, Japan (holds 25% in MSSL) is India’s
largest supplier of wire harnesses with 65% of the domestic market share. The
April 30, 2012
4
SMFL | IPO Note
company also has strong global presence in wire harnessing especially in
European two-wheeler and material handling equipment markets. The wiring
harness division contributed ~30% of company’s revenues on a consolidated basis
and registered a growth of 38% and 62% on consolidated and standalone basis
respectively in FY2011.
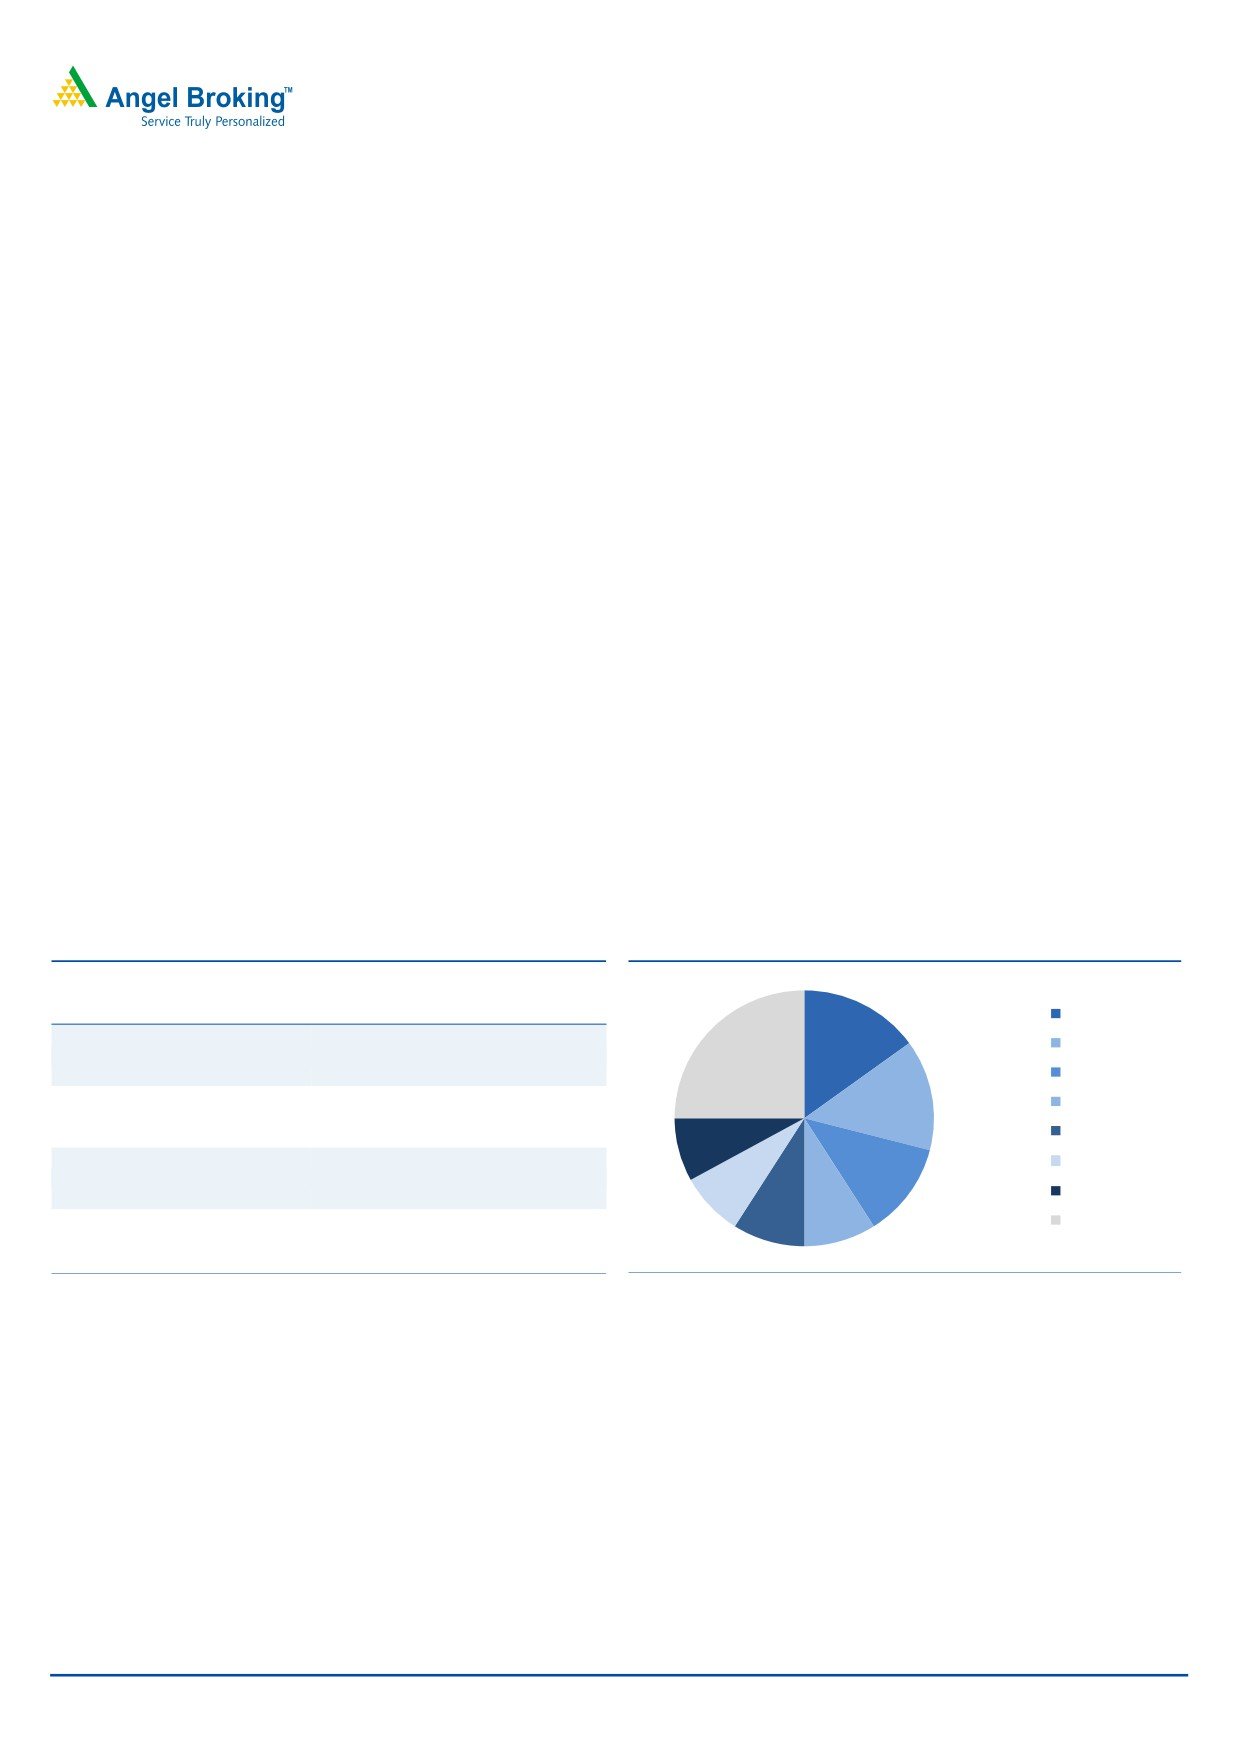
Exhibit 7: MSSL - Segment wise revenue
Exhibit 8: MSSL - Customer wise sales
3%
11%
14%
Maruti Suzuki
Mirrors
Hyundai
Wiring Harness
VW
44%
13%
Ford
Polymer components
30%
56%
Renault Nissan
8%
Rubber/Metal
GM
machined components
8%
Others
6%
7%
Source: Company, Angel Research
Source: Company, Angel Research
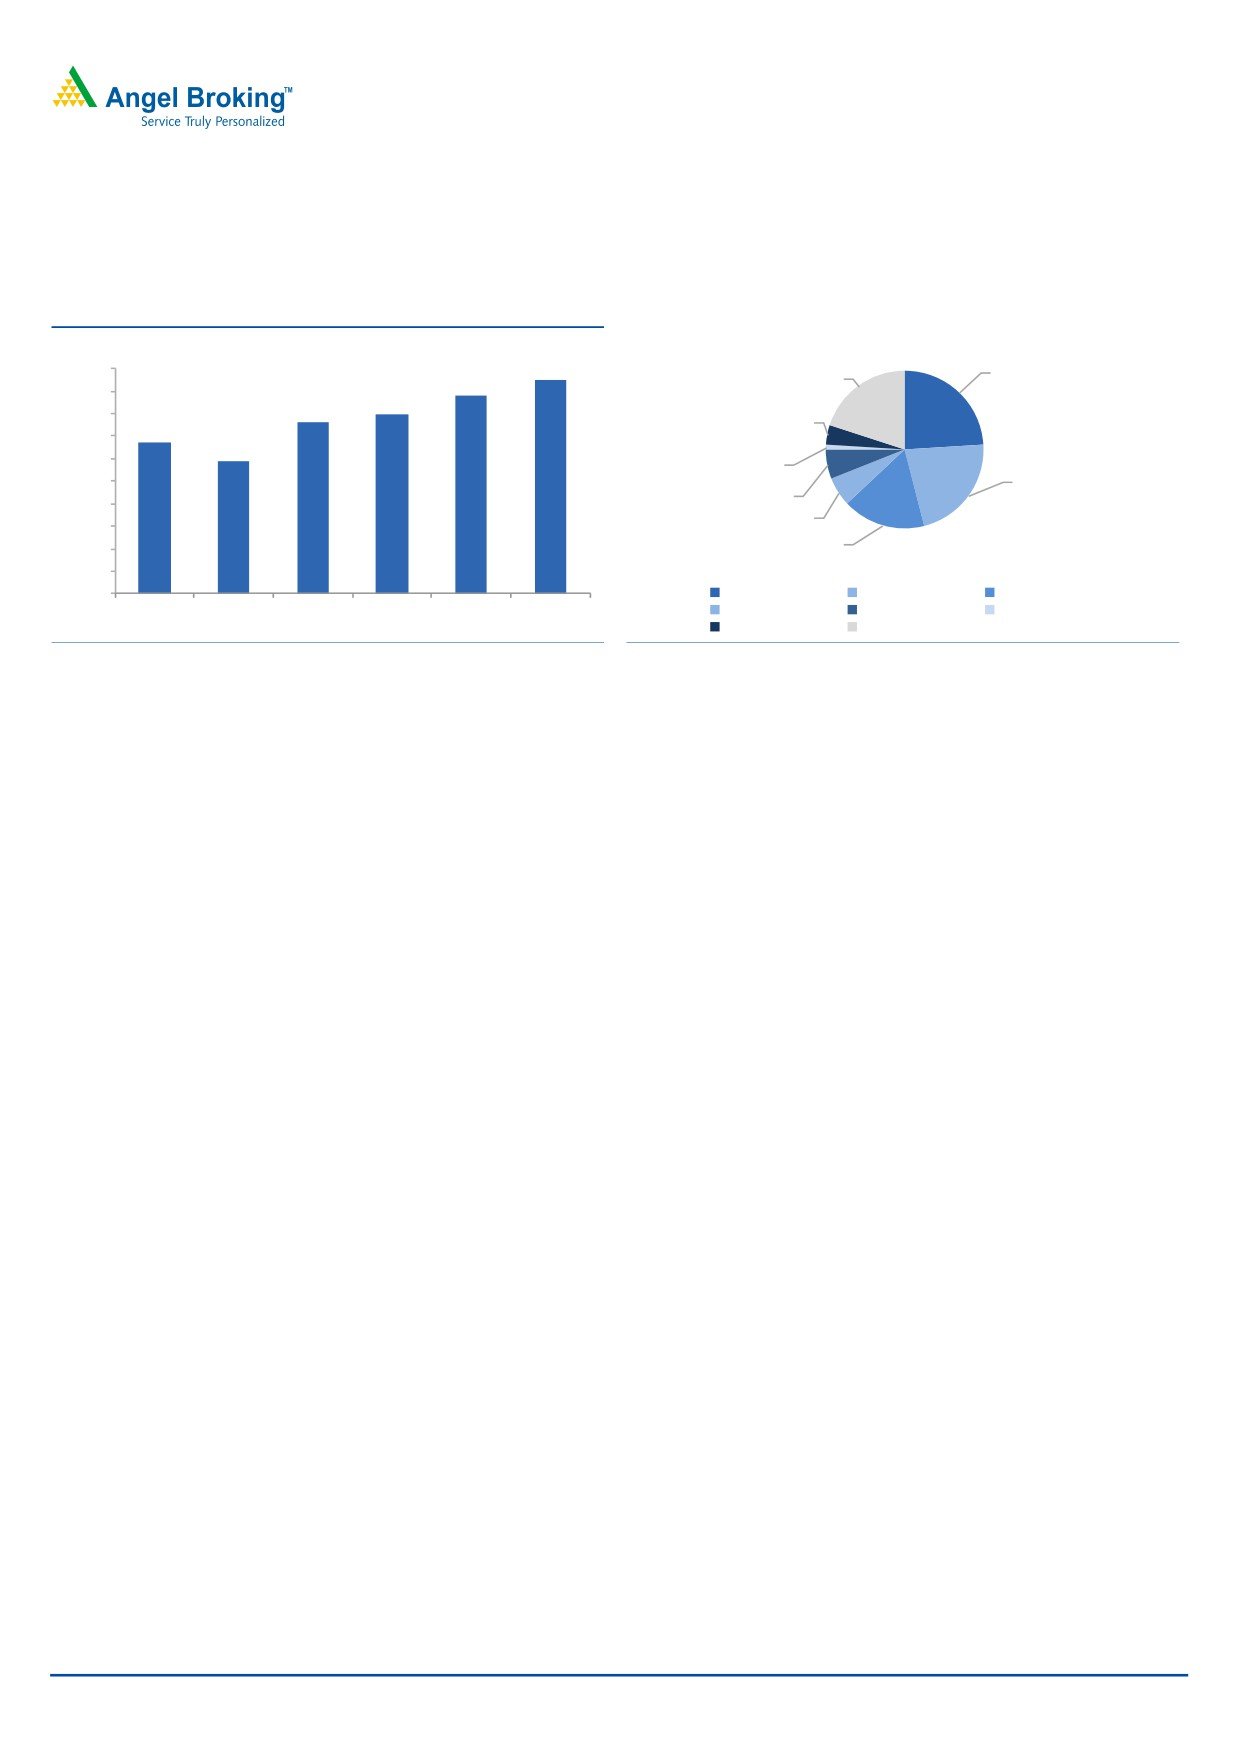
Exhibit 9: MSSL - Geography wise sales
Exhibit 10: MSSL - Brief financial summary
Consolidated (` cr)
FY2010
FY2011
FY2012E
12%
India
Net sales
6,924
8,371
9,830
39%
Australia - Asia Pacific
(excl. India)
EBITDA
549
888
813
31%
Europe
America
Ebitda margin (%)
7.9
10.6
8.3
18%
PAT
243
391
240
Source: Company, Angel Research
Source: Company, Angel Research
MSSL operates over 25 manufacturing facilities and seven design centers for the
wire harness segment. The company has been aggressively expanding its
manufacturing capacity to take advantage of the increased demand from
automotive manufacturers in India and abroad.
Polymer processing and tool manufacturing
SMFL along with MSSL has acquired 80% stake in a Peguform GmbH and
Peguform lberica, SL and 50% stake in Wethje Entwicklungs GmbH and Wethje
Carbon Composite GmbH with from Cross Industries AG to strengthen its
presence in high quality plastic components and assemblies for exterior and
interior trims for passenger vehicles.
Peguform has a strong presence in Europe catering to major German brands. The
company is the second largest supplier of door panels and the third largest
supplier of instrument panels in Germany. The company is also one of the market
leaders of bumpers in Germany and holds a leading position in cockpit assemblies
April 30, 2012
5
SMFL | IPO Note
in Spain. Peguform has 17 production sites and 5 module centers across Europe,
Mexico, Brazil and China. Major customers of the company include the
Volkswagen group (which includes brands such as Volkswagen, Audi, Porsche and
SEAT), Daimler and BMW.
Exhibit 11: Peguform - Geographical revenue-mix
Exhibit 12: Peguform - Customer-mix
2%
5%
5%
Germany
25%
5%
27%
VW
Spain
Audi
China
Seat
Portugal
24%
9%
BMW
59%
Brazil
Others
Mexico
23%
16%
Source: Company, Angel Research
Source: Company, Angel Research
Although Peguform has revenues of EUR1.4bn (CY2010), the EBITDA margins of
the company are lower at ~5% compared to 6.9% for SMR (FY2011) and 7.5% for
the SMFL’s consolidated business. According to the management, some of
Peguform’s plants are operating at significantly higher margins which offer high
scope for margin improvement going ahead. Further
~50% of Peguform’s
revenues are from bought out components translating into ~EUR680mn, of which
~50% is being manufactured across different plants within the Samvardhana
Motherson group. SMFL intends to seize upon the opportunity on offer by cost
effectively sourcing the components from the group companies and improve the
overall operational synergies.
Exhibit 13: Peguform - Brief financial summary
(` cr)
CY2008
CY2009
CY2010 1HCY2011
Net sales
9,749
8,140
8,365
5,119
EBITDA
336
440
400
NA
Ebitda margin (%)
3.4
5.4
4.8
NA
PAT
(477)
(170)
41
(75)
Source: Company, Annual Reports, Angel Research
Joint Venture specialist
Over the years, SMFL has evolved as a JV specialist, having collaborations with
global technology leaders including Sumitomo Wiring Systems Limited, Nachi
Fujikoshi Corporation, Magneti Marelli Holding S.P.A., Calsonic Kansei
Corporation, the Woco Franz Josef Holding GmbH and Woco Industrietechnik
GmbH, Kyungshin Industrial Company Limited, Spheros GmbH, F Holding GmbH,
Austria and Zanotti S.P.A. These long standing relationships give them access to
world-class technology which has helped the company leverage its competencies
in existing areas to create products fulfilling the emerging technical needs of its
customers.
April 30, 2012
6
SMFL | IPO Note
SMFL’s major customers include the five largest automotive OEM manufacturers in
the world, as well as the largest automotive OEM manufacturer in India. Further,
SMFL’s strong ties with its major OEM customers enable it to communicate and
coordinate with them and seek to establish or acquire manufacturing facilities in
areas that they propose to target for growth. The trust and confidence of customers
as also its JV partners has played a pivotal role in the growth of SMFL.
Synergies through horizontal and vertical integration
SMFL has been able to harness synergies through horizontal and vertical
integration across its different product and service segments. For example, wiring
harnesses are used in the manufacture of rear view mirrors, enabling SMR to
source these wiring harnesses from MSSL, while MSSL’s wiring harness
manufacturing activities are supported by the group’s existing polymer processing
and tool manufacturing capabilities. SMFL’s wiring harnesses business produces all
the major components required in-house, ranging from wires to connectors.
These synergies extend across various businesses of the group, enhancing its
ability to become an integrated full-system solutions provider. Further, SMFL is able
to coordinate manufacturing activities across its subsidiaries, joint ventures and
associate companies through its integrated supply chain and inventory
management, engineering, design and information technology functions.
The horizontal and vertical synergies provide SMFL with a significant operational
advantage and helps reduce its dependence on third party suppliers providing
economies of scale. Additionally, SMFL also intends to achieve operational
synergies through the horizontal and vertical integration of the Peguform Group’s
operations and products, by sourcing raw materials from its subsidiaries, Joint
Ventures and other consolidated entities where possible.
April 30, 2012
7
SMFL | IPO Note
Key concerns
Lower global GDP growth may impact operating performance
An external shock in the global economy or recession fears can derail the global
GDP growth, leading to reduced automotive demand. The high share of the
automotive segment to the total consolidated revenues (~94% in FY2011) makes it
highly vulnerable to economic cycles. A slowdown in global economic growth
could lead to a significant decline in revenues at SMR and Peguform.
Dependent on Joint Ventures
The company has entered into several joint ventures to gain access to technology.
As a result significant portion of the company’s revenues are derived from the JV
companies. Any compromise in performance of its JV may adversely affect its
business prospects and therefore the cash flows.
Foreign currency fluctuation risk
As SMFL’s overseas revenue constitutes ~75% of its consolidated revenue there is a
significant risk arising out of currency fluctuation for the company.
April 30, 2012
8
SMFL | IPO Note
Outlook and valuation
SMFL has posted a
123.6% and
63.4% CAGR in revenues and earnings,
respectively over FY2008-11 driven largely by the acquisition of SMR. SMFL is the
market leader in the domestic wiring harness (65% market share) and rear-view
mirror markets (53% market share) and has a 22% share in the global exterior
rear view mirrors segment. Further, acquisition of Peguform is expected to enrich
its product portfolio and consolidate its in-house design, development and tooling
capabilities.
We value SMFL’s 36.1% stake in MSSL based on our target price for the company
(`216 based on 15x FY2014E consolidated earnings). We value SMFL’s stake in
SMR and SMPL on an EV/Sales basis instead of earnings based multiples as
current earnings of these companies’ do not reflect their true potential. Currently
the profitability at SMR and SMPL has been impacted due to significant start up
costs in relation to new manufacturing facilities and due to one-time costs related
to the acquisition and refinancing of Peguform Group. We have assigned EV/Sales
multiple of 0.5x based on our analysis of SMFL’s global as well domestic peers.
Based on our SOTP methodology we arrive at a value of `97/share against the
IPO price band of `113-`118. Management expects to turnaround the financial
performances of SMR and SMPL over the medium term. However, we believe that it
is early to factor in the anticipated turnaround in these two subsidiaries and
valuations in our view are not providing sufficient margin of safety to investors
considering the execution risks involved in the turnaround process. Hence we
recommend Avoid on the issue.
Exhibit 14: SOTP valuation
Equity value
% Value
(` cr)
holding
(` cr)
MSSL (based on 15x FY2014E EPS)
8,370.0
36.1
3,023
SMR (based on EV/Sales of 0.5x FY2012E)
2,251.5
49.0
1,103
SMPL (based on EV/Sales of 0.5x CY2011E)
2,704.7
49.0
1,325
Value of other investments (Book value)
234
Total Equity value
5,686
Holding company discount (%)
20.0
4,549
Net debt post issue (Standalone)
(1,196)
Final value (` cr)
5,745
Value (`/share)
97.0
Source: Company, Angel Research
April 30, 2012
9
SMFL | IPO Note
Exhibit 15: Peer comparison
CMP
Market-cap
P/E
P/B
EV/Sales
(`)
(` cr)
TTM
FY13E
TTM
FY13E
TTM
FY13E
Domestic
Motherson Sumi Systems
179.0
6,934
17.7
21.4
4.3
4.0
1.2
0.8
Bharat Forge
321.5
7,453
25.8
17.7
3.8
3.2
2.0
1.5
International
Magna International*
44.9
10,475
10.4
9.5
1.3
1.2
0.2
0.3
Denso Corp&
2,609.0
2,307
23.5
12.5
1.0
1.0
0.6
0.5
Johnson Controls^
32.3
21,984
12.8
11.9
1.9
1.7
0.7
0.6
Source: Bloomberg, Angel Research; Note: * Calendar year end, CMP in US$, Mcap - US$ mn; & CMP in JPY, Mcap in JPY bn; ^September year end,
CMP in US$, Mcap in US$ mn
April 30, 2012
10
SMFL | IPO Note
Industry Overview
The global automotive components market
The automotive components market is influenced largely by the trends in the global
automotive industry. As with the broader automotive market, the components market
is mature and capital intensive and is characterized by high entry barriers. OEMs
have extremely close working relationships with automotive component vendors as
product development time is in the range of 3-5 years.
The year CY2009 was challenging for all automotive component manufacturers.
Most of the prominent automotive component manufacturers witnessed low capacity
utilization and made losses. The OE automotive components market is expected to
grow at a rate of ~8.2% during the period CY2010 to CY2013E in tandem with the
growth in vehicle production. The overall revenues of the top 50 automotive
component suppliers are expected to reach ~ €472.4bn in CY2013E, which is likely
to account for ~60% of the total automotive components market revenues.
Global OE rear view mirror market
The automotive rear view mirrors industry can be segmented into two main
categories - exterior rear view mirrors and interior rear view mirrors. The key
participants within the overall rear view mirrors market are Magna Mirrors, SMR,
Ficosa, Murakami, Ichikoh and Gentex. While Gentex is strong in the interior mirror
market, all other participants are present in both the exterior and interior rear view
mirrors markets. Magna Mirrors and SMR have strongest presence in the exterior
rear view mirror market while the interior rear view mirror market is dominated by
Magna Mirrors, Ficosa and Gentex.
Exhibit 16: Global OE rear view mirror market
Exhibit 17: OE rear view mirror geographical market trend
(mn
units)
(EUR bn)
(%)
4.2
60.0
300.0
3.9
4.5
51.6
49.6
3.5
4.0
250.0
3.3
50.0
3.0
3.5
41.9
200.0
2.6
3.0
40.0
31.0
2.5
30.0
25.9
150.0
23.5
2.0
18.7
15.916.0
100.0
1.5
20.0
1.0
8.4 8.6 8.9
50.0
10.0
0.5
0.0
0.0
0.0
CY2008
CY2009
CY2010
CY2011
CY2012E CY2013E
European Union North America
Asia Pacific
Rest of World
Total volumes
Total revenues
CY2008
CY2010
CY2013E
Source: RHP, Angel Research
Source: RHP, Angel Research
Exterior OE rear view mirror market
The global sales of OE exterior rear view mirrors for LV increased from ~133.8mn
units in 2008 to ~151.9mn units in 2010 at a CAGR of 6.5%, including a small
percentage around 2-3% of mirror volumes that are typically required as spares or
replacement parts. Global revenues increased from ~€2.2 billion in 2008 to €2.5
billion in 2010, at an average annual rate of 5.2%.
Exterior rear view mirrors are playing an increasingly important role in providing
safety, aesthetics and convenience to a LV. These mirrors incorporate various styling
April 30, 2012
11
SMFL | IPO Note
elements such as high gloss surfaces and LED turn signal lamps. Future innovations
are likely to include additional safety features such as warning lamps of lane change
assist systems.
Exhibit 18: Global exterior rear view mirror volumes
Exhibit 19: Global market share of exterior rear view mirrors
(mn units)
200.0
189.2
24%
176.3
20%
180.0
159.5
151.9
160.0
4%
133.8
140.0
117.9
120.0
1%
100.0
22%
6%
80.0
6%
60.0
17%
40.0
20.0
0.0
Magna Mirrors
SMR
Ficosa
CY2008
CY2009
CY2010
CY2011
CY2012E CY2013E
Murakami
Ichikoh
Honda lock
Metagal
Others
Source: RHP, Angel Research
Source: RHP, Angel Research
There are three major players active in the exterior rear view mirror market. Magna
Mirrors leads the market with a share of ~24.0% (2009: 23%) closely followed by
SMR at ~22.0% (2009: 22%) and Ficosa at ~17.0% (2009: 16%) in 2010. The
market share of SMR for exterior rear view mirrors is ~25% (2009: 25 %) in 2010
when light commercial vehicle segments are excluded.
Interior OE rear view mirror market
Global sales of interior rear view mirrors increased from ~67.5mn units in 2008 to
~74.3mn units in 2010, at a CAGR of 4.9% which was in line with the increase in
global LV production volumes. Global revenues increased from ~€740.1mn in 2008
to ~€865.1mn in 2010 at a CAGR of 8.1% mainly due to an increase in the average
price of interior rear view mirrors. In 2010, APAC had a market share of ~49.6% of
the interior rear view mirror market in volume terms. European Union and North
American respectively had a share of ~25.9% and ~15.9% while ROW contributed
~8.6%.
According to Frost & Sullivan by 2013, the North American market is expected to
remain at ~16.0% of the overall interior rear view mirrors market in volume terms,
Europe’s contribution is likely to settle at ~23.5%, Asia Pacific’s share would increase
to ~51.6% and ROW share is expected to be ~8.9%.
There are six major participants in the global interior rear view mirrors market. These
are Magna Mirrors, SMR, Ficosa, Tokai Rika, Murakami and Gentex. The basic
interior rear view mirror segment is dominated by Magna Mirrors, SMR, and Ficosa.
Magna Mirrors is the market leader with ~60.0% (2009: 54.0%) market share,
followed by SMR with a share of ~10.0% (2009: 12.0%) and Ficosa at an share of
~3.0% (2009: 5.0%) in 2010. The auto-dimming interior rear view mirror market is
dominated by Gentex, which held ~82.0% (2009: 82.0%) share of the global
market in 2010. Magna Mirrors with a market share of ~14.0% (2009: 14.0%) is
the other leading player in this segment.
April 30, 2012
12
SMFL | IPO Note
Indian automotive components market
The domestic automotive components industry consists mostly of unorganized
players, who are largely small and medium enterprises. However, it is the organized
segment that contributes about 72% of the industry’s total revenues.
According to CRISIL Research, the domestic automotive components production is
estimated to have risen by 25% yoy in FY2011 to `1,573bn, led by an improvement
in domestic automobile production. Strong volume growth across segments like cars
and utility vehicles (28%), commercial vehicles (33%), two-wheelers (27%) and
tractors (24%) translated into a 32% yoy growth in sales to OEMs. Further, average
realizations of the industry are estimated to have improved by 3.0-3.5% in FY2011
to partially offset an increase in raw material prices. Capacity utilization for most
automotive components players are also expected to have improved significantly
during the year and some segments also faced capacity constraints during the year.
As per CRISIL Research, domestic automotive component production is set to reach
`3,100 - `3,200bn in FY2016, registering a CAGR of 14-16% over FY2011. This is
expected to be led by a healthy demand from OEMs, especially for cars and utility
vehicles and commercial vehicles, constituting 75-76% of the total demand from
OEMs. Further, an increasing focus on cost-efficiency will lead to international OEMs
sourcing automotive components from low-cost countries like India. CRISIL Research
also anticipates increased utilization of commercially vehicles, shortening
replacement cycles and boosting demand for replacements.
Exhibit 20: Outlook on size of domestic automotive component industry
FY2011
FY2016
Domestic Consumption
Size (` bn)
% of total
Size (` bn)
% of total
OEM
1,131
69.0
2,245
73.4
Replacement
507
31.0
812
26.6
Total Consumption
1,638
3,058
Source: RHP, Angel Research
April 30, 2012
13
SMFL | IPO Note
Profit and Loss Statement (Consolidated)
Y/E March (` cr)
FY2008
FY2009
FY2010
FY2011
YTDFY2012
Net sales
492
828
4,841
5,512
5,862
Other operating income
12
15
73
122
96
Total operating income
504
843
4,914
5,635
5,957
% chg
646.7
67.3
483.0
14.7
5.7
Total expenditure
441
798
4,683
5,213
5,761
Net raw material expenses
274
505
3,044
3,500
3,776
Other manufacturing expenses
102
163
685
743
957
Employee expense
66
130
955
970
1,028
EBITDA
62
45
231
422
197
% chg
589.5
(28.1)
414.1
82.5
(53.3)
(% of total operating income)
12.4
5.3
4.7
7.5
3.3
Depreciation & Amortization
24
37
190
170
168
EBIT
38
8
41
251
28
% chg
518.2
(79.1)
405.5
517.8
(88.7)
(% of total operating income)
7.6
1.0
0.8
4.5
0.5
Interest & other charges
6
21
62
62
129
Other income
11
93
147
82
67
(% of PBT)
24.7
116.3
117.3
30.3
(199.9)
Recurring PBT
43
80
125
271
(34)
% chg
560.9
84.4
56.3
116.5
-
PBT (reported)
43
80
125
271
(34)
Tax
13
12
51
103
95
(% of PBT)
31.0
15.1
40.5
38.1
-
PAT (reported)
30
68
74
168
(129)
Add: Share of earnings of associate
1
1
1
1
1
Less: Minority interest (MI)
(1)
12
6
29
(37)
PAT after MI (reported)
32
57
70
140
(91)
ADJ. PAT
32
57
70
140
(91)
% chg
598.0
76.3
23.6
100.1
-
(% of total operating income)
6.4
6.7
1.4
2.5
(1.5)
Adj. Basic EPS (`)
1.1
1.6
1.3
3.0
(1.9)
Adj. Fully Diluted EPS (`)
1.1
1.6
1.3
3.0
(1.9)
% chg
(81.3)
52.5
(20.5)
130.6
-
April 30, 2012
14
SMFL | IPO Note
Balance Sheet (Consolidated)
Y/E March (` cr)
FY2008 FY2009 FY2010 FY2011 YTDFY2012
SOURCES OF FUNDS
Equity share capital
300
347
540
468
474
Reserves & surplus
283
696
754
1,009
965
Total shareholders’ funds
583
1,043
1,294
1,477
1,439
Minority interest
18
101
158
174
485
Total loans
168
693
868
1,095
3,918
Deferred tax liability
1
12
(4)
(12)
33
Total Liabilities
769
1,849
2,315
2,735
5,875
APPLICATION OF FUNDS
Gross block
663
2,646
3,026
3,381
7,748
Less: Acc. depreciation
95
1,146
1,323
1,531
3,662
Net block
568
1,500
1,703
1,849
4,086
Capital work-in-progress
13
77
122
286
430
Investments
13
55
99
48
109
Current assets
292
1,358
1,511
1,889
4,552
Cash
88
255
255
276
596
Loans & advances
46
298
246
276
554
Other
158
804
1,010
1,338
3,401
Current liabilities and provisions
126
1,150
1,120
1,338
3,306
Net current assets
166
208
390
552
1,245
Mis. exp. not written off
9
9
1
0
5
Total Assets
769
1,849
2,315
2,735
5,875
April 30, 2012
15
SMFL | IPO Note
Cash Flow Statement (Consolidated)
Y/E March (` cr)
FY2008 FY2009 FY2010 FY2011 YTDFY2012
Profit before tax
44
70
127
284
(46)
Depreciation
24
37
190
170
168
Change in working capital
(14)
(63)
(138)
(133)
(65)
Direct taxes paid
(13)
(18)
(74)
(89)
(74)
Others
7
(42)
52
25
207
Cash flow from Operations
49
(16)
158
257
191
Inc./ (Dec.) in fixed assets
(65)
(118)
(277)
(462)
(552)
Inc./ (Dec.) in investments
(3)
(2)
(54)
55
(17)
Others
0
(425)
(187)
(14)
(811)
Cash flow from Investing
(68)
(545)
(518)
(421)
(1,379)
Issue of equity
0
334
148
0
26
Inc./(Dec.) in loans
64
350
260
152
1,256
Dividend paid (incl. tax)
(1)
(2)
(4)
(4)
(9)
Others
9
(29)
(44)
39
70
Cash Flow from Financing
71
653
360
186
1,343
Inc./(Dec.) in cash
52
92
(0)
22
155
Opening cash balance
36
88
255
255
276
Net adjustments
(0)
75
(0)
(1)
165
Closing cash balance
88
255
255
276
596
April 30, 2012
16
SMFL | IPO Note
Key Ratios
Y/E March
FY2008
FY2009
FY2010
FY2011
YTDFY2012
Valuation ratio (x)
P/E (on FDEPS)
105.6
69.3
87.2
37.8
-
P/CEPS
60.4
41.9
23.4
17.1
69.3
P/BV
5.8
3.8
4.7
3.6
3.7
Dividend yield (%)
0.0
0.0
0.0
0.0
0.0
EV/Sales
7.0
5.2
1.4
1.1
1.5
EV/EBITDA
55.4
95.8
28.6
14.4
43.5
EV/Total Assets
4.5
2.3
2.9
2.2
1.5
Per share data (`)
EPS (Basic)
1.1
1.6
1.3
3.0
(1.9)
EPS (fully diluted)
1.1
1.6
1.3
3.0
(1.9)
Cash EPS
1.9
2.7
4.8
6.6
1.6
DPS
0.0
0.0
0.0
0.0
0.0
Book Value
19.4
30.0
24.0
31.5
30.4
Dupont analysis
EBIT margin
7.6
1.0
0.8
4.5
0.5
Tax retention ratio (%)
69.0
84.9
59.5
61.9
383.9
Asset turnover (x)
0.8
0.7
2.7
2.5
1.5
RoIC (Post-tax)
4.1
0.6
1.3
6.9
2.8
Cost of Debt (Post Tax)
2.9
4.2
4.7
3.9
19.8
Leverage (x)
0.1
0.4
0.4
0.5
2.2
Operating RoE
4.2
(0.7)
(0.0)
8.4
(35.0)
Returns (%)
RoCE (Pre-tax)
5.4
0.6
2.0
9.9
0.7
Angel RoIC (Pre-tax)
6.0
0.7
2.4
12.2
0.8
RoE
5.7
7.0
6.0
10.1
(6.3)
Turnover ratios (x)
Asset Turnover (Gross Block)
0.8
0.5
1.7
1.8
1.1
Inventory (days)
44
100
31
36
72
Receivable (days)
55
109
36
40
73
Payable (days)
57
195
62
65
110
Working capital cycle (ex-cash) (days)
51
7
3
13
28
Solvency ratios (x)
Net debt to equity
0.1
0.4
0.4
0.5
2.2
Net debt to EBITDA
1.1
8.5
2.2
1.8
16.3
Interest Coverage (EBIT / Interest)
6.7
0.4
0.7
4.0
0.2
Note: Valued at lower price band of `113
April 30, 2012
17
SMFL | IPO Note
Research Team Tel: 022 - 39357800
DISCLAIMER
This document is solely for the personal information of the recipient, and must not be singularly used as the basis of any investment
decision. Nothing in this document should be construed as investment or financial advice. Each recipient of this document should make
such investigations as they deem necessary to arrive at an independent evaluation of an investment in the securities of the companies
referred to in this document (including the merits and risks involved), and should consult their own advisors to determine the merits and
risks of such an investment.
Angel Broking Limited, its affiliates, directors, its proprietary trading and investment businesses may, from time to time, make
investment decisions that are inconsistent with or contradictory to the recommendations expressed herein. The views contained in this
document are those of the analyst, and the company may or may not subscribe to all the views expressed within.
Reports based on technical and derivative analysis center on studying charts of a stock's price movement, outstanding positions and
trading volume, as opposed to focusing on a company's fundamentals and, as such, may not match with a report on a company's
fundamentals.
The information in this document has been printed on the basis of publicly available information, internal data and other reliable
sources believed to be true, but we do not represent that it is accurate or complete and it should not be relied on as such, as this
document is for general guidance only. Angel Broking Limited or any of its affiliates/ group companies shall not be in any way
responsible for any loss or damage that may arise to any person from any inadvertent error in the information contained in this report.
Angel Broking Limited has not independently verified all the information contained within this document. Accordingly, we cannot testify,
nor make any representation or warranty, express or implied, to the accuracy, contents or data contained within this document. While
Angel Broking Limited endeavours to update on a reasonable basis the information discussed in this material, there may be regulatory,
compliance, or other reasons that prevent us from doing so.
This document is being supplied to you solely for your information, and its contents, information or data may not be reproduced,
redistributed or passed on, directly or indirectly.
Angel Broking Limited and its affiliates may seek to provide or have engaged in providing corporate finance, investment banking or
other advisory services in a merger or specific transaction to the companies referred to in this report, as on the date of this report or in
the past.
Neither Angel Broking Limited, nor its directors, employees or affiliates shall be liable for any loss or damage that may arise from or in
connection with the use of this information.
Note: Please refer to the important `Stock Holding Disclosure' report on the Angel website (Research Section). Also, please refer to the
latest update on respective stocks for the disclosure status in respect of those stocks. Angel Broking Limited and its affiliates may have
investment positions in the stocks recommended in this report.
April 30, 2012
18
SMFL | IPO Note
6th Floor, Ackruti Star, Central Road, MIDC, Andheri (E), Mumbai- 400 093. Tel: (022) 39357800
Research Team
Fundamental:
Sarabjit Kour Nangra
VP-Research, Pharmaceutical
Vaibhav Agrawal
VP-Research, Banking
Bhavesh Chauhan
Sr. Analyst (Metals & Mining)
Sharan Lillaney
Analyst (Mid-cap)
V Srinivasan
Analyst (Cement, Power, FMCG)
Yaresh Kothari
Analyst (Automobile)
Nitin Arora
Analyst (Infra, Cap Goods)
Ankita Somani
Analyst (IT, Telecom)
Varun Varma
Analyst (Banking)
Saurabh Taparia
Analyst (Cement, Power, Media)
Shareen Batatawala
Research Associate
Twinkle Gosar
Research Associate
Tejashwini Kumari
Research Associate
Technicals:
Shardul Kulkarni
Sr. Technical Analyst
Sameet Chavan
Technical Analyst
Sacchitanand Uttekar
Technical Analyst
Derivatives:
Siddarth Bhamre
Head - Derivatives
Institutional Sales Team:
Mayuresh Joshi
VP - Institutional Sales
Hiten Sampat
Sr. A.V.P- Institution sales
Meenakshi Chavan
Dealer
Gaurang Tisani
Dealer
Akshay Shah
Sr. Executive
Production Team:
Simran Kaur
Research Editor
Dilip Patel
Production
Angel Broking Ltd: BSE Sebi Regn No : INB 010996539 / CDSL Regn No: IN - DP - CDSL - 234 - 2004 / PMS Regn Code: PM/INP000001546 Angel Securities Ltd:BSE: INB010994639/INF010994639 NSE: INB230994635/INF230994635 Membership numbers: BSE 028/NSE:09946
Angel Capital & Debt Market Ltd: INB 231279838 / NSE FNO: INF 231279838 / NSE Member code -12798 Angel Commodities Broking (P) Ltd: MCX Member ID: 12685 / FMC Regn No: MCX / TCM / CORP / 0037 NCDEX : Member ID 00220 / FMC Regn No: NCDEX / TCM / CORP / 0302
April 30, 2012
19