Initiating Coverage | Textile
July 11, 2012
S. Kumars Nationwide
BUY
CMP
`34
Changing consumer preferences to drive growth
Target Price
`45
S. Kumars Nationwide Ltd. (SKNL) is one of the leading textile and apparel
Investment Period
12 Months
companies in India catering to various segments ranging from economy to
premium. The company has also extended its presence globally by acquiring
Stock Info
Leggiuno in Italy and Hart Schaffner Marx (HMX) in the U.S. In addition, it has
Sector
Textile
entered an 80:20 JV with Louis Vuitton (LVMH) in U.K., thereby creating a strong
Market Cap (` cr)
1,008
Beta
1.5
portfolio with 45 owned and licensed brands. SKNL has a 74.4% stake in its
52 Week High / Low
60 / 22
subsidiary, Reid & Taylor (valued at `3,514cr in 2008 by GIC), whose IPO, if hits
Avg. Daily Volume
469,551
the market, may prove to be a re-rating trigger for the stock. We initiate coverage
Face Value (`)
10
on SKNL with a Buy recommendation.
BSE Sensex
17,489
Investment rationale
Nifty
5,306
Strong historical growth - Foundation for a stable future: Over the past five years
Reuters Code
SKNL.BO
(FY2008-12), SKNL (consolidated) reported a revenue CAGR of
38.1%,
Bloomberg Code
SKNL IN
substantially higher than its peers. This was mainly on the back of changing
consumer preferences from the unorganized market towards the branded market
Shareholding Pattern (%)
and from textile to ready-to-wear. Further, we expect the company’s revenue to
Promoters
48.6
normalize and post a CAGR of 14.2% over FY2012-14E to `8,290cr.
MF / Banks / Indian Fls
12.0
It’s all about brand show: SKNL follows a strong brand ambassador-led strategy,
FII / NRIs / OCBs
26.2
as part of which its major domestic brands are endorsed by big celebrities
Indian Public / Others
13.2
such as Amitabh Bachchan (Reid & Taylor), Shahrukh Khan (Belmonte) and
Sachin Tendulkar (World Player). In FY2011, the company spent `110cr on
advertisement (including conferences, publicity and business promotion activities). This
Abs.(%)
3m 1yr
3yr
rigorous spending has helped the company in positioning itself as a strong brand. We
Sensex
2.2
(6.0)
30.5
expect the company’s advertising spend to increase to `176cr by FY2014E.
SKNL
0.7
(37.3)
(6.4)
International acquisitions - Long-term growth drivers: With overseas acquisitions
(Leggiuno and HMX) and an 80:20 JV between its wholly owned U.K. subsidiary,
SKNL (U.K.) Ltd., and LVMH group, SKNL has expanded its presence across the
globe, thus creating a strong portfolio of 45 owned and licensed brands. We
expect revenue from the international business to post a CAGR of 14.5% over
FY2012-14E to `1,747cr.
Outlook and valuation
We expect SKNL’s consolidated revenue to post a 14.2% CAGR to `8,290cr and
profit to post a 15.2% CAGR to `524cr over FY2012-14E. We initiate coverage
on SKNL with a Buy rating and an SOTP target price of `45.
SOTP valuation
Value of SKNL's stake in Reid & Taylor (discounted by 70%) (` cr)
784
Expected value of SKNL standalone (target PE of 2x for FY2014E) (` cr)
549
Net value of the company (SKNL standalone + Reid & Taylor) (` cr)
1,334
Existing no. of shares (cr)
30
Expected CMP (`)
45
Source: Company, Angel Research
Key financials (Consolidated)
Sales
OPM PAT EPS RoE P/E P/BV
EV/
EV/
Year
(` cr)
(%)
(` cr)
(`)
(%)
(x)
(x)
Sales (x) EBITDA (x)
Tejashwini Kumari
FY2013E
7,279
21.0
447
15.0
13.7
2.3
0.3
0.7
3.4
022-39357800 Ext: 6856
FY2014E
8,290
21.0
524
17.6
13.9
1.9
0.2
0.7
3.2
Source: Company, Angel Research
Please refer to important disclosures at the end of this report
1
S. Kumars Nationwide | Initiating Coverage
Investment arguments
It’s all about brand show
SKNL, being a multi-brand company, is very clear about differentiating its brands
across segments so that brands do not end up cannibalizing each other.
The company follows a strong brand ambassador-led strategy, as part of
which its major domestic brands are endorsed by big celebrities such as Amitabh
Bachchan, Shahrukh Khan and Sachin Tendulkar.
Exhibit 1: Strong brand show
Brand
Ambassador
Reid & Taylor
Amitabh Bachchan
Belmonte
Shahrukh Khan
World Player
Sachin Tendulkar
Source: Company, Angel Research
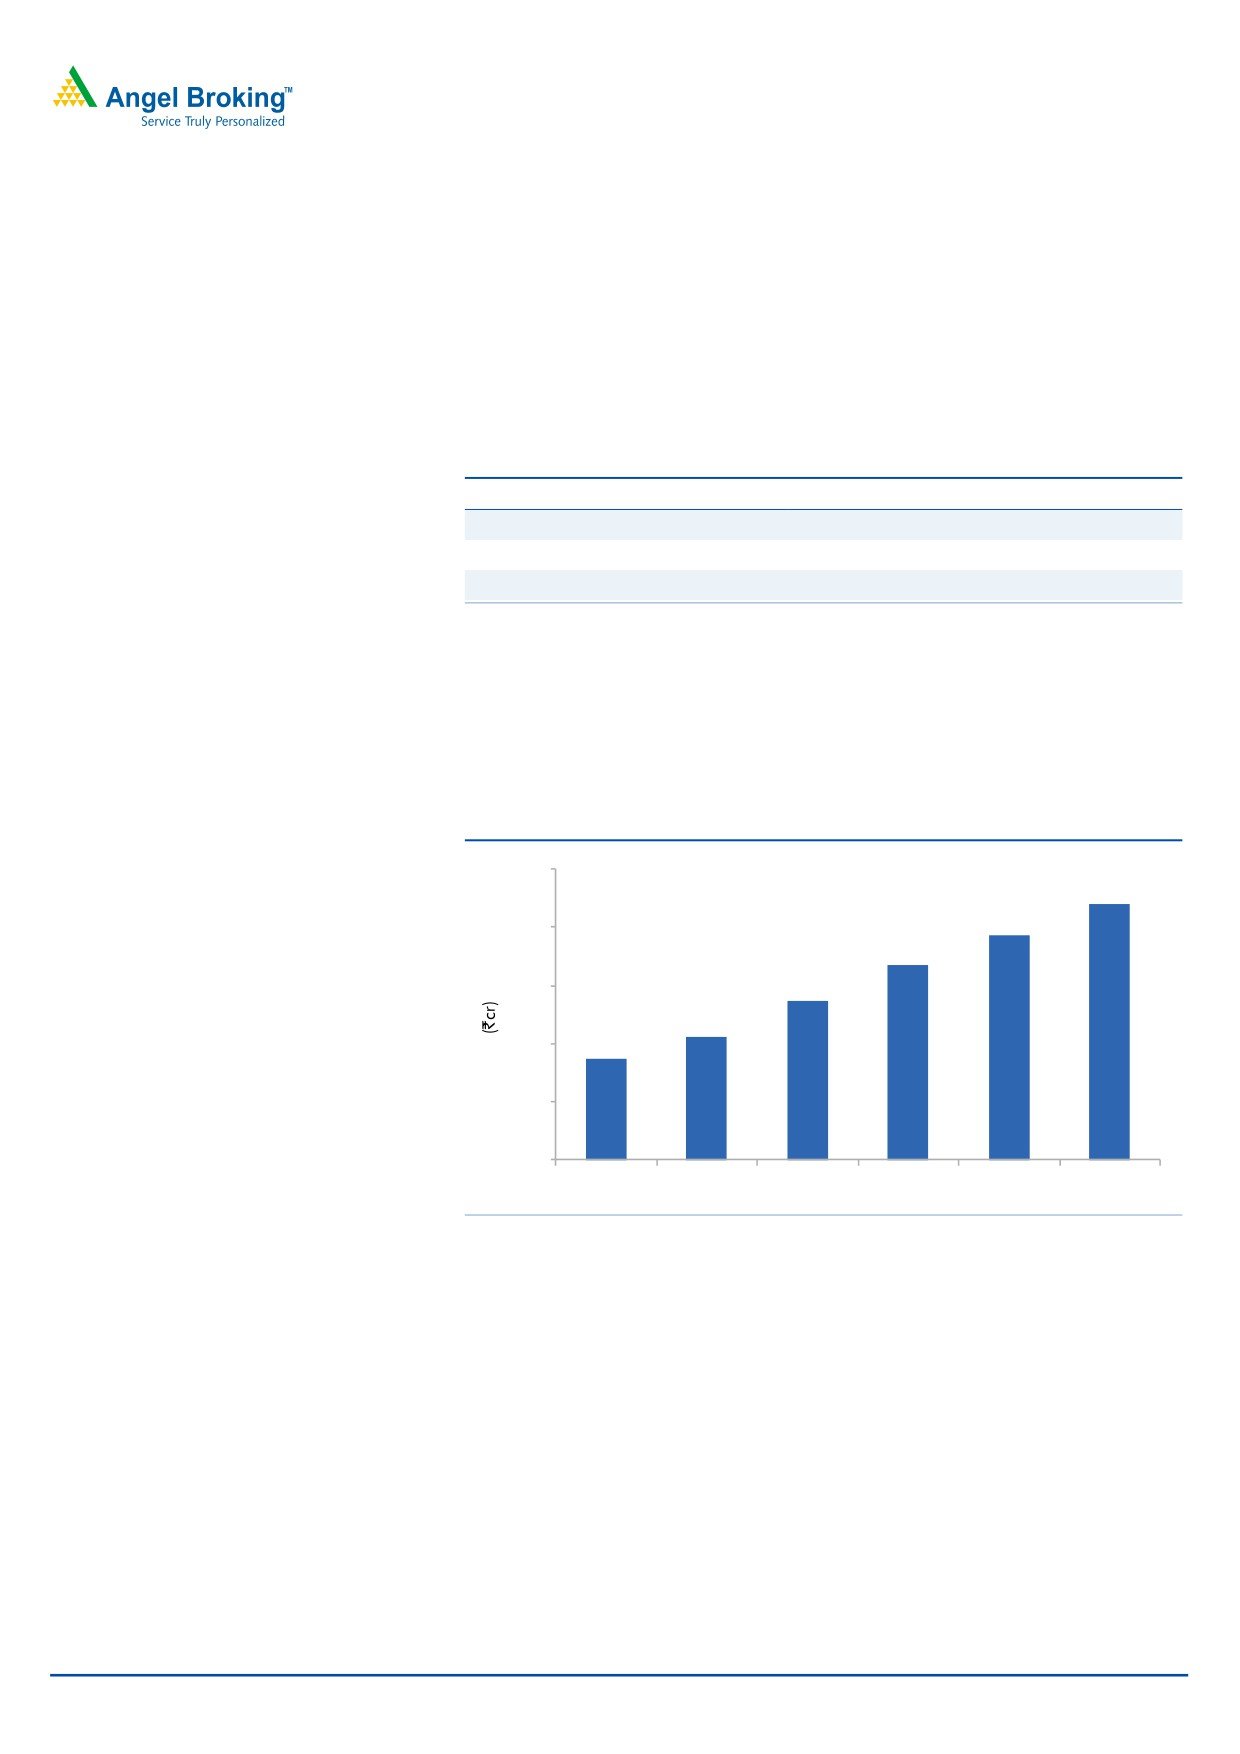
The company has been spending rigorously on advertising for the recognition of its
brands. In FY2011, the company spent `110cr on advertisement (including
conferences, publicity and business promotion activities). This rigorous spending
has helped the company in positioning itself as a strong brand. We expect the
company’s advertising spend to increase to `176cr by FY2014E.
Exhibit 2: Rigorous ad spend for strong brand positioning
200
176
154
160
135
120
110
85
80
70
40
0
FY2009
FY2010
FY2011
FY2012E FY2013E FY2014E
Source: Company, Angel Research, Note: Ad spend includes publicity and promotional activities
The company is also gearing up for the launch of its premium casual brand,
Kruger, which is expected to be in a price band of `999-4,999, competing with
brands such as Tommy Hilfiger (Arvind Ltd. JV) and ColorPlus (Raymond).
International acquisitions - Long-term growth drivers
SKNL extended its presence overseas to European and North American markets by
expanding its brand portfolio to 45 leading brands, catering to various price
points. SKNL acquired Leggiuno in Italy (October 2008) and HMX in the U.S. (May
2009). The company has also signed an 80:20 JV between its wholly owned U.K.
subsidiary, SKNL (U.K.) Ltd., and Louis Vuitton (LVMH) group for the global
menswear license for DKNY brand.
July 11, 2012
2
S. Kumars Nationwide | Initiating Coverage
Acquisition of Leggiuno was a strategic move by SKNL to provide its domestically
produced HVFC fabric an access to leading international brands in the high-end
market along with better sales price realization and higher margins through
Leggiuno, which is a manufacturer of HVFC fabrics. The Indian HVFC plant
currently caters to 30-35% of Leggiuno’s high-value fabric requirement and aims
at supplying 50% in the near future.
HMX is the largest men’s formal wear clothing company in the U.S. and a leading
American producer of luxury apparel. The company is the largest manufacturer
and marketer of men’s suits and coats in the U.S. The company’s brands include
HMX, Hickey Freeman, Misook, Coppley, Austin Reed, Claiborne and Pierre Cardin,
among others. HMX has a broad distribution network of speciality and leading
department stores, value-oriented retailers and direct mail catalogues.
The JV between SKNL’s wholly owned U.K. subsidiary SKNL (U.K.) Ltd. and (80%)
DKNY (20%) gives SKNL the right to design, manufacture/outsource and wholesale
the brand across the globe (except Japan). It also allows SKNL to open its own
retail outlets in countries where there is no existing retail partner.
Exhibit 3: International brands across segments
Segment
Brands
Luxury
Hickey Freeman, Leggiuno
Accessible luxury
HMX, Bobby Jones, JAG Jeans, Exclusively Misook, Coppley, Monarchy
Moderate
Jack Nicklaus Golf, Pierre Cardin, Palm Beach, Sansabelt
Source: Company, Angel Research
All these acquisitions along with the JV were strategic steps taken by SKNL at the
right time, which helped SKNL to get them at a lower cost. With these acquisitions,
SKNL has an access to the global distribution network, which helps it in catering to
customers in the U.S. and Europe. So far, SKNL has been successful in turning
around the business by discontinuing brands that were not able to sustain on their
own. Currently, only HMX, Misook and Hickey Freeman are manufactured in the
U.S. and the remaining are outsourced. Also, SKNL has successfully lowered its
selling and administration expenses for international businesses from US$150mn
at the time of acquisition to US$90mn currently. In FY2012, revenue from the
international business stood at `1,334cr, with EBITDA margin at 4.7%. We expect
revenue from the international business to post a 14.5% CAGR over FY2012-14E
to `1,747cr.
Reid & Taylor IPO - A potential re-rating trigger
SKNL had filed Draft Red Herring Prospectus (DRHP) with SEBI on December 9,
2010, for the listing of Reid & Taylor (74.4% subsidiary) for an expected issue size
of ~`1,000cr. However, the IPO for the same didn’t materialized due to the
unfavorable and volatile market. If going forward, the IPO hits the market; we
expect it to command a premium over SKNL’s valuation because of its strong
brand name, supported by healthy financial and operational efficiency.
July 11, 2012
3
S. Kumars Nationwide | Initiating Coverage
Well-diversified portfolio
SKNL deals in branded products across various price segments, ranging from the
mass level to premium category. The company’s product portfolio ranges from
fabric to ready-to-wear. SKNL is also present in the home textile segment. This
positioning allows the company to capitalize on the consumption patterns of all
segments domestically. In addition, with its overseas acquisitions, the company is
expanding its presence across the globe. The company has a strong brand
portfolio of 45 owned and licensed brands, such as Reid & Taylor, Belmonte,
S Kumars and Carmichael House and international names such as HMX, Hickey
Freeman, Exclusively Misook, Austin Reed, Jag Jeans, Bobby Jones and DKNY.
Exhibit 4: SKNL's diversified portfolio is present across all segments
Fabric
Home textile
Ready-to-wear
Premium
Reid & Taylor/ Baruche Carmichael House Reid & Taylor/ Kruger
Mid-price
Belmonte
-
Belmonte
Economy
S Kumars
-
World Player
Source: Company
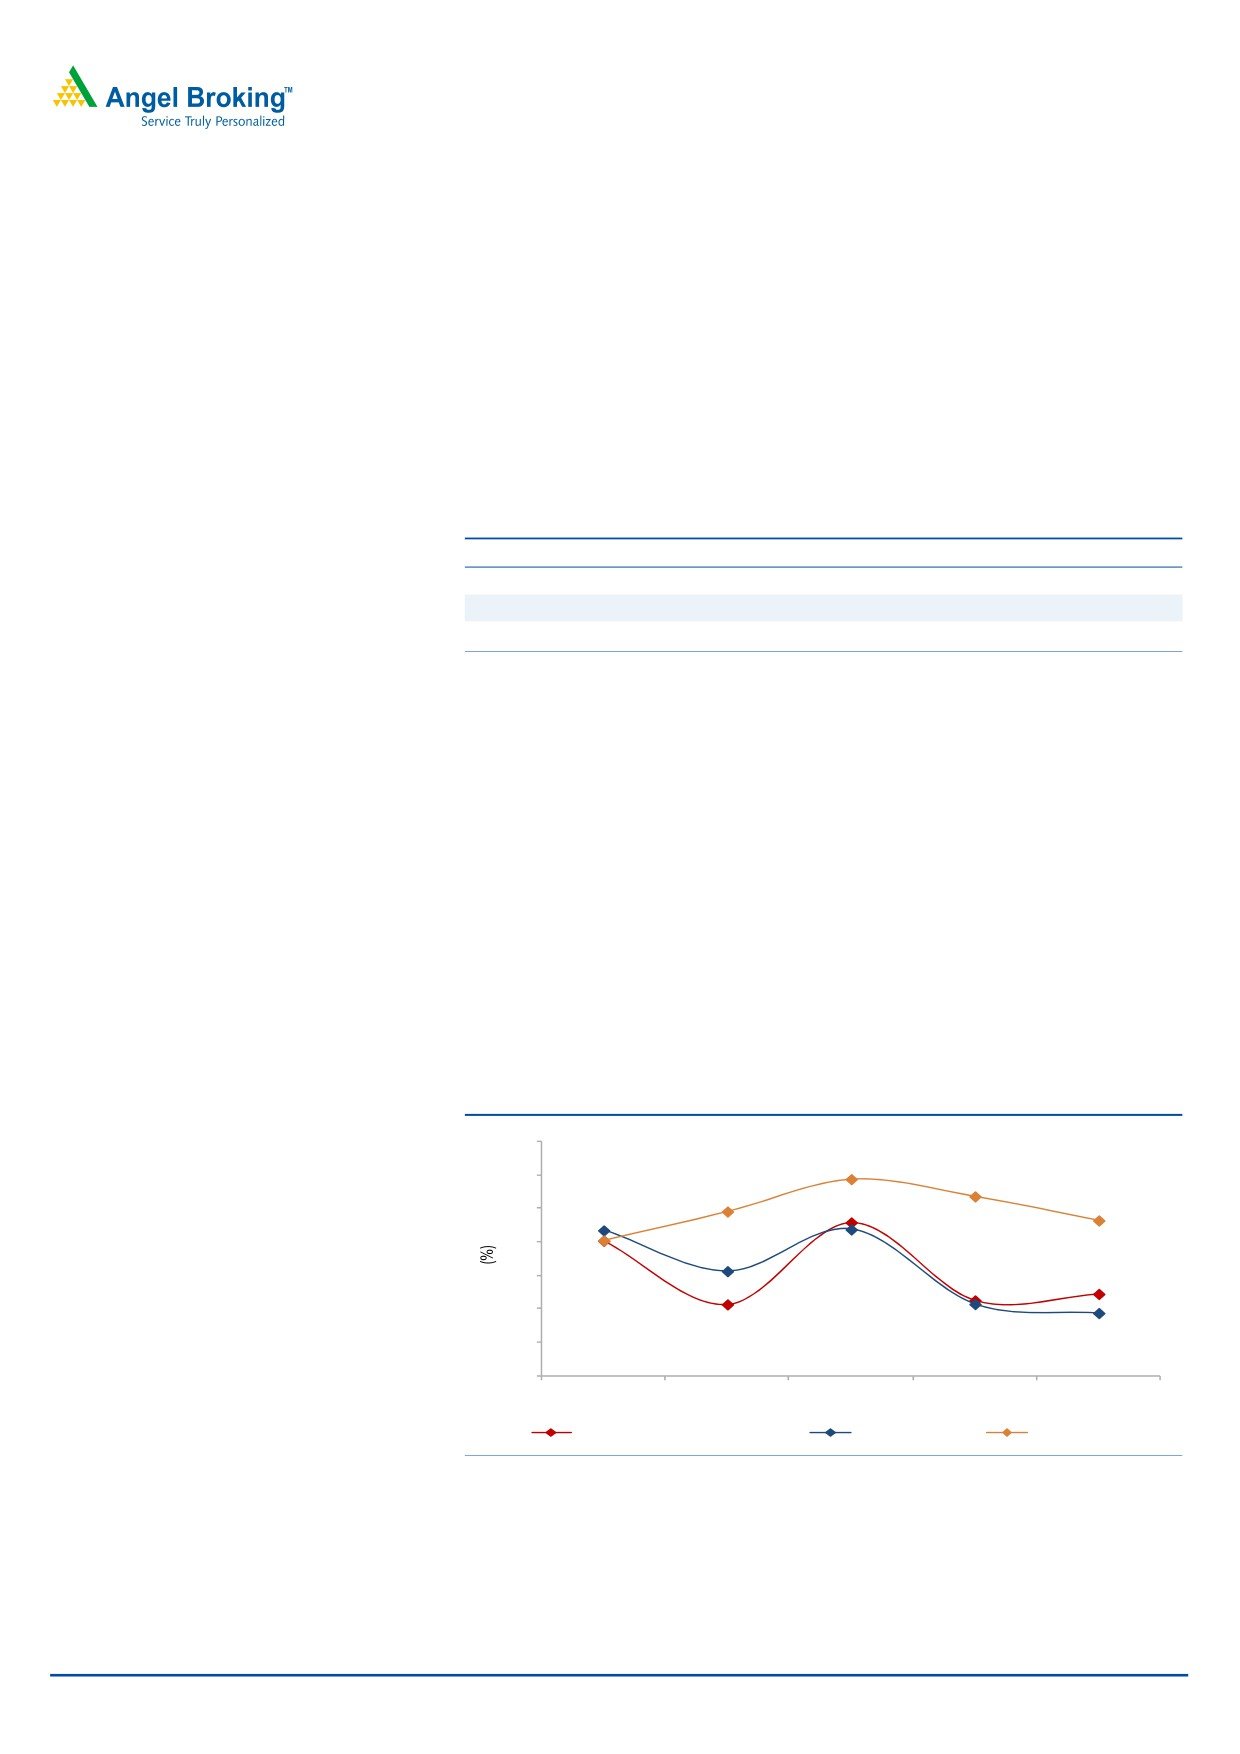
Strong historical growth - Foundation for a stable future
Over the past five years (FY2008-12), SKNL (consolidated) has posted a revenue
CAGR of 38.1%, substantially higher than its peers. This was mainly on the back of
changing consumer preferences from the unorganized market towards the
branded market and from textile to ready-to-wear. This shift is providing a major
opportunity (in terms of increasing penetration) to players in the textile industry.
The consumer textile/Belmonte division, a major contributor to the company’s
revenue, witnessed a 28.2% CAGR over FY2008-12. For the same period, the
luxury textile segment posted a 28.5% CAGR and ready-to-wear posted a 51.9%
CAGR. Going forward, we expect growth to normalize with consumer textile, luxury
textile and ready-to-war segments posting a revenue CAGR of 12.9%, 13.7% and
15.6%, respectively, over FY2012-14E.
Exhibit 5: Segmental growth
70
60
50
46
40
30
24
20
19
10
0
FY2008
FY2009
FY2010
FY2011
FY2012
Consumer Textiles/Belmonte
Luxury Textiles
Ready to wear
Source: Company, Angel Research
We expect the company’s revenue to normalize and post a CAGR of 14.2% over
FY2012-14E to `8,290cr, aided by changing consumer preferences and the
company’s strong brand positioning. Also, SKNL has maintained its EBITDA margin
at 19.5-22.5% from FY2008 to FY2012. Going ahead, we factor in the same kind of
consistent performance on the margin front and expect it to be 21.0% in FY2014E.
July 11, 2012
4
S. Kumars Nationwide | Initiating Coverage
Conversion of warrants at premium demonstrates confidence
The promoter group company, Sansar Exim Private Limited, which held
1,24,25,000 numbers of equity share warrants allotted on preferential basis issued
on 15th June, 2010 converted the warrants into equity shares at `63.5, at a
premium of
109% from the market price
(`30.4) on
13th Dec,2011, thus
increasing the promoter’s stake by 1.7% yoy in FY2012. This is a positive signal for
investors, as it demonstrates the confidence of promoters in the company’s future
growth outlook.
July 11, 2012
5
S. Kumars Nationwide | Initiating Coverage
Financials
SKNL’s financials (Standalone)
Exhibit 6: Key assumptions
2013E
2014E
Average volume growth (%)
10.2
10.2
Average realization growth (%)
4.1
3.9
Source: Company, Angel Research
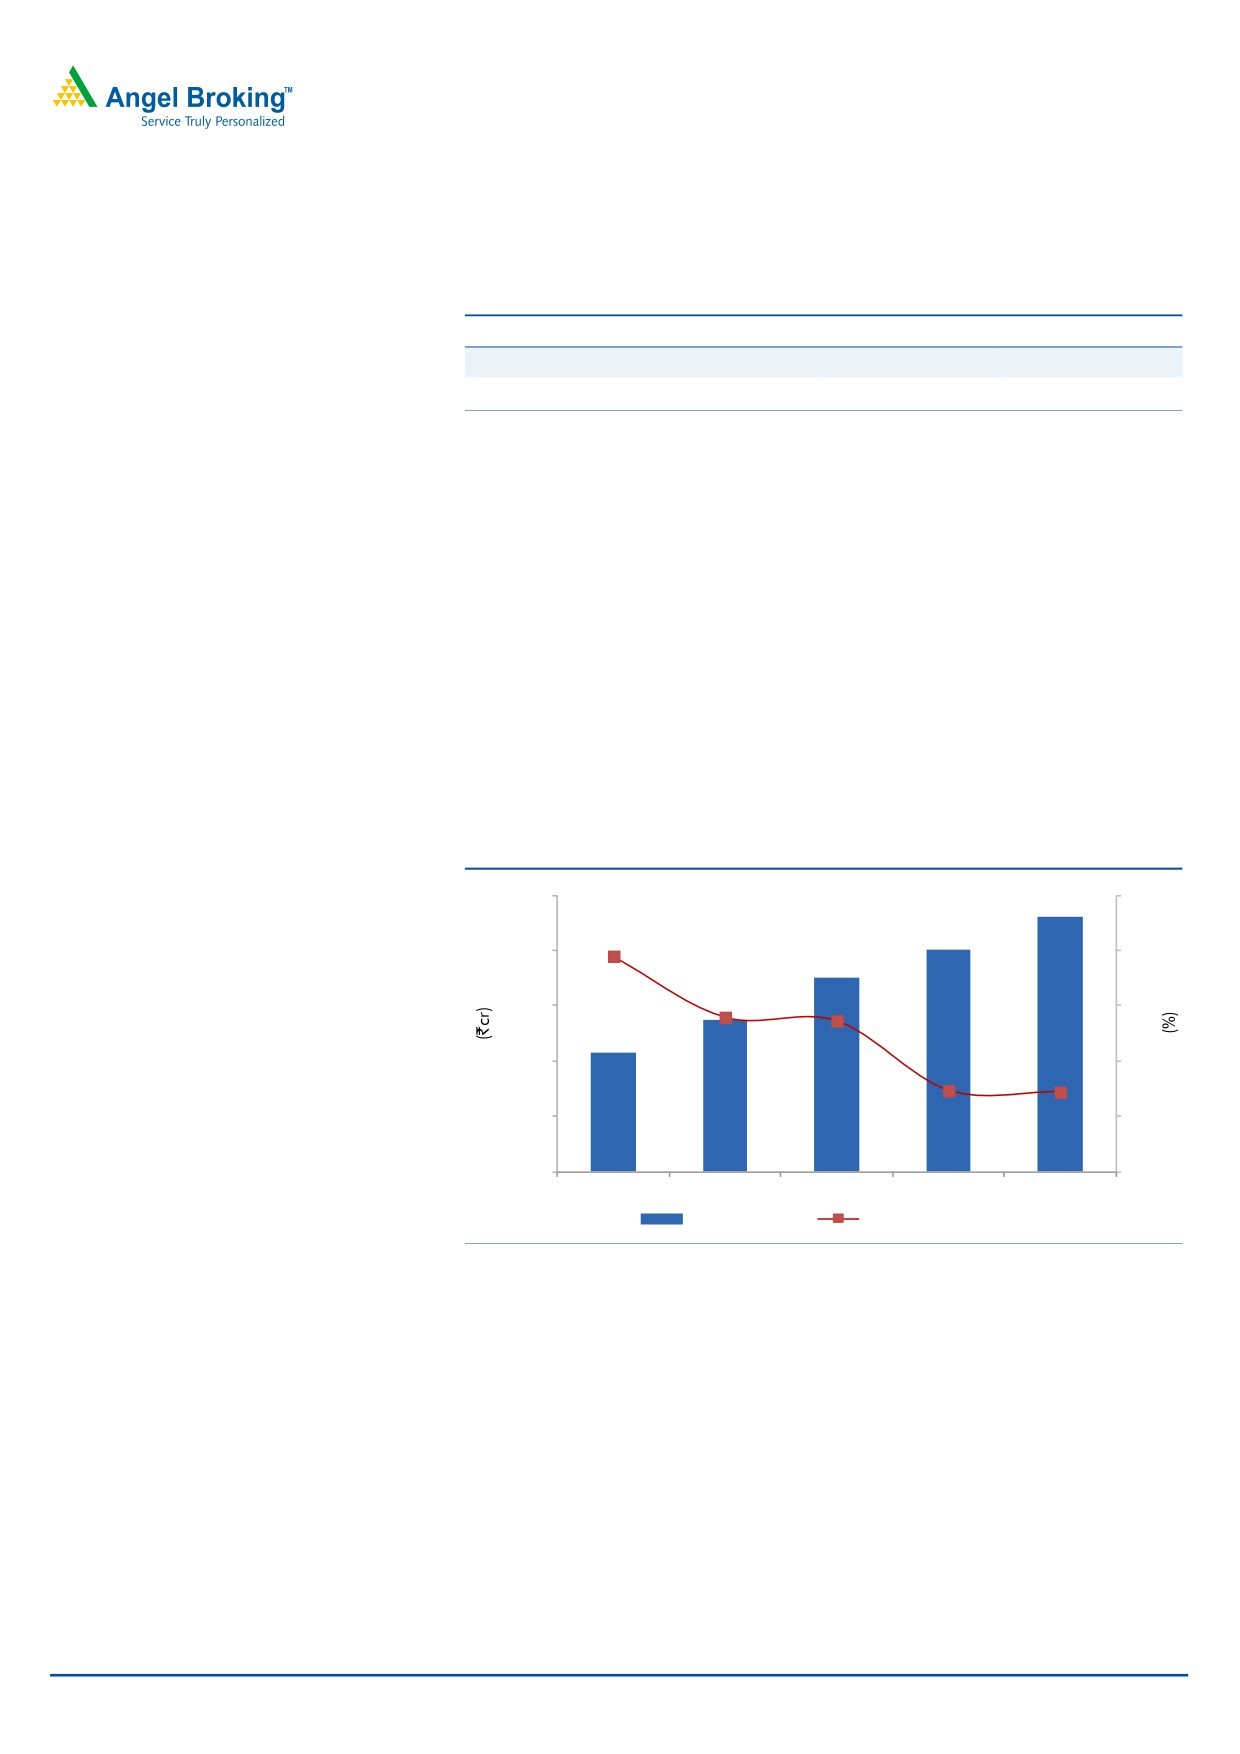
Demand for branded fabrics and readymade garments to drive revenue
We expect demand for branded fabrics and apparels to grow in future,
as consumers’ preference has shifted from the unorganized market towards the
branded market and from textile to ready-to-wear. Also the company’s strong
brand positioning and its strategically planned growth strategy, which includes -
1) rollout of additional exclusive brand outlets for Reid & Taylor (~160 stores),
Kruger and Belmonte to expand their distribution and franchisee networks,
2) set up a shirts factory to improve margins by offering readymade products,
3) scale up capacity utilization at BSFC and 4) capacity expansion in the luxury and
mid-premium textile segments, are expected to be the company’s growth drivers.
We expect SKNL’s (standalone) revenue to normalize and post a decent CAGR of
14.6% over FY2012-14E from `3,511cr in FY2012 to `4,609cr in FY2014E.
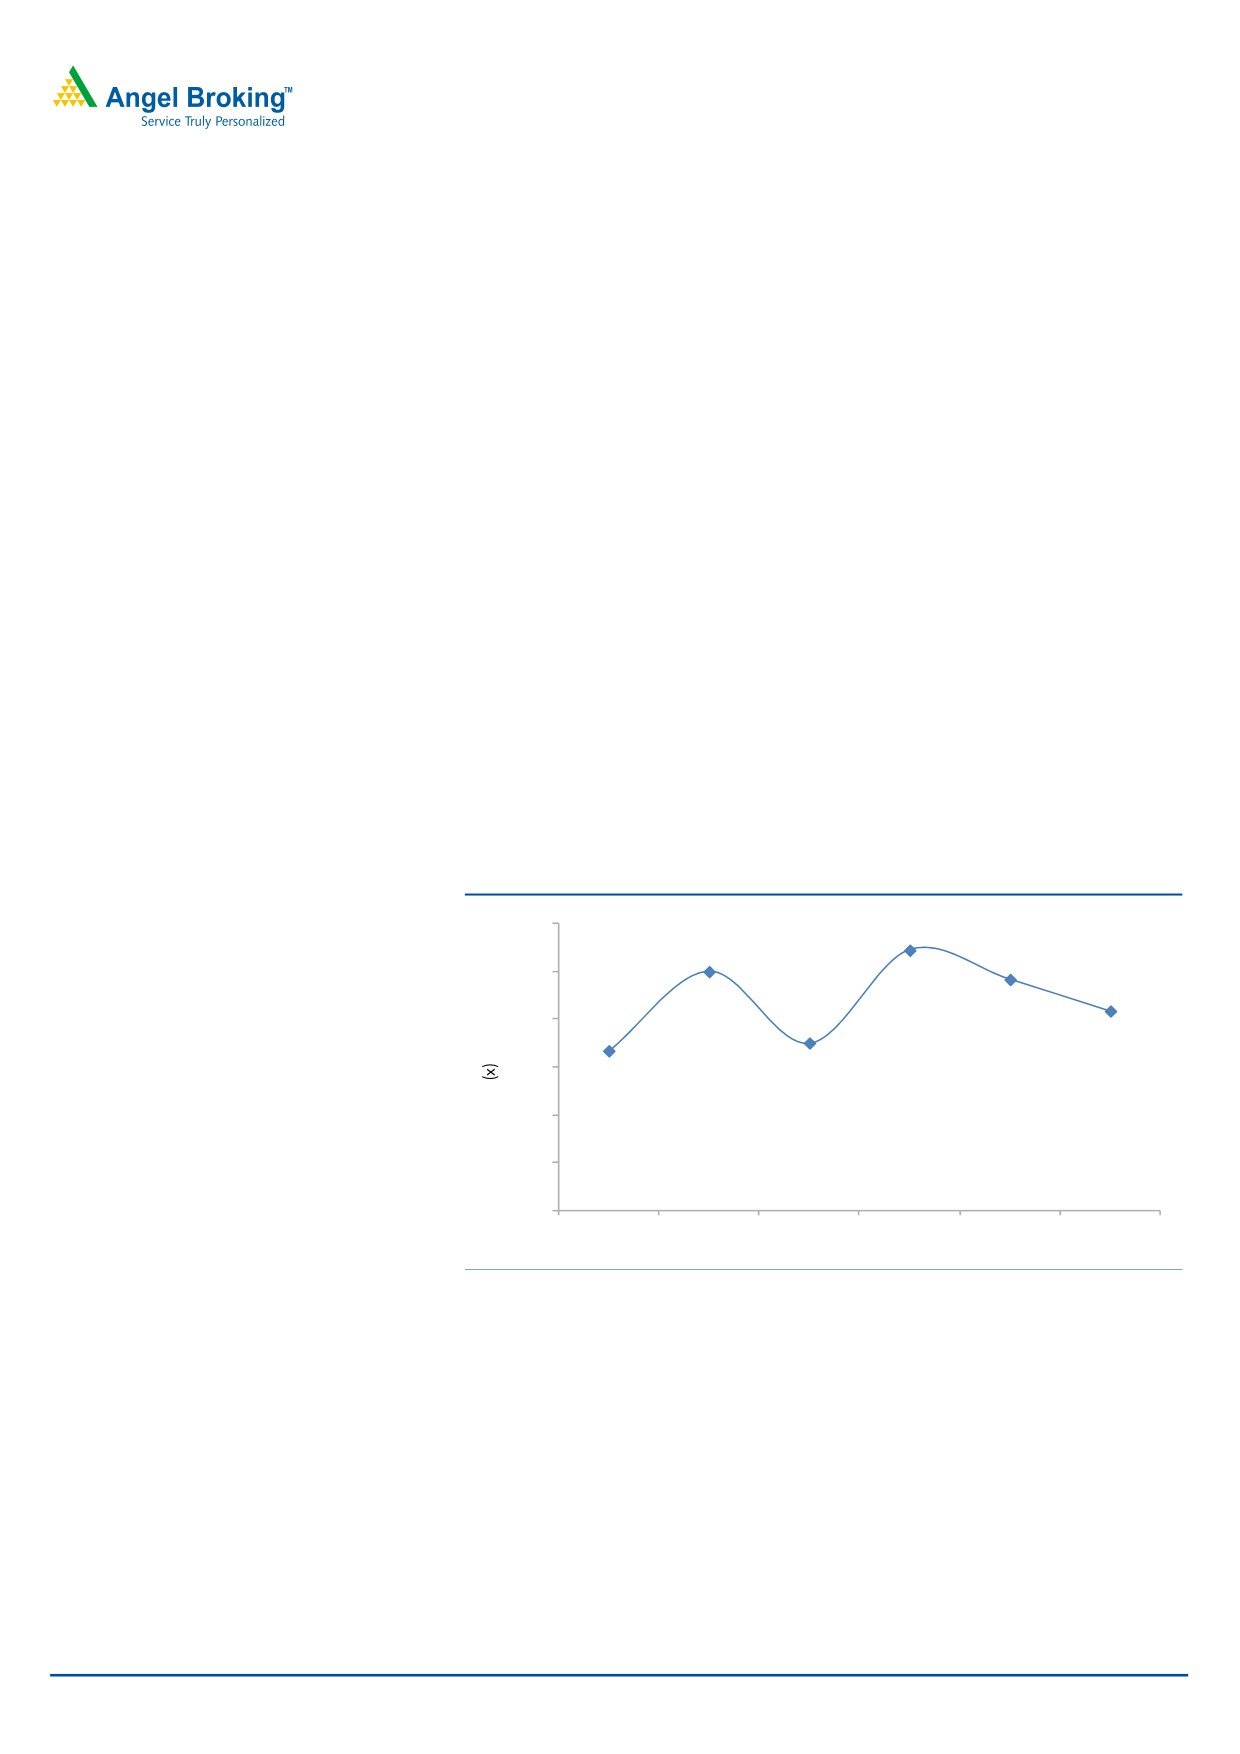
Exhibit 7: Changing consumer preferences and growth strategies to drive revenue
5,000
4,609
50
4,027
4,000
40
39.0
3,511
3,000
2,757
30
2,155
28.0
27.3
2,000
14.7
20
1,000
14.5
10
-
0
FY2010
FY2011
FY2012
FY2013E
FY2014E
Revenue (LHS)
Revenue growth (RHS)
Source: Company, Angel Research
July 11, 2012
6
S. Kumars Nationwide | Initiating Coverage
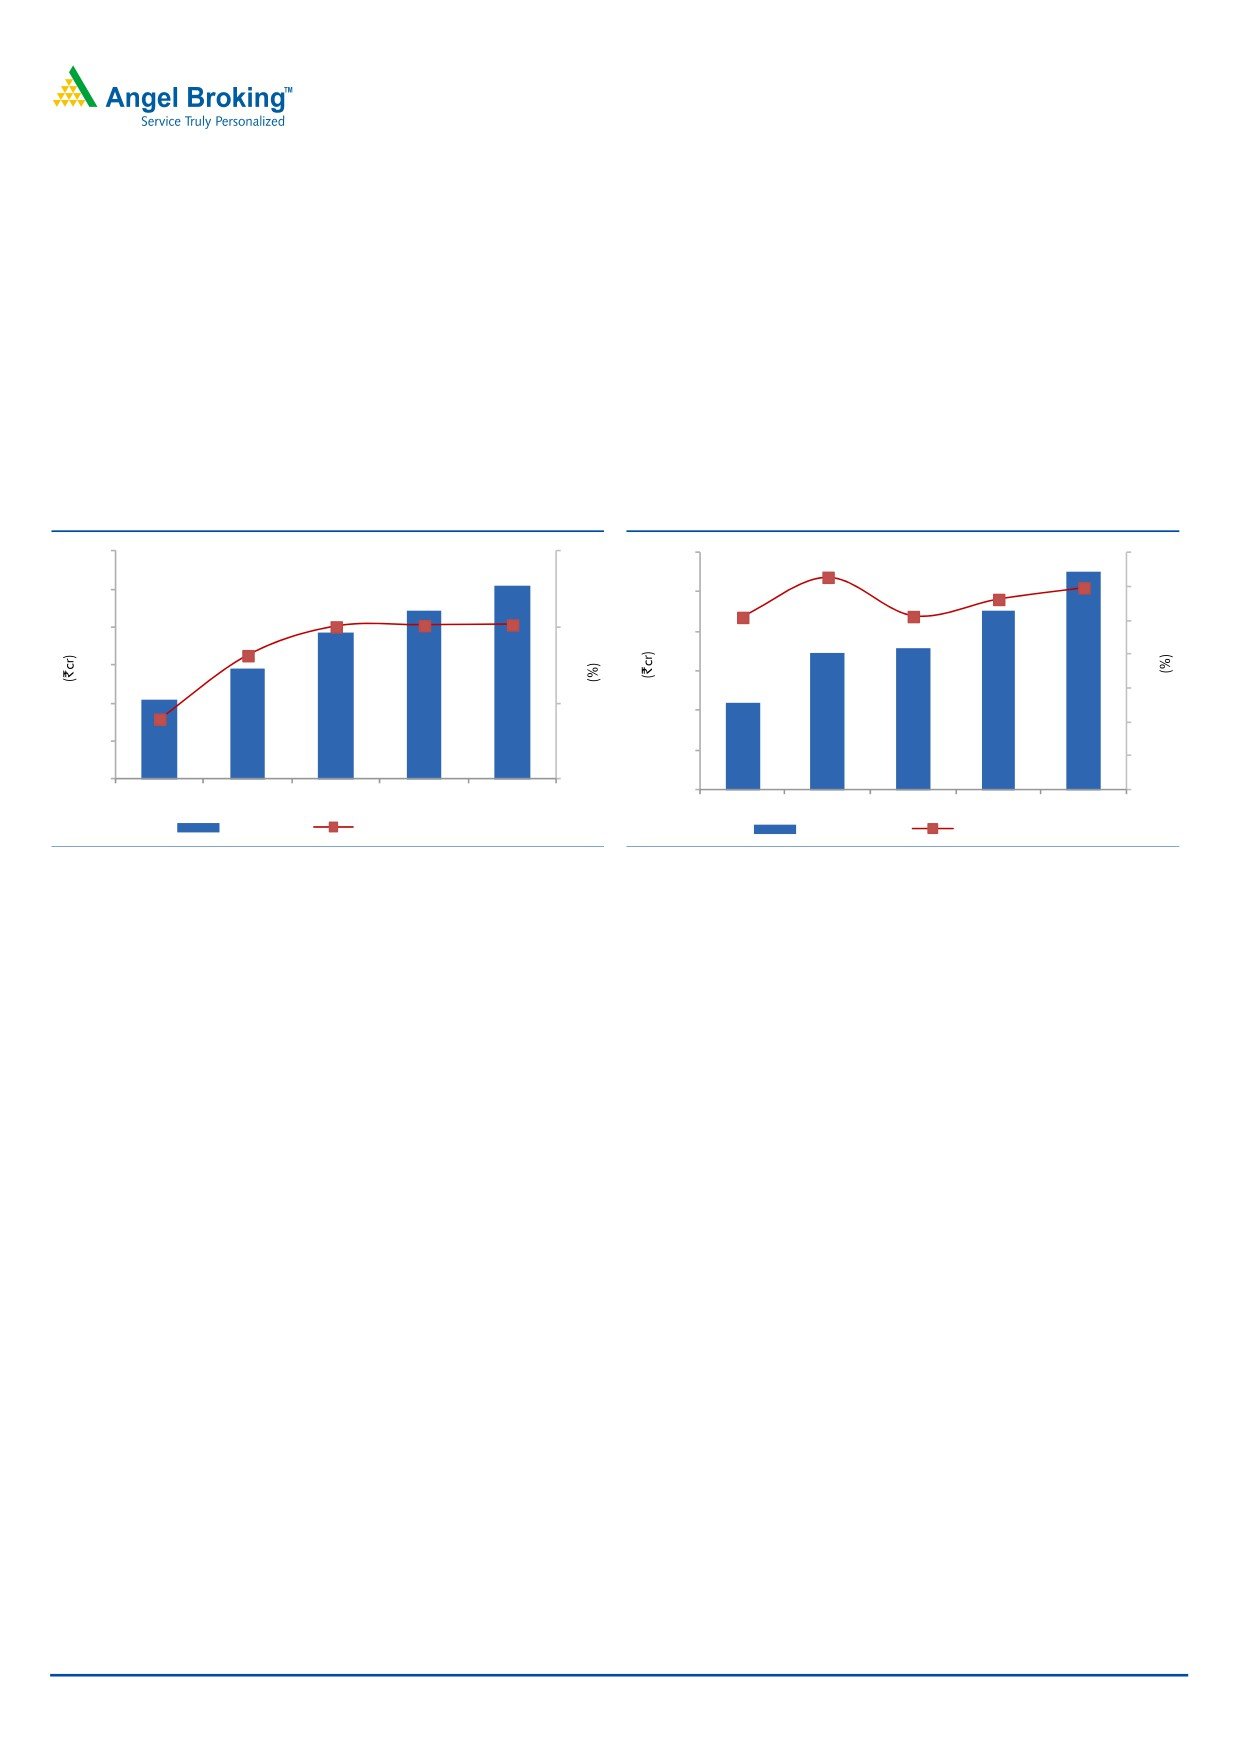
We expect the company’s operating margin to remain flat over FY2012-14E at
22.1%. Going forward, the relative increase in interest outgo for the company is
expected to come down substantially to ~10% as compared to ~29% in last two
years, assuming the interest rate to be stable at 16.6% and debt to increase by
10%, each for FY2013E and FY2014E. Bottom-line growth on a yoy basis was
muted in FY2012 at 3.9%, mainly because of higher tax outgo, as the company
lost the MAT credit entitlement in FY2012. The effective tax rate for FY2012 was
35.7%, which we expect would come down to the normal level of 33.0% in the
coming years. Aided by the above-mentioned factors, we expect SKNL’s profit to
post a 23.7% CAGR over FY2012-14E to `275cr.
Exhibit 8: EBITDA margin to remain flat
Exhibit 9: PAT margin to improve
1,200
24
300
7
6.3
275
1,017
5.6
6
1,000
888
250
5.1
6.0
773
5.1
5
800
22
200
226
586
173
180
22.0
22.1
22.1
4
600
150
422
21.3
110
3
400
20
100
2
200
19.6
50
1
0
18
0
0
FY2010
FY2011
FY2012
FY2013E
FY2014E
FY2010
FY2011
FY2012
FY2013E
FY2014E
EBITDA (LHS)
EBITDA Margin (RHS)
PAT (LHS)
PAT margin (RHS)
Source: Company, Angel Research
Source: Company, Angel Research
Reid & Taylor’s financials
We expect Reid & Taylor’s revenue to post a 15.2% CAGR to `1,911cr over
FY2011-14E, driven by strong brand name and increasing demand for branded
apparel in the urban market. Operating margin is expected to be flat at 32.7% for
FY2014E. In FY2012, the tax outgo was lower on account of excess provision for
tax in earlier years, which was a one-time benefit for the company. We expect the
company’s profit to register a 9.7% CAGR over FY2011-14E to `320cr.
Consolidated financials of SKNL
We expect SKNL (consolidated) to post a revenue CAGR of 14.2% to `8,290cr over
FY2012-14E, with an operating margin of
21.0% in FY2014E. The major
contributor to the revenue is the consumer textile segment (`3,084cr), followed by
the international business (`1,747cr) and the luxury textile segment (`1,426cr).
We expect the company to report profit of `524cr, registering a 15.2% CAGR over
FY2012-14E.
July 11, 2012
7
S. Kumars Nationwide | Initiating Coverage
Exhibit 10: SBU’s contribution to consolidated results
SBUs
FY2010
FY2011
FY2012
FY2013E
FY2014E
Consumer textiles/Belmonte
Net Sales
1,585
1,942
2,418
2,730
3,084
% chng
45.9
22.6
262.1
12.9
13.0
EBITDA
329
436
555
628
709
EBITDA margin
20.8
22.5
23.0
23.0
23.0
Luxury textiles
Net Sales
765
929
1,103
1,252
1,426
% chng
43.8
21.5
255.5
13.5
13.9
EBITDA
281
355
421
478
544
EBITDA margin
36.7
38.2
38.2
38.2
38.2
Ready-to-wear
Net Sales
397
610
894
1,034
1,194
% chng
58.8
53.7
234.8
15.6
15.5
EBITDA
84
129
183
209
240
EBITDA margin
21.1
21.2
20.5
20.2
20.1
Home textiles
Net Sales
386
426
462
524
590
% chng
13.4
10.5
259.1
13.6
12.6
EBITDA
69
72
80
90
101
EBITDA margin
17.9
16.8
17.2
17.2
17.2
Luxury cotton
Net Sales
16
111
183
226
249
% chng
607.8
258.3
23.6
10.2
EBITDA
1
21
46
56
62
EBITDA margin
3.3
18.8
25.0
25.0
25.0
International business
Net Sales
714
1,328
1,334
1,514
1,747
% chng
85.9
350.3
13.5
15.4
EBITDA
10
44
62
70
82
EBITDA margin
1.4
3.3
4.7
4.7
4.7
Intercompany
(1.8)
(124.1)
(28.7)
-
-
Total
3,861
5,223
6,364
7,279
8,290
Source: Company, Angel Research
July 11, 2012
8
S. Kumars Nationwide | Initiating Coverage
Outlook and valuation
SKNL has a well-planned growth strategy, following which it has set up a suit
factory at Bangalore, which commenced operations at the end of 3QFY2012.
The company further plans to - 1) rollout additional exclusive brand outlets for
Reid & Taylor (~160 stores), Kruger and Belmonte to expand its distribution and
franchisee networks, 2) set up a shirts factory to improve margins by offering
readymade products, 3) scale up capacity utilization at BSFC and 4) capacity
expansion in the luxury and mid-premium textile segments. Considering all these
factors, we expect SKNL’s consolidated revenue to post a 14.2% CAGR to `8,290cr
and profit to post a 15.2% CAGR to `524cr over FY2012-14E.
GIC had invested `900cr in Reid & Taylor in July 2008 for a 25.6% stake, which
gives a value of `2,614cr for the 74.4% stake of SKNL. On a conservative basis,
discounting SKNL’s stake in Reid & Taylor by 70%, its value in Reid & Taylor would
be `784cr. Assuming PE of 2x for SKNL (standalone) for FY2014E, we get a value
of
`549cr. Thus, the net value of SKNL would be
`1,334cr, including
Reid & Taylor’s stake, while the company currently has a market cap of `1,008cr.
Currently, at
`34, SKNL (standalone) is trading at PE of
3.7x; and on a
consolidated basis, it is trading at 1.9x for FY2014E. We initiate coverage on SKNL
with a Buy recommendation and an SOTP target price of `45.
Exhibit 11: Valuation
GIC investment in Reid & Taylor (` cr) (in 2008)
900
GIC's stake (%)
25.6
SKNL's stake in Reid & Taylor (%)
74.4
Value of SKNL's stake in Reid & Taylor (` cr)
2,614
Value after discounting stake by 70% (`cr)
784
SKNL's standalone PAT (FY2014E) (` cr)
275
Target PE (x)
2
Expected mcap (` cr)
549
Net value of the company (SKNL standalone + Reid & Taylor value)
1,334
Existing no. of shares (cr)
30
SKNL's current Mcap (`cr)
1,008
CMP
34
Expected CMP (`)
45
Upside (%)
32
Source: Company, Angel Research
July 11, 2012
9
S. Kumars Nationwide | Initiating Coverage
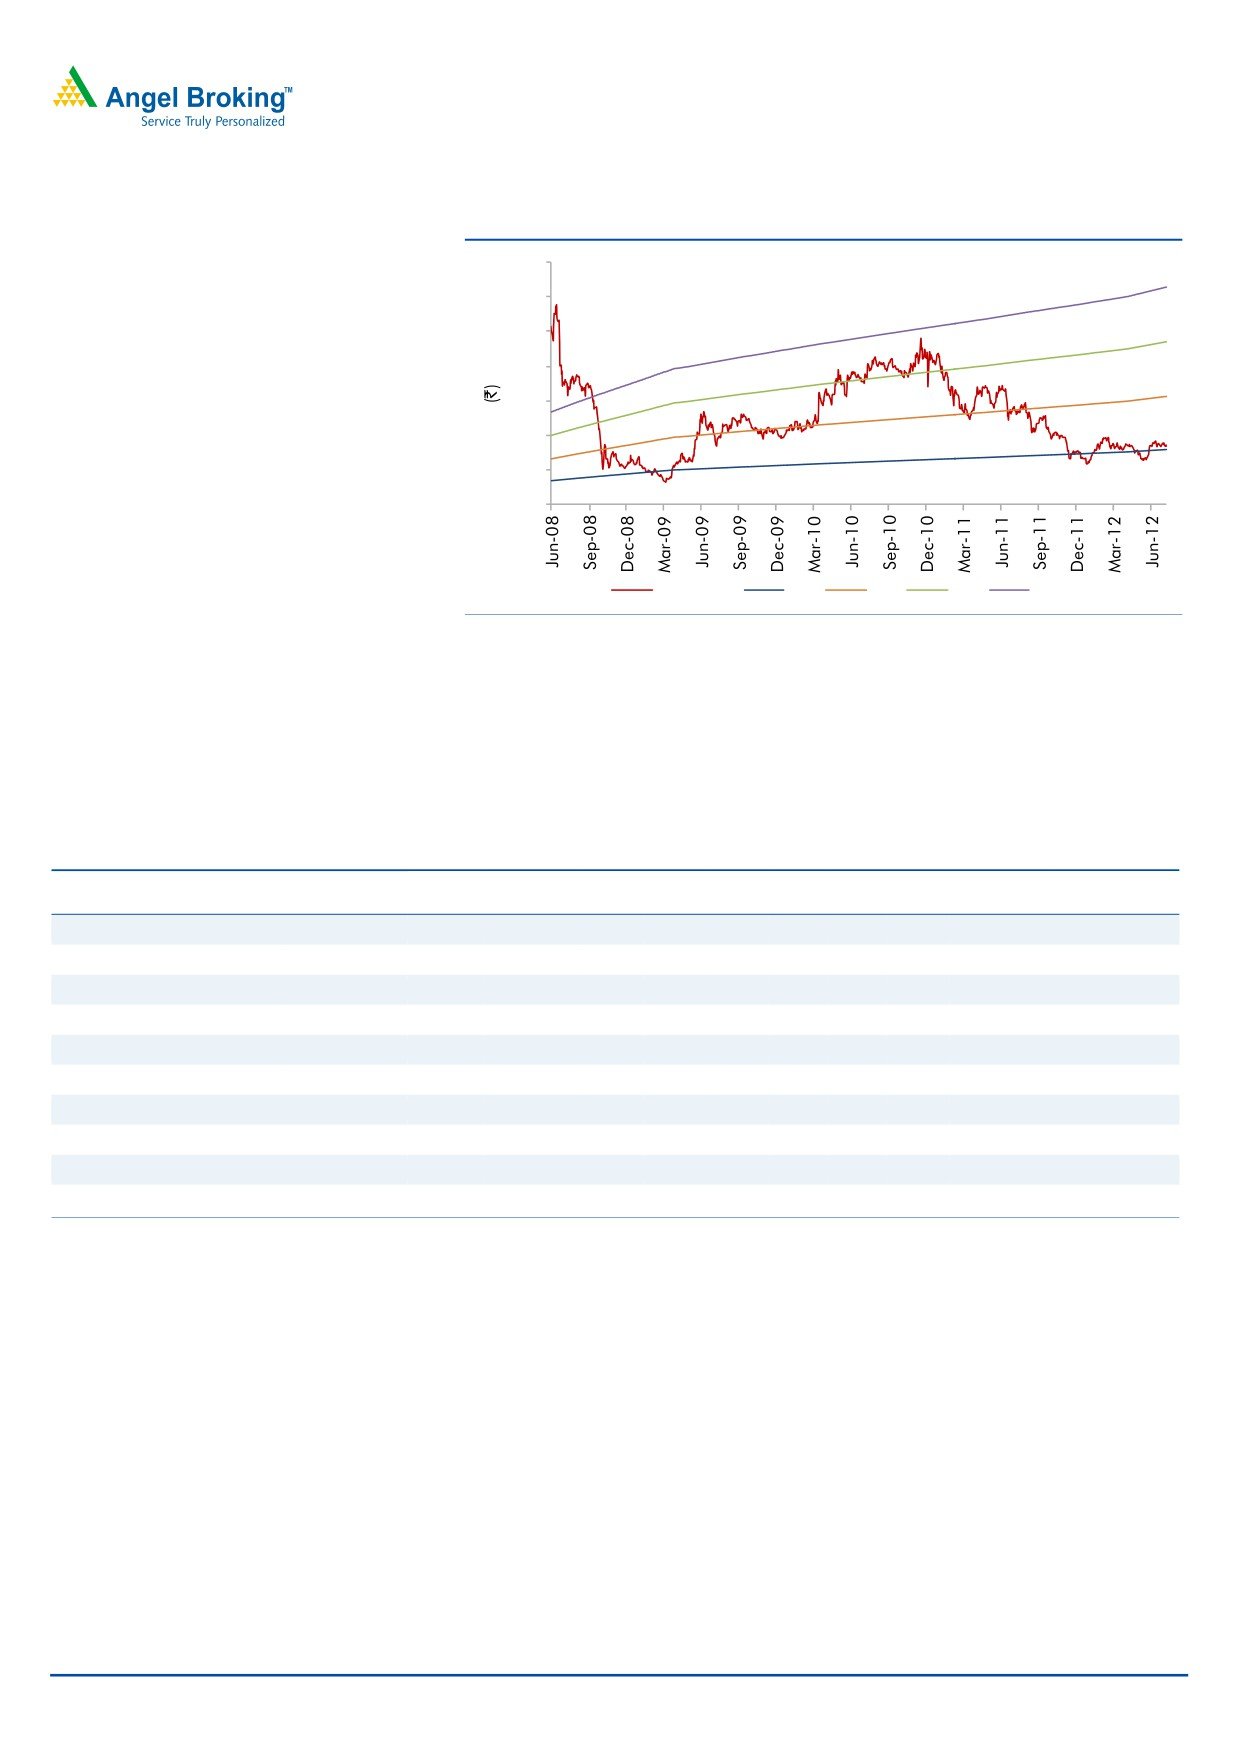
Exhibit 12: One-year forward PE band
140
120
100
80
60
40
20
0
Price (`)
2x
4x
6x
8x
Source: Company, Angel Research
Peer comparison on various parameters
On FY2014E basis, SKNL (consolidated) is trading at PE of 1.9x, which looks
attractive vis-à-vis its peers. The operating margin of the company is expected to
be 21.0% for FY2014E, which is higher than the operating margin of Arvind Ltd.
and Raymond.
Exhibit 13: SKNL trading at a discount vs. domestic textile industries
Mcap
Sales
OPM
PAT
EPS
RoE
P/E
P/BV
EV/Sales
EV/EBITDA
Company
Year
(` cr)
(` cr)
(%)
(` cr)
(`)
(%)
(x)
(x)
(x)
(x)
SKNL - Standalone
FY2013E
1,008
4,027
22.1
226
7.6
13.7
4.5
0.6
0.8
3.5
FY2014E
1,008
4,609
22.1
275
9.2
14.8
3.7
0.5
0.7
3.3
SKNL - Consolidated
FY2013E
1,008
7,279
21.0
447
15.0
13.7
2.3
0.3
0.7
3.4
FY2014E
1,008
8,290
21.0
524
17.6
13.9
1.9
0.2
0.7
3.2
Alok Industries*
FY2013E
1,458
11,218
25.0
479
5.8
16.4
3.0
0.4
1.1
4.4
FY2014E
1,458
12,342
25.2
665
8.0
17.4
2.2
0.4
1.0
3.9
Arvind Ltd.*
FY2013E
1,977
5,372
12.9
294
11.6
13.2
6.7
0.9
0.7
5.6
FY2014E
1,977
5,968
13.5
393
15.4
15.3
5.0
0.7
0.7
4.8
Raymond*
FY2013E
2,455
4,077
10.8
189
30.8
13.1
13.0
1.6
0.9
6.3
FY2014E
2,455
4,630
11.4
236
38.4
14.6
10.4
1.4
0.8
5.5
Source: Company, Angel Research; Note: * Bloomberg estimates
In the ready-to-wear segment, SKNL faces competition from branded competitors
such as Arvind Mills (Arrow), Aditya Birla Nuvo Brands (Louis Philippe, Allen Solly
and Van Heusen) and Raymond Apparel (Park Avenue).
July 11, 2012
10
S. Kumars Nationwide | Initiating Coverage
Concerns
Economic slowdown
According to industry reports, the current size of the domestic textile and apparel
market is US$77bn (2010). The market is expected to post a CAGR of 11% to
UD$220bn over FY2010-20E, mainly driven by increasing disposable income and
awareness in the mass market (i.e. rural India) about branded fabrics and
garments. However, any slowdown in the economy may adversely affect demand
and, hence, the company’s revenue.
Further postponement of Reid & Taylor IPO
SKNL had filed DRHP with SEBI on December 9, 2010, for the listing of
Reid & Taylor. However, the IPO for the same didn’t materialized due to the
unfavorable and volatile market. If the IPO is delayed further, it may be a concern
for the company as Reid & Taylor’s IPO is a major re-rating trigger for SKNL.
High net debt to equity level
Owing to the acquisitions and expansion activities, the net debt to equity for SKNL
(consolidated) has been at high levels in previous years. However, the
management expects the debt level to come down in the coming years as the
investments start yielding profits. However, if that doesn’t happen, it may be a
concern for the company going forward.
Exhibit 14: Net debt to equity level (consolidated)
1.30
1.24
1.20
1.20
1.12
1.18
1.10
1.00
1.05
1.03
0.90
0.80
0.70
FY2009
FY2010
FY2011
FY2012E FY2013E FY2014E
Source: Company, Angel Research
July 11, 2012
11
S. Kumars Nationwide | Initiating Coverage
Company background
S. Kumars Nationwide Ltd.
SKNL is one of the leading textile and apparel companies in India, which is
involved in the manufacturing, marketing and distribution of polyester blended
suitings, worsted suitings, workwear fabric, home textiles and ready-to-wear
garments. The company’s main growth drivers include its strong brand positioning,
diverse product portfolio that caters to all socioeconomic segments, vertically
integrated business model, presence across the value chain and contemporary
product offerings. SKNL is a market leader in the uniforms segment, with a 30%
market share. In addition, the company is the second largest player in the worsted
suiting segment. Further, SKNL is one of the largest institutional suppliers of textiles
to defense and police forces in India. The company is also a leader in the formal
wear segment in North America with popular brands, Coppley, HMX and Hickey
Freeman.
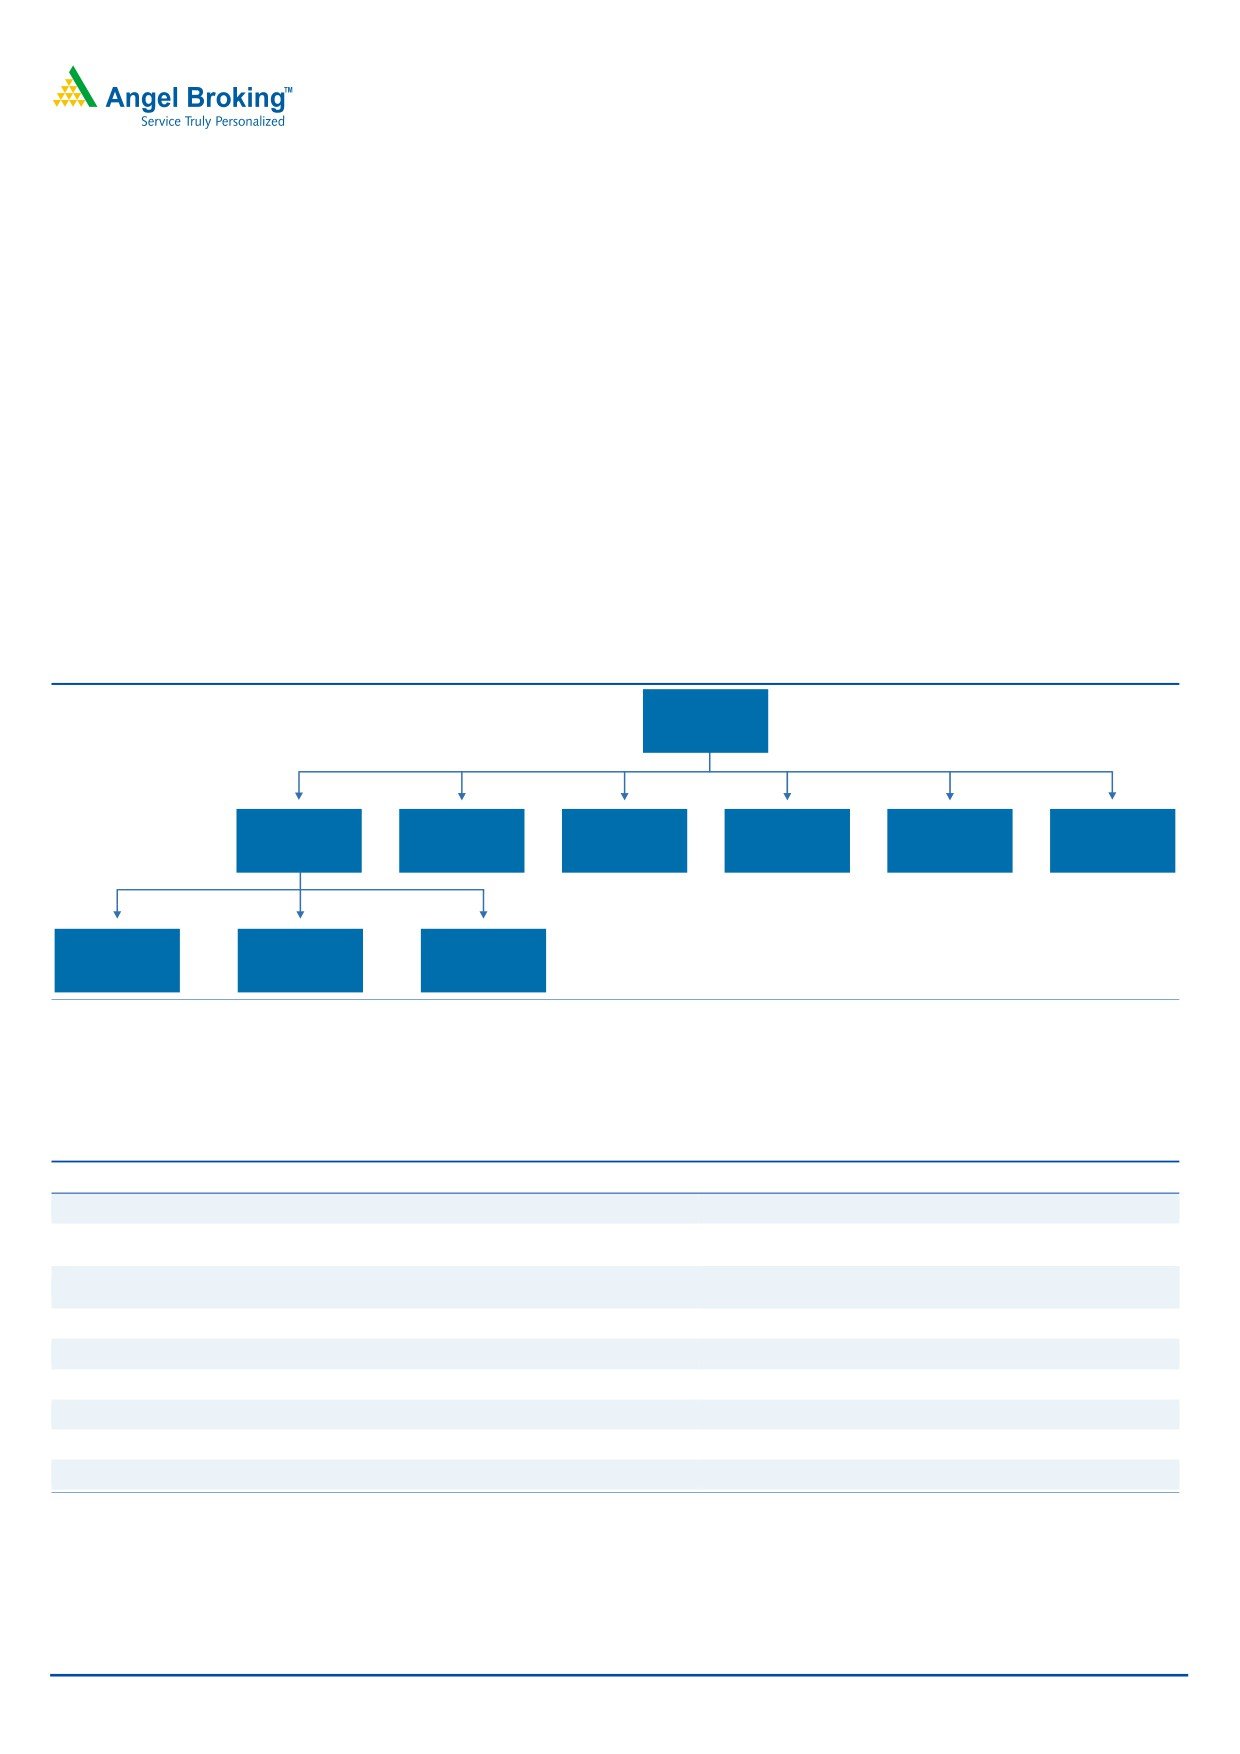
Exhibit 15: Corporate structure
SKNL
100%
100%
100%
100%
100%
74.4%^
SKNL
Total
Luxury
Home
Reid & Taylor
Belmonte
International
Wardrobe
Cotton
Textile
100%
100%
80%*
Leggiuno
HMX
SKNL
Italy
USA
U.K.
Source: Company, Angel Research; Note: ^ 25.6% owned by GIC; * 20% owned by LVMH
The company has manufacturing units located in India, Italy, U.K., U.S. and
Canada with cost-effective outsourcing.
Exhibit 16: SKNL's manufacturing units
Plant and location
Location
Products
Reid & Taylor Suiting Unit
Mysore, Karnataka
Worsted Suiting, Premium P/V Blended Suiting
Uniforms, Work Wear Fabrics, Polyester & Polyester -
S. Kumars Suiting Unit
Dewas, Madhya Pradesh
Viscose Blended Suitings
Polyester Blended Yarn, Grey Fabrics(PV,PC,100% Cotton)
Home Textile Chamunda Standard Mills
Dewas, Madhya Pradesh
Medium Value Cotton
Total Wardrobe Solutions
Bengaluru, Karnataka
Shirts, Trousers, Blazers, Suits & Other Accessories
Home Textiles
Jhagadia, Gujarat
Home Textiles
HVFC
Jhagadia, Gujarat
High Value Fine Cotton Shirting
Leggiuno
Italy & U.K.
Luxury Cotton Shirting & Woolen Fabrics
HMX
Illinois & New York, U.S.
Tailored Products
Coppley
Hamilton, Canada
Tailored Products
Source: Company, Angel Research
July 11, 2012
12
S. Kumars Nationwide | Initiating Coverage
SKNL’s SBUs
SKNL operated under six SBUs, Consumer textile, Luxury textile, Ready-to-wear,
Home textile, luxury cotton and international business.
1. Consumer Textiles/Belmonte
The consumer textile division addresses to the economy and mid-price strata of the
society and deals in fabrics for work wear, uniforms and daily wear. This division is
the major contributor to the company’s overall growth over years and is improving
with further market penetration.
Uniformity, the work wear division of Belmonte, is the market leader in the uniform
segment with a 30% market share and is one of the largest institutional suppliers
of textiles to defense and paramilitary forces in India.
2. Luxury textiles
The luxury textiles division primarily comprises Reid & Taylor, which targets the
premium segment of the Indian fabric market. The luxury textiles segment
continues to be a prime revenue driver, reporting consistent growth over time.
Being a premium segment caterer, this segment is the last to get affected with any
rise in raw-material prices and has seen good growth on the back
of expanding volumes and better realizations in polyester-wool as well as
polyester-viscose fabrics.
3. Ready-to-wear
Ready-to-wear consists of garments/apparel represented by Reid & Taylor,
Belmonte and World Player. Ready-to-wear is the fastest growing segment in the
textile and apparel market because of changing consumer preferences. The
company also plans to launch brand ‘Kruger’ under premium category to capture
high margins.
4. Home textiles / Carmichael House / Total Home Expression
This segment manufactures and markets home textiles, such as bed sheets and
sheeting fabrics. The segment is witnessing a rise in demand because of increasing
disposable income and consumers’ shift towards luxury brands.
5. Luxury cotton / HVFC (High Value Fine Cotton)
This segment focuses on the HVFC market for shirting, bottoms and home textiles.
This division operates the 12.8mn meters per year state-of-the-art HVFC facility at
Bharuch, Gujarat (operating at
70% capacity utilization
- 4QFY2012).
The segment is represented by the premium category brand, Baruche.
6. International business
SKNL has expanded its global footprints by acquiring HMX in the U.S. and
Leggiuno in Italy. The company has also signed an 80:20 JV between its wholly
owned U.K. subsidiary, SKNL (U.K.) Ltd., and LVMH group, for the global
menswear license for DKNY brand.
July 11, 2012
13
S. Kumars Nationwide | Initiating Coverage
Vertically integrated system and strong distribution channel
SKNL operates through a vertically integrated operational system, which facilitates
its presence across the value chain and captures higher margin. The company’s
presence across the supply chain allows it to operate in a more systematic way.
Exhibit 17: Presence across the supply chain
Retail
Wholesale
Garmenting
Finishing
Weaving
Spinning
Preparatory
Processes
Procurement
of Taw Fibre
Source: Company, Angel Research
In addition, SKNL has a well-entrenched distribution channel, which gives it an
edge over other players in terms of reach. The company has an extensive
distribution network consisting of multi-brand outlets (more than 30,000 retailers
serviced by a network of over 400 wholesalers), exclusive brand outlets and large
format stores. The company is further focused on expanding its distribution
franchisee networks by adding more exclusive brand outlets for Reid & Taylor,
Kruger and Belmonte as part of its growth strategy.
World Player - New card in the product portfolio deck
World Player, SKNL’s economy brand under SKumars’ apparel segment, is a total
wardrobe solution, ranging from shirts, trousers, jeans to knitwear. The company
has chosen Sachin Tendulkar as its brand ambassador. The company has currently
launched it in four states of Southern India and plans to extend its presence across
India by having it in 650 districts. Through this brand, SKNL is poised to access the
mass market of India, which is a huge market in terms of volume and is
increasingly becoming brand conscious. The average selling price of shirts under
this brand ranges from `270 to `500.
July 11, 2012
14
S. Kumars Nationwide | Initiating Coverage
Reid & Taylor
Reid & Taylor, a 74.4% subsidiary of SKNL, is the flagship brand of the company.
The remaining 25.6% is owned by the Government of Singapore Investment
Corporation (Ventures) Pte. Ltd. (GIC). In July 2008, GIC invested `900cr in
Reid & Taylor for its stake, which gives a value of `2,614cr to SKNL’s stake.
Reid & Taylor covers premium and super premium fabrics, such as worsted, all-
wool and wool polyester blended suitings, which cater to the premium and
super premium markets, as well as ready-to-wear garments that focus on the
formal wear part of the premium segment. The apparel range includes formal
and casual daywear suits, jackets, trousers, ties and other accessories along with a
wide range of t-shirts, jeans and other weekend wear. According to CARE
Research, Reid & Taylor has a ~24% share (in 2010) of the worsted fabrics
market in India.
July 11, 2012
15
S. Kumars Nationwide | Initiating Coverage
Textile and apparel industry in India
The Indian textile industry is one of the leading textile industries in the world,
contributing ~4% to India’s GDP and 17% to forex earnings. This industry is one of
the most important sectors of the economy in terms of investment, revenue, trade
and employment generation the world over.
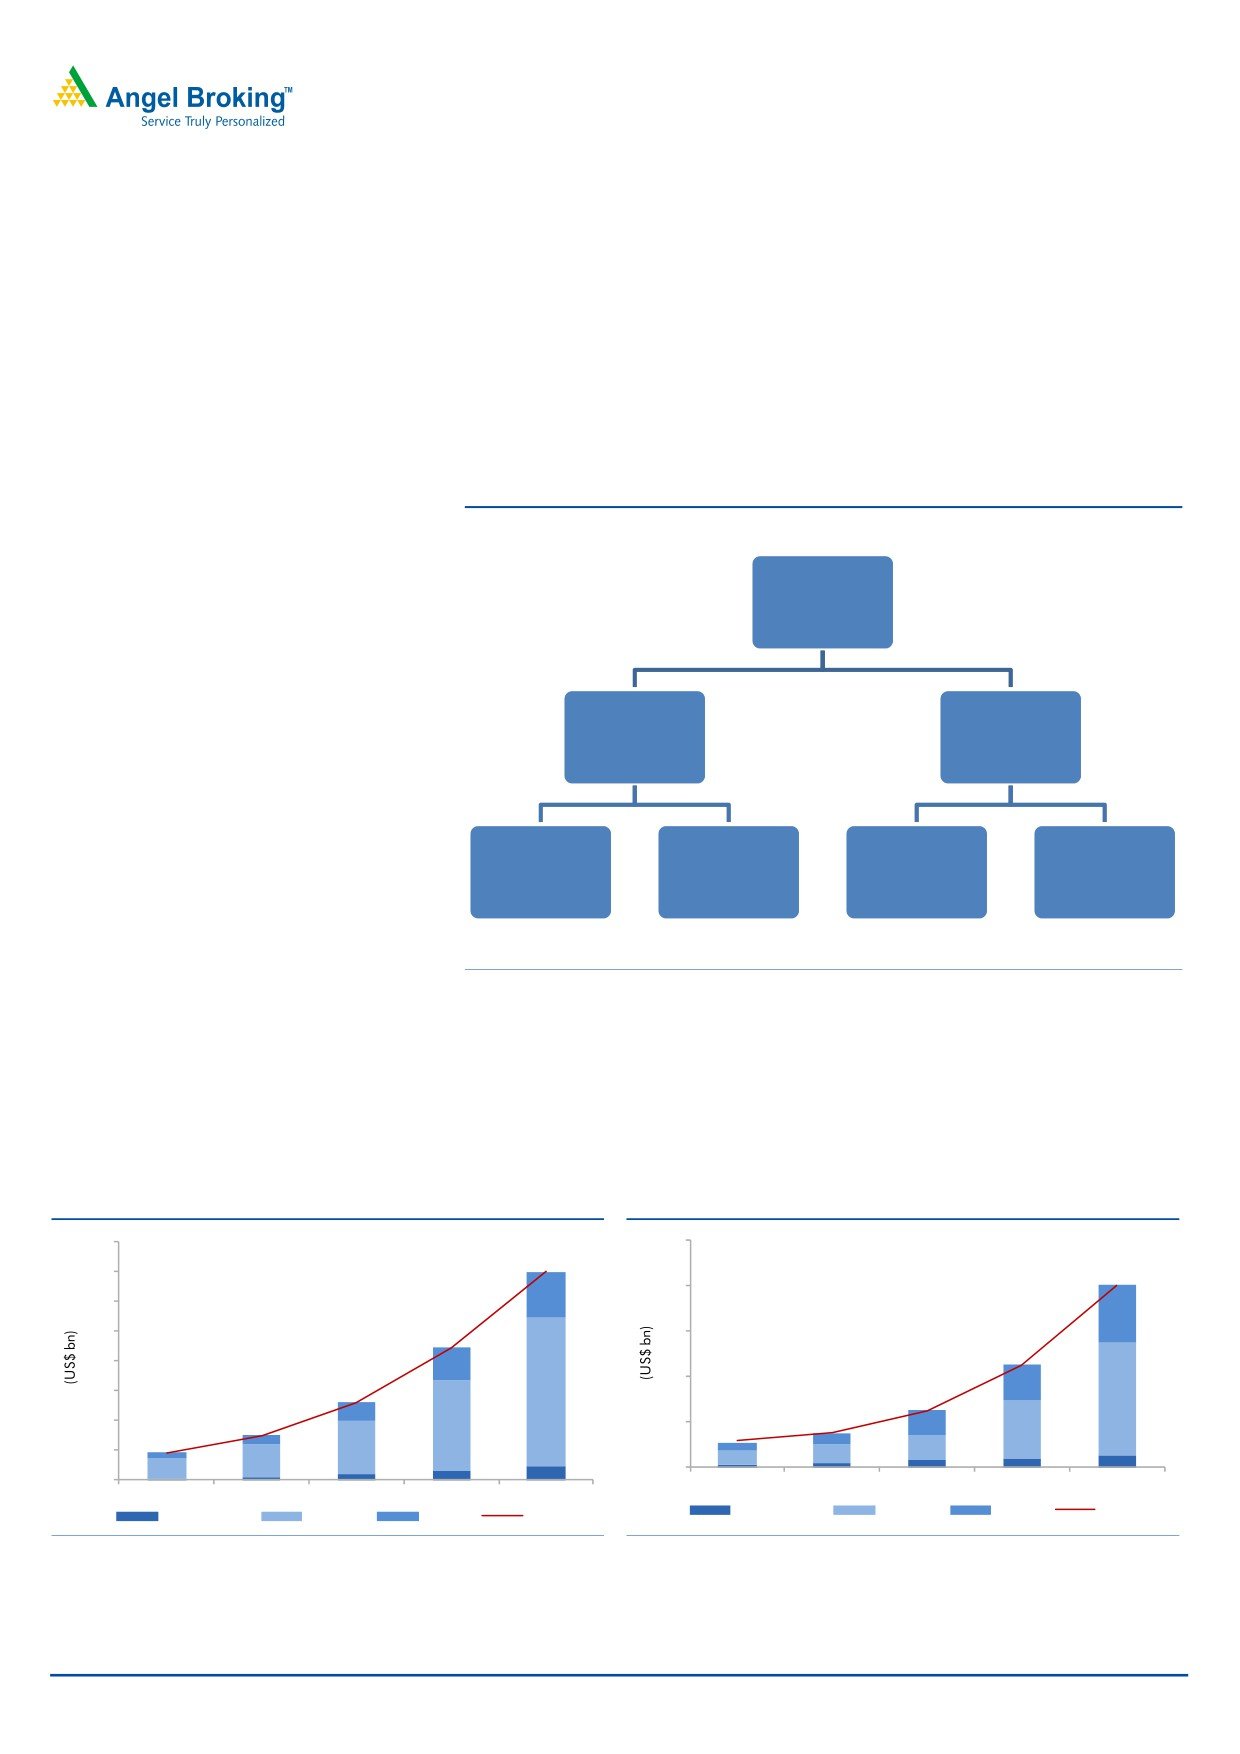
According to Technopak’s analysis, the current size of the domestic textile and
apparel market is US$77bn (2010). The market is expected to post a CAGR of
11% to US$220bn over FY2010-20E.
Exhibit 18: Indian textile and apparel market (2010)
Indian Textile
and Apparel
Market
(US$77bn)
Domestic market
Export market
(US$52bn)
(US$25bn)
Textiles
Apparel
Textiles
Apparel
(US$12bn)
(US$36bn)
(US$11bn)
(US$11bn)
Source: Technopak analysis
Of the total domestic textile market, apparels are expected to post a CAGR of 11%
over FY2010-20E to US$100bn, surpassing the other segments such as home
textile (CAGR 8%) and technical textile (CAGR 10%). The export market is
estimated to post a 12% CAGR in this decade and the market size will reach
US$80bn by FY2020E.
Exhibit 19: Domestic textile & apparel market (US$bn)
Exhibit 20: Indian textile & apparel export (US$bn)
100
160
140
80
140
80
120
100
89
60
45
80
40
60
52
25
30
15
40
20
11
18
20
0
0
2000
2005
2010
2015E
2020E
2000
2005
2010
2015E
2020E
Home textile
Apparel
Textile
Total
Home textile
Apparel
Textile
Total
Source: Technopak Analysis
Source: Technopak Analysis
July 11, 2012
16
S. Kumars Nationwide | Initiating Coverage
Profit and Loss (Standalone)
Y/E March (` cr)
FY2009
FY2010
FY2011
FY2012
FY2013E
FY2014E
Gross sales
1,550
2,155
2,757
3,511
4,027
4,609
Less: Excise duty
0
0
0
-
-
-
Net Sales
1,550
2,155
2,757
3,511
4,027
4,609
Other operating income
-
-
-
-
-
-
Total operating income
1,550
2,155
2,757
3,511
4,027
4,609
% chg
(3.4)
39.0
28.0
27.3
14.7
14.5
Net Raw Materials
1,165
1,547
1,930
2,456
2,814
3,207
% chg
8.7
32.8
24.7
27.3
14.6
14.0
Other Mfg costs
24
31
58
63
72
88
% chg
(44.1)
29.9
88.1
9.0
14.7
20.8
Personnel
29
41
54
88
101
120
% chg
(21.6)
43.0
30.8
64.8
14.7
18.1
Other
86
113
130
131
151
177
% chg
(28.3)
31.9
14.4
0.7
15.6
17.5
Total Expenditure
1,304
1,733
2,171
2,738
3,139
3,592
EBITDA
247
422
586
773
888
1,017
% chg
(26.4)
71.2
38.9
31.9
14.9
14.5
(% of Net Sales)
15.9
19.6
21.3
22.0
22.1
22.1
Depreciation & Amortisation
27
42
74
92
109
122
EBIT
220
380
512
681
779
895
% chg
(26.5)
72.9
34.7
32.9
14.4
14.9
(% of Net Sales)
14.2
17.7
18.6
19.4
19.3
19.4
Interest & other Charges
139
244
314
404
443
487
Other Income
61
5
4
2
2
3
(% of Net Sales)
3.9
0.2
0.1
0.1
0.1
0.1
Recurring PBT
81
137
198
277
336
408
% chg
(61.3)
69.2
44.9
39.9
21.0
21.5
PBT (reported)
142
142
202
279
338
410
Tax
82
36
29
100
112
136
(% of PBT)
57.7
25.2
14.5
35.7
33.0
33.0
PAT (reported)
60
106
173
180
226
275
Extraordinary Expense/(Inc.)
50
(4)
(0)
-
-
-
ADJ. PAT
10
110
173
180
226
275
% chg
(94.7)
1,008.2
57.7
3.9
26.0
21.4
(% of Net Sales)
0.6
5.1
6.3
5.1
5.6
6.0
Basic EPS (`)
0.4
4.6
6.1
6.0
7.6
9.2
Fully Diluted EPS (`)
0.4
4.6
6.1
6.0
7.6
9.2
% chg
(95.0)
946.7
30.9
(0.5)
26.0
21.4
July 11, 2012
17
S. Kumars Nationwide | Initiating Coverage
Balance Sheet (Standalone)
Y/E March (` cr)
FY2009
FY2010
FY2011
FY2012
FY2013E
FY2014E
SOURCES OF FUNDS
Equity Share Capital
310
313
337
350
350
350
Reserves& Surplus
602
765
1,175
1,208
1,393
1,627
Shareholder’s Funds
913
1,077
1,512
1,557
1,743
1,977
Total Loans
1,938
2,366
2,226
2,426
2,669
2,936
Deferred Tax (Net)
8
17
27
40
40
40
Total Liabilities
2,858
3,460
3,765
4,023
4,451
4,952
APPLICATION OF FUNDS
Gross Block
682
881
1,068
1,487
1,711
1,882
Less: Acc. Depreciation
193
230
304
396
505
628
Less: Impairment
-
-
-
-
-
-
Net Block
489
651
764
1,091
1,205
1,254
Capital Work-in-Progress
607
564
259
71
171
271
Lease adjustment
-
-
-
-
-
-
Goodwill
-
-
-
-
-
-
Investments
206
426
504
517
517
517
Current Assets
1,838
2,229
3,043
3,486
3,762
4,288
Cash
43
46
21
11
49
49
Loans & Advances
381
427
848
791
805
922
Inventory
578
726
941
1,162
1,340
1,528
Debtors
837
1,030
1,189
1,494
1,539
1,761
Current liabilities
-
-
45
28
28
28
Other current assets
282
409
806
1,143
1,204
1,378
Net Current Assets
1,556
1,819
2,237
2,344
2,558
2,910
Misc. Exp. not written off
-
-
-
-
-
-
Total Assets
2,858
3,460
3,765
4,023
4,451
4,952
July 11, 2012
18
S. Kumars Nationwide | Initiating Coverage
Cash Flow (Standalone)
Y/E March (` cr)
FY2009 FY2010 FY2011 FY2012E FY2013E FY2014E
Profit before tax
142
142
202
279
338
410
Depreciation
27
42
74
92
109
122
Change in Working Capital
(346)
(260)
(444)
(116)
(175)
(353)
Direct taxes paid
(82)
(36)
(29)
(100)
(112)
(136)
Others
66
148
68
(2)
(2)
(3)
Cash Flow from Operations
(193)
36
(129)
154
158
41
(Inc.)/Dec. in Fixed Assets
(278)
(156)
118
(231)
(324)
(271)
(Inc.)/Dec. in Investments
(165)
(219)
(78)
(13)
-
-
Others
(6)
(8)
(258)
2
2
3
Cash Flow from Investing
(449)
(384)
(219)
(242)
(321)
(268)
Issue of Equity
(70)
3
24
12
-
-
Inc./(Dec.) in loans
836
428
(140)
200
243
267
Dividend Paid (Incl. Tax)
-
-
(39)
(41)
(41)
(41)
Others
(90)
(79)
477
(94)
-
-
Cash Flow from Financing
676
351
322
78
202
226
Inc./(Dec.) in Cash
35
3
(25)
(10)
39
(1)
Opening Cash balances
8
43
46
21
11
49
Closing Cash balances
43
46
21
11
49
49
July 11, 2012
19
S. Kumars Nationwide | Initiating Coverage
Key Ratios (Standalone)
Y/E March
FY2009
FY2010
FY2011
FY2012
FY2013E
FY2014E
Valuation Ratio (x)
P/E (on FDEPS)
101.9
9.2
5.8
5.6
4.5
3.7
P/CEPS
27.7
6.7
4.1
3.7
3.0
2.5
P/BV
1.1
0.9
0.7
0.6
0.6
0.5
EV/Net sales
1.7
1.3
1.0
0.8
0.8
0.7
EV/EBITDA
10.9
6.9
4.6
3.8
3.5
3.3
EV / Total Assets
0.9
0.8
0.7
0.7
0.7
0.7
Per Share Data (`)
EPS (Basic)
0.4
4.6
6.1
6.0
7.6
9.2
EPS (fully diluted)
0.4
4.6
6.1
6.0
7.6
9.2
Cash EPS
1.6
6.4
8.7
9.1
11.3
13.3
DPS
-
-
1.0
1.0
1.0
1.0
Book Value
40.9
45.6
53.1
52.4
58.6
66.5
DuPont Analysis
EBIT margin
14.2
17.7
18.6
19.4
19.3
19.4
Tax retention ratio
0.4
0.7
0.9
0.6
0.7
0.7
Asset turnover (x)
0.8
0.9
0.9
1.0
1.1
1.1
ROIC (Post-tax)
4.7
11.8
14.8
12.9
14.2
14.7
Cost of Debt (Post Tax)
3.9
8.5
11.7
11.2
11.6
11.6
Leverage (x)
1.9
1.8
1.1
1.2
1.2
1.2
Operating ROE
6.1
17.7
18.3
15.1
17.3
18.4
Returns (%)
ROCE (Pre-tax)
7.7
11.0
13.7
17.1
17.6
18.2
Angel ROIC (Pre-tax)
11.0
15.8
17.3
20.1
21.2
22.0
ROE
1.1
11.0
13.3
11.7
13.7
14.8
Turnover ratios (x)
Asset TO (Gross Block)
2.7
2.8
2.8
2.7
2.5
2.6
Inventory / Net sales (days)
125
110
110
109
113
114
Receivables (days)
170
158
147
139
139
139
Payables (days)
64
73
102
130
140
140
WC cycle (ex-cash) (days)
316
278
264
236
219
213
Solvency ratios (x)
Net debt to equity
1.9
1.8
1.1
1.2
1.2
1.2
Net debt to EBITDA
6.8
4.5
2.9
2.5
2.4
2.3
Int. Coverage (EBIT/ Int.)
1.6
1.6
1.6
1.7
1.8
1.8
July 11, 2012
20
S. Kumars Nationwide | Initiating Coverage
Profit and Loss (Consolidated)
Y/E March (` cr)
FY2009
FY2010
FY2011
FY2012
FY2013E
FY2014E
Gross sales
2,260
3,838
5,181
6,355
7,279
8,290
Less: Excise duty
0
0
0
-
-
-
Net Sales
2,260
3,838
5,180
6,355
7,279
8,290
Other operating income
-
-
-
-
-
-
Total operating income
2,260
3,838
5,180
6,355
7,279
8,290
% chg
29.3
69.8
35.0
22.7
14.6
13.9
Net Raw Materials
1,461
2,316
2,971
3,738
4,278
4,863
% chg
29.4
58.5
28.3
25.8
14.4
13.7
Other Mfg costs
79
124
187
203
232
265
% chg
49.5
57.6
50.8
8.9
14.1
14.2
Personnel
73
313
506
584
668
770
% chg
73.8
328.4
61.5
15.5
14.5
15.2
Other
183
338
487
492
570
654
% chg
36.4
84.9
44.1
1.0
15.9
14.6
Total Expenditure
1,796
3,091
4,151
5,017
5,748
6,551
EBITDA
465
747
1,029
1,337
1,531
1,738
% chg
18.9
60.7
37.9
29.9
14.5
13.5
(% of Net Sales)
20.6
19.5
19.9
21.0
21.0
21.0
Depreciation & Amortisation
44
81
125
148
188
211
EBIT
420
665
905
1,190
1,343
1,527
% chg
20.7
58.3
36.0
31.5
12.9
13.7
(% of Net Sales)
18.6
17.3
17.5
18.7
18.5
18.4
Interest & other Charges
145
264
390
533
588
647
Other Income
73
23
43
10
11
13
(% of Net Sales)
3.2
0.6
0.8
0.2
0.2
0.2
Recurring PBT
275
401
515
656
755
880
% chg
9.7
45.7
28.4
27.4
15.0
16.6
PBT (reported)
349
425
558
666
766
893
Tax
153
147
165
195
246
286
(% of PBT)
44.0
34.7
29.6
29.3
32.1
32.1
PAT (reported)
195
277
392
471
520
606
Minority interest
19
48
62
76
73
82
PAT after MI
177
229
331
395
447
524
Extraordinary Expense/(Inc.)
43
(3)
(1)
-
-
-
ADJ. PAT
134
232
332
395
447
524
% chg
(37.3)
73.5
43.0
19.1
13.1
17.3
(% of Net Sales)
5.9
6.0
6.4
6.2
6.1
6.3
Basic EPS (`)
6.0
9.8
11.6
13.3
15.0
17.6
Fully Diluted EPS (`)
6.0
9.8
11.6
13.3
15.0
17.6
% chg
(41.1)
63.8
18.7
14.1
13.1
17.3
July 11, 2012
21
S. Kumars Nationwide | Initiating Coverage
Balance Sheet (Consolidated)
Y/E March (` cr)
FY2009
FY2010
FY2011
FY2012
FY2013E
FY2014E
SOURCES OF FUNDS
Equity Share Capital
310
313
337
350
350
350
Reserves& Surplus
1,325
1,855
2,401
2,674
3,148
3,708
Equity Share Warrants
-
13
33
-
-
-
Equity Application Money
-
6
6
-
-
-
Shareholders’ Funds
1,636
2,188
2,777
3,023
3,498
4,058
Minority Interest
230
337
411
487
508
590
Total Loans
1,804
2,759
3,000
3,796
4,197
4,617
Deferred Tax (Net)
11
150
75
103
103
103
Total Liabilities
3,681
5,434
6,263
7,408
8,306
9,368
APPLICATION OF FUNDS
Gross Block
852
1,573
1,839
2,615
3,005
3,345
Less: Acc. Depreciation
217
376
490
638
826
1,037
Less: Impairment
-
-
-
-
-
-
Net Block
634
1,196
1,349
1,977
2,179
2,308
Capital Work-in-Progress
666
783
284
297
597
797
Lease adjustment
-
-
-
-
-
-
Goodwill
101
125
125
125
125
125
Investments
4
1
1
1
1
1
Current Assets
2,756
4,077
5,664
6,659
7,094
8,051
Cash
109
132
82
32
57
81
Loans & Advances
634
921
1,976
2,107
2,257
2,570
Inventory
808
1,307
1,586
2,023
2,223
2,485
Debtors
1,204
1,717
1,968
2,459
2,518
2,876
Other current assets
-
-
53
39
39
39
Current liabilities
480
748
1,160
1,650
1,689
1,914
Net Current Assets
2,276
3,329
4,504
5,009
5,404
6,137
Misc. Exp. not written off
-
-
0
0
0
0
Total Assets
3,681
5,434
6,263
7,408
8,306
9,368
July 11, 2012
22
S. Kumars Nationwide | Initiating Coverage
Cash Flow (Consolidated)
Y/E March (` cr)
FY2009 FY2010 FY2011 FY2012E FY2013E FY2014E
Profit before tax
349
425
558
666
766
893
Depreciation
44
81
125
148
188
211
Change in Working Capital
(727)
(1,029)
(1,226)
(555)
(370)
(708)
Direct taxes paid
(153)
(147)
(165)
(195)
(246)
(286)
Others
114
550
443
(10)
(11)
(13)
Cash Flow from Operations
(374)
(120)
(266)
54
326
97
(Inc.)/Dec. in Fixed Assets
(517)
(862)
232
(788)
(690)
(540)
(Inc.)/Dec. in Investments
(2)
2
0
(0)
-
-
Others
60
389
(626)
(159)
11
13
Cash Flow from Investing
(459)
(470)
(394)
(947)
(679)
(528)
Issue of Equity
(70)
3
24
12
-
-
Inc./(Dec.) in loans
409
955
242
795
402
420
Dividend Paid (Incl. Tax)
-
-
(39)
(41)
(41)
(41)
Others
591
(344)
383
76
17
77
Cash Flow from Financing
931
613
610
843
378
456
Inc./(Dec.) in Cash
98
23
(50)
(50)
25
25
Opening Cash balances
11
109
132
82
32
57
Closing Cash balances
109
132
82
32
57
81
July 11, 2012
23
S. Kumars Nationwide | Initiating Coverage
Key Ratios (Consolidated)
Y/E March
FY2009
FY2010
FY2011
FY2012
FY2013E
FY2014E
Valuation Ratio (x)
P/E (on FDEPS)
7.5
4.3
3.0
2.6
2.3
1.9
P/CEPS
5.7
3.2
2.2
1.9
1.6
1.4
P/BV
0.6
0.5
0.4
0.3
0.3
0.2
EV/Net sales
1.2
0.9
0.8
0.8
0.7
0.7
EV/EBITDA
5.8
4.9
3.8
3.6
3.4
3.2
EV / Total Assets
0.7
0.7
0.6
0.7
0.6
0.6
Per Share Data (`)
EPS (Basic)
6.0
9.8
11.6
13.3
15.0
17.6
EPS (fully diluted)
6.0
9.8
11.6
13.3
15.0
17.6
Cash EPS
8.0
13.2
16.0
18.2
21.4
24.7
DPS
-
-
1.0
1.0
1.0
1.0
Book Value
73.2
92.5
97.4
101.7
117.6
136.5
DuPont Analysis
EBIT margin
18.6
17.3
17.5
18.7
18.5
18.4
Tax retention ratio
0.6
0.7
0.7
0.7
0.7
0.7
Asset turnover (x)
0.8
0.9
0.9
0.9
1.0
1.0
ROIC (Post-tax)
8.4
10.2
11.2
12.3
12.3
12.6
Cost of Debt (Post Tax)
5.1
7.6
9.5
11.1
10.0
10.0
Leverage (x)
1.0
1.2
1.1
1.2
1.2
1.1
Operating ROE
11.9
13.5
12.9
13.7
15.0
15.4
Returns (%)
ROCE (Pre-tax)
11.5
12.6
14.6
16.3
16.4
16.5
Angel ROIC (Pre-tax)
15.1
15.7
15.9
17.4
18.1
18.5
ROE
10.2
12.1
13.4
13.6
13.7
13.9
Turnover ratios (x)
Asset TO (Gross Block)
3.2
3.2
3.0
2.9
2.6
2.6
Inventory / Net sales (days)
112
101
102
104
106
104
Receivables (days)
162
139
130
127
125
119
Payables (days)
72
72
84
102
106
100
WC cycle (ex-cash) (days)
350
304
312
286
268
267
Solvency ratios (x)
Net debt to equity
1.0
1.2
1.1
1.2
1.2
1.1
Net debt to EBITDA
3.6
3.5
2.8
2.8
2.7
2.6
Int. Coverage (EBIT/ Int.)
2.9
2.5
2.3
2.2
2.3
2.4
July 11, 2012
24
S. Kumars Nationwide | Initiating Coverage
Research Team Tel: 022 - 39357800
DISCLAIMER
This document is solely for the personal information of the recipient, and must not be singularly used as the basis of any investment
decision. Nothing in this document should be construed as investment or financial advice. Each recipient of this document should make
such investigations as they deem necessary to arrive at an independent evaluation of an investment in the securities of the companies
referred to in this document (including the merits and risks involved), and should consult their own advisors to determine the merits and
risks of such an investment.
Angel Broking Limited, its affiliates, directors, its proprietary trading and investment businesses may, from time to time, make
investment decisions that are inconsistent with or contradictory to the recommendations expressed herein. The views contained in this
document are those of the analyst, and the company may or may not subscribe to all the views expressed within.
Reports based on technical and derivative analysis center on studying charts of a stock's price movement, outstanding positions and
trading volume, as opposed to focusing on a company's fundamentals and, as such, may not match with a report on a company's
fundamentals.
The information in this document has been printed on the basis of publicly available information, internal data and other reliable
sources believed to be true, but we do not represent that it is accurate or complete and it should not be relied on as such, as this
document is for general guidance only. Angel Broking Limited or any of its affiliates/ group companies shall not be in any way
responsible for any loss or damage that may arise to any person from any inadvertent error in the information contained in this report.
Angel Broking Limited has not independently verified all the information contained within this document. Accordingly, we cannot testify,
nor make any representation or warranty, express or implied, to the accuracy, contents or data contained within this document. While
Angel Broking Limited endeavours to update on a reasonable basis the information discussed in this material, there may be regulatory,
compliance, or other reasons that prevent us from doing so.
This document is being supplied to you solely for your information, and its contents, information or data may not be reproduced,
redistributed or passed on, directly or indirectly.
Angel Broking Limited and its affiliates may seek to provide or have engaged in providing corporate finance, investment banking or
other advisory services in a merger or specific transaction to the companies referred to in this report, as on the date of this report or in
the past.
Neither Angel Broking Limited, nor its directors, employees or affiliates shall be liable for any loss or damage that may arise from or in
connection with the use of this information.
Note: Please refer to the important `Stock Holding Disclosure' report on the Angel website (Research Section). Also, please
refer to the latest update on respective stocks for the disclosure status in respect of those stocks. Angel Broking Limited and
its affiliates may have investment positions in the stocks recommended in this report.
Disclosure of Interest Statement
SKNL
1. Analyst ownership of the stock
No
2. Angel and its Group companies ownership of the stock
Yes
3. Angel and its Group companies' Directors ownership of the stock
No
4. Broking relationship with company covered
No
Note: We have not considered any Exposure below ` 1 lakh for Angel, its Group companies and Directors.
Ratings (Returns):
Buy (> 15%)
Accumulate (5% to 15%)
Neutral (-5 to 5%)
Reduce (-5% to 15%)
Sell (< -15%)
July 11, 2012
25
S. Kumars Nationwide | Initiating Coverage
6th Floor, Ackruti Star, Central Road, MIDC, Andheri (E), Mumbai- 400 093. Tel: (022) 39357800
Research Team
Fundamental:
Sarabjit Kour Nangra
VP-Research, Pharmaceutical
Vaibhav Agrawal
VP-Research, Banking
Bhavesh Chauhan
Sr. Analyst (Metals & Mining)
Sharan Lillaney
Analyst (Mid-cap)
V Srinivasan
Analyst (Cement, Power, FMCG)
Yaresh Kothari
Analyst (Automobile)
Nitin Arora
Analyst (Infra)
Ankita Somani
Analyst (IT, Telecom)
Varun Varma
Analyst (Banking)
Saurabh Taparia
Analyst (Banking)
Rahul Kaul
Analyst (Cap Goods, Real Estate)
Vinay Rachh
Research Associate
Amit Patil
Research Associate
Shareen Batatawala
Research Associate
Twinkle Gosar
Research Associate
Tejashwini Kumari
Research Associate
Technicals:
Shardul Kulkarni
Sr. Technical Analyst
Sameet Chavan
Technical Analyst
Sacchitanand Uttekar
Technical Analyst
Derivatives:
Siddarth Bhamre
Head - Derivatives
Institutional Sales Team:
Mayuresh Joshi
VP - Institutional Sales
Hiten Sampat
Sr. A.V.P- Institution sales
Meenakshi Chavan
Dealer
Gaurang Tisani
Dealer
Akshay Shah
Sr. Executive
Production Team:
Simran Kaur
Research Editor
Dilip Patel
Production
Angel Broking Ltd: BSE Sebi Regn No : INB 010996539 / CDSL Regn No: IN - DP - CDSL - 234 - 2004 / PMS Regn Code: PM/INP000001546 Angel Securities Ltd:BSE: INB010994639/INF010994639 NSE: INB230994635/INF230994635 Membership numbers: BSE 028/NSE:09946
Angel Capital & Debt Market Ltd: INB 231279838 / NSE FNO: INF 231279838 / NSE Member code -12798 Angel Commodities Broking (P) Ltd: MCX Member ID: 12685 / FMC Regn No: MCX / TCM / CORP / 0037 NCDEX : Member ID 00220 / FMC Regn No: NCDEX / TCM / CORP / 0302
July 11, 2012
26