Derivatives
Rollover Report
November 25, 2016
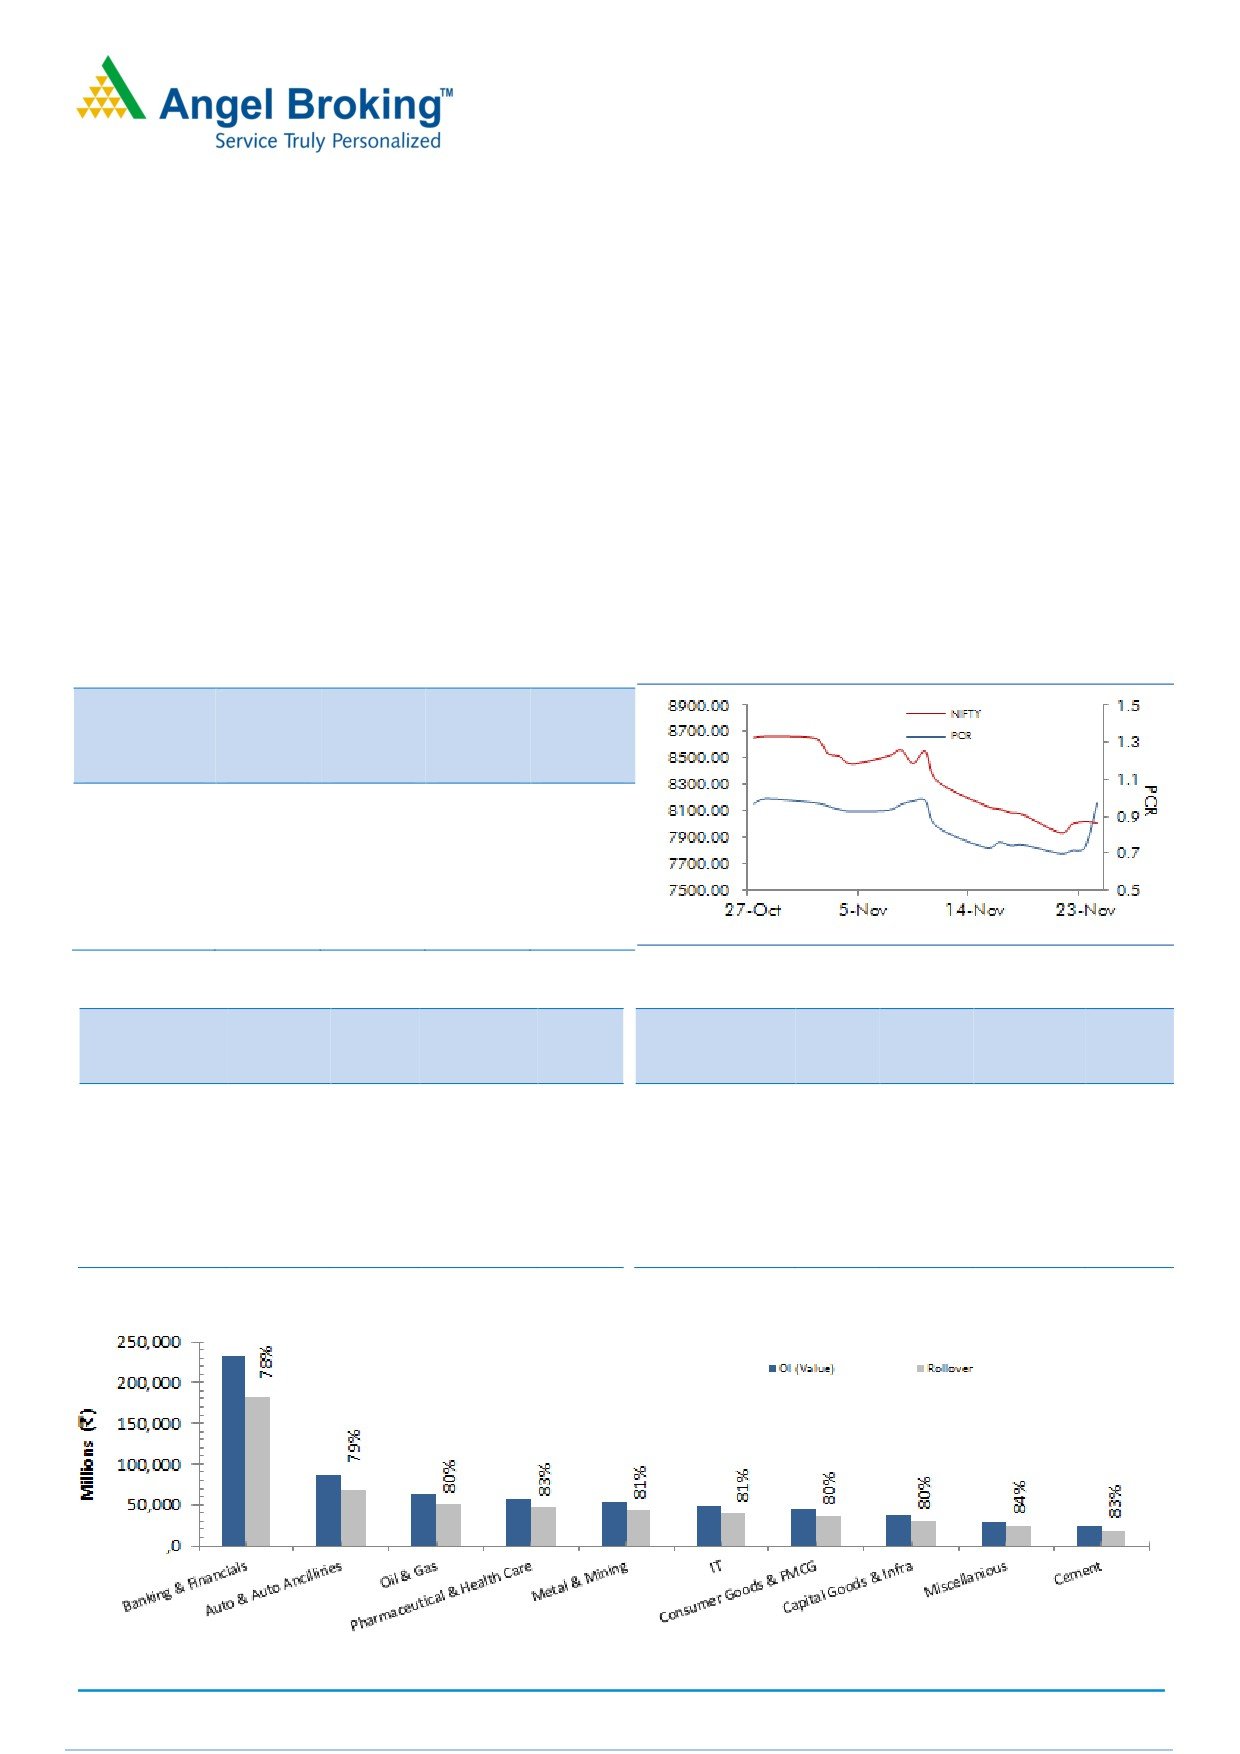
Again, December series is beginning with open interest being light. Rollover in Nifty, both in terms of percentage and
open interest, is below its averages. In first two weeks of November series, we witnessed huge amount of long
unwinding followed by short formation going ahead. FIIs curb liquidity for more than eighteen thousand crore in
November series, which was seen for the first time after March 2016. While in Index Futures, they have exited most of
their longs and formed mixed positions in last week of November series; as a result, the Long/Short ratio fell from
79.20% to 48.90%. Currently, FIIs open positions in index futures are lowest in the last two years, as they have exited
around one third of their total positions in last series. As far as Options data is concerned, 8000 & 8500 call and
8000 put options are attracting trader’s attention. At the current juncture, 7900-8000 seems to be an immediate
support zone for Nifty. Considering above data, we are unable to retrieve any clear directional hints; thus, we would
like to wait for fresh build-up before forming any directional view. Traders are advised to remain light unless we see
any meaningful activity in either direction.
As far as Rollover in BankNifty is concerned, it is below average in terms percentage; but is higher in terms of open
interest. Private Banking heavyweights were the major draggers in November series and they also added some short
positions. Now, 18850-18900 can be seen as a strong support for BankNifty; while resistance is placed at 19000-
19150 zones.
Indices Change
NIFTY & PCR Graph
Price
Change
3 month
INDEX
Price
(%)
Rollover
avg.
NIFTY
8013.10
(7.42)
63.10
66.22
BANKNIFTY
18392.25
(6.13)
61.49
64.76
NIFTYIT
9714.00
(3.95)
73.60
65.65
NIFTYMID50
3924.85
1.99
-
-
NIFTYINFRA
2828.70
(4.04)
-
-
Monthly Gainers
Monthly Losers
Price
Ol
Price
Ol
Change Open
Change
Change Open
Change
Scrip
Price
(%)
Interest
(%)
Scrip
Price
(%)
Interest
(%)
HINDALCO
180.80
21.14
38367000
9.82
JPASSOCIAT
7.15
(35.29)
142392000
(10.70)
STAR
1079.90
14.28
1561000
(34.32)
PCJEWELLER
343.35
(32.64)
727500
13.05
VEDL
222.05
11.75
41142000
13.83
DHFL
228.95
(29.85)
17025000
17.13
TECHM
460.30
10.45
7991500
(10.39)
HDIL
58.20
(27.70)
23776000
1.57
HINDZINC
274.85
9.72
8016000
37.64
INDIACEM
114.85
(26.09)
20167000
(9.69)
Note: Stocks which have more than 1000 contract in Futures OI.
Note: Stocks which have more than 1000 contract in Futures OI.
SEBI Registration No: INB 010996539
1
Derivatives Rollover Report
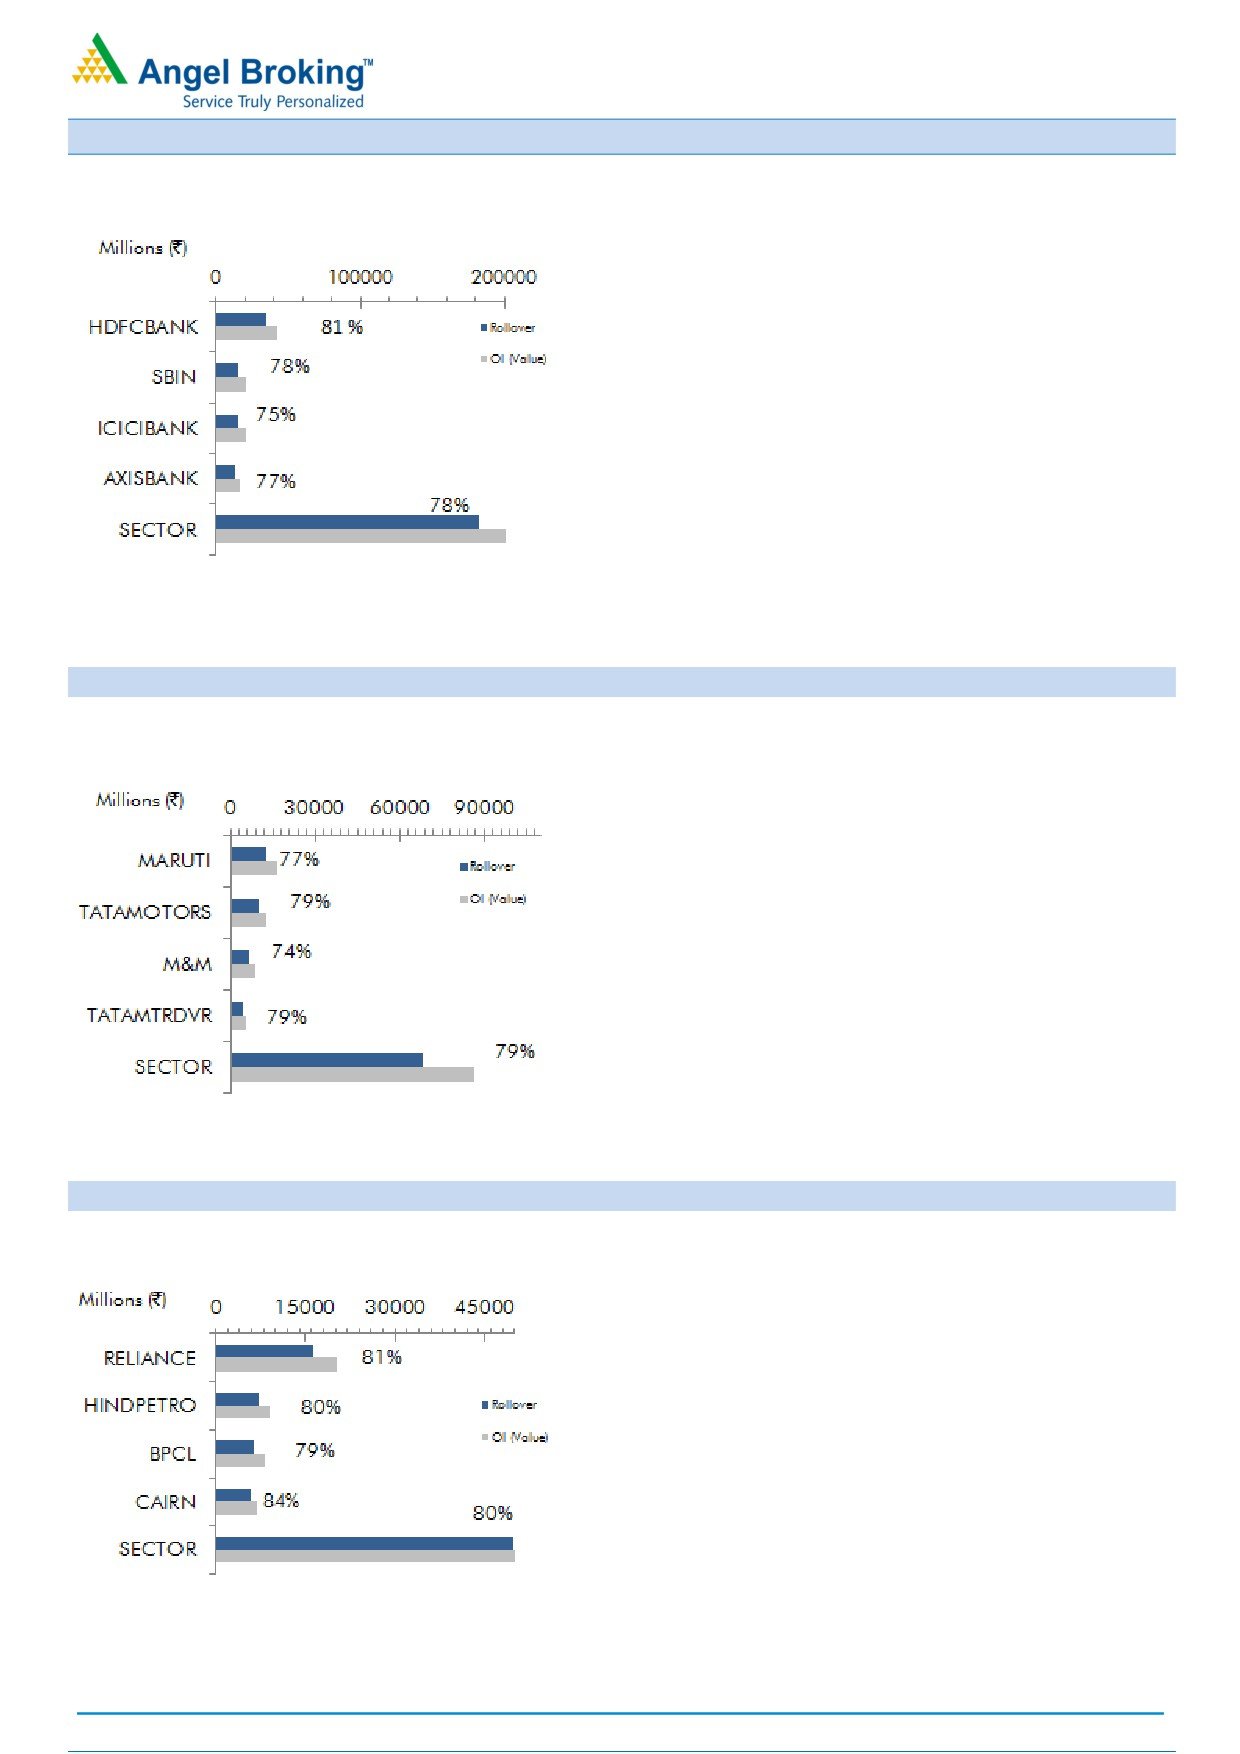
Banking and Financials
ICICIBANK
(75.48%) added huge amount of
positions in last series, most of them are on short
side. Rollover was also above average. Since, there
is no sign of reversals per derivative data; stock
may see further correction towards `240-`242
level.
BANKBARODA (77.70%) was major gainer in
heavyweight PSU banks. In last few days, the stock
added good amount of fresh longs. Stock may
continue to move higher towards its resistance of
`177-`180 zone.
Post the demonetization announcement, DHFL
(84.32%) has corrected sharply along with huge
short formations. Rollovers were also in-line with its
quarterly averages. This counter may remain under
pressure in upcoming sessions too.
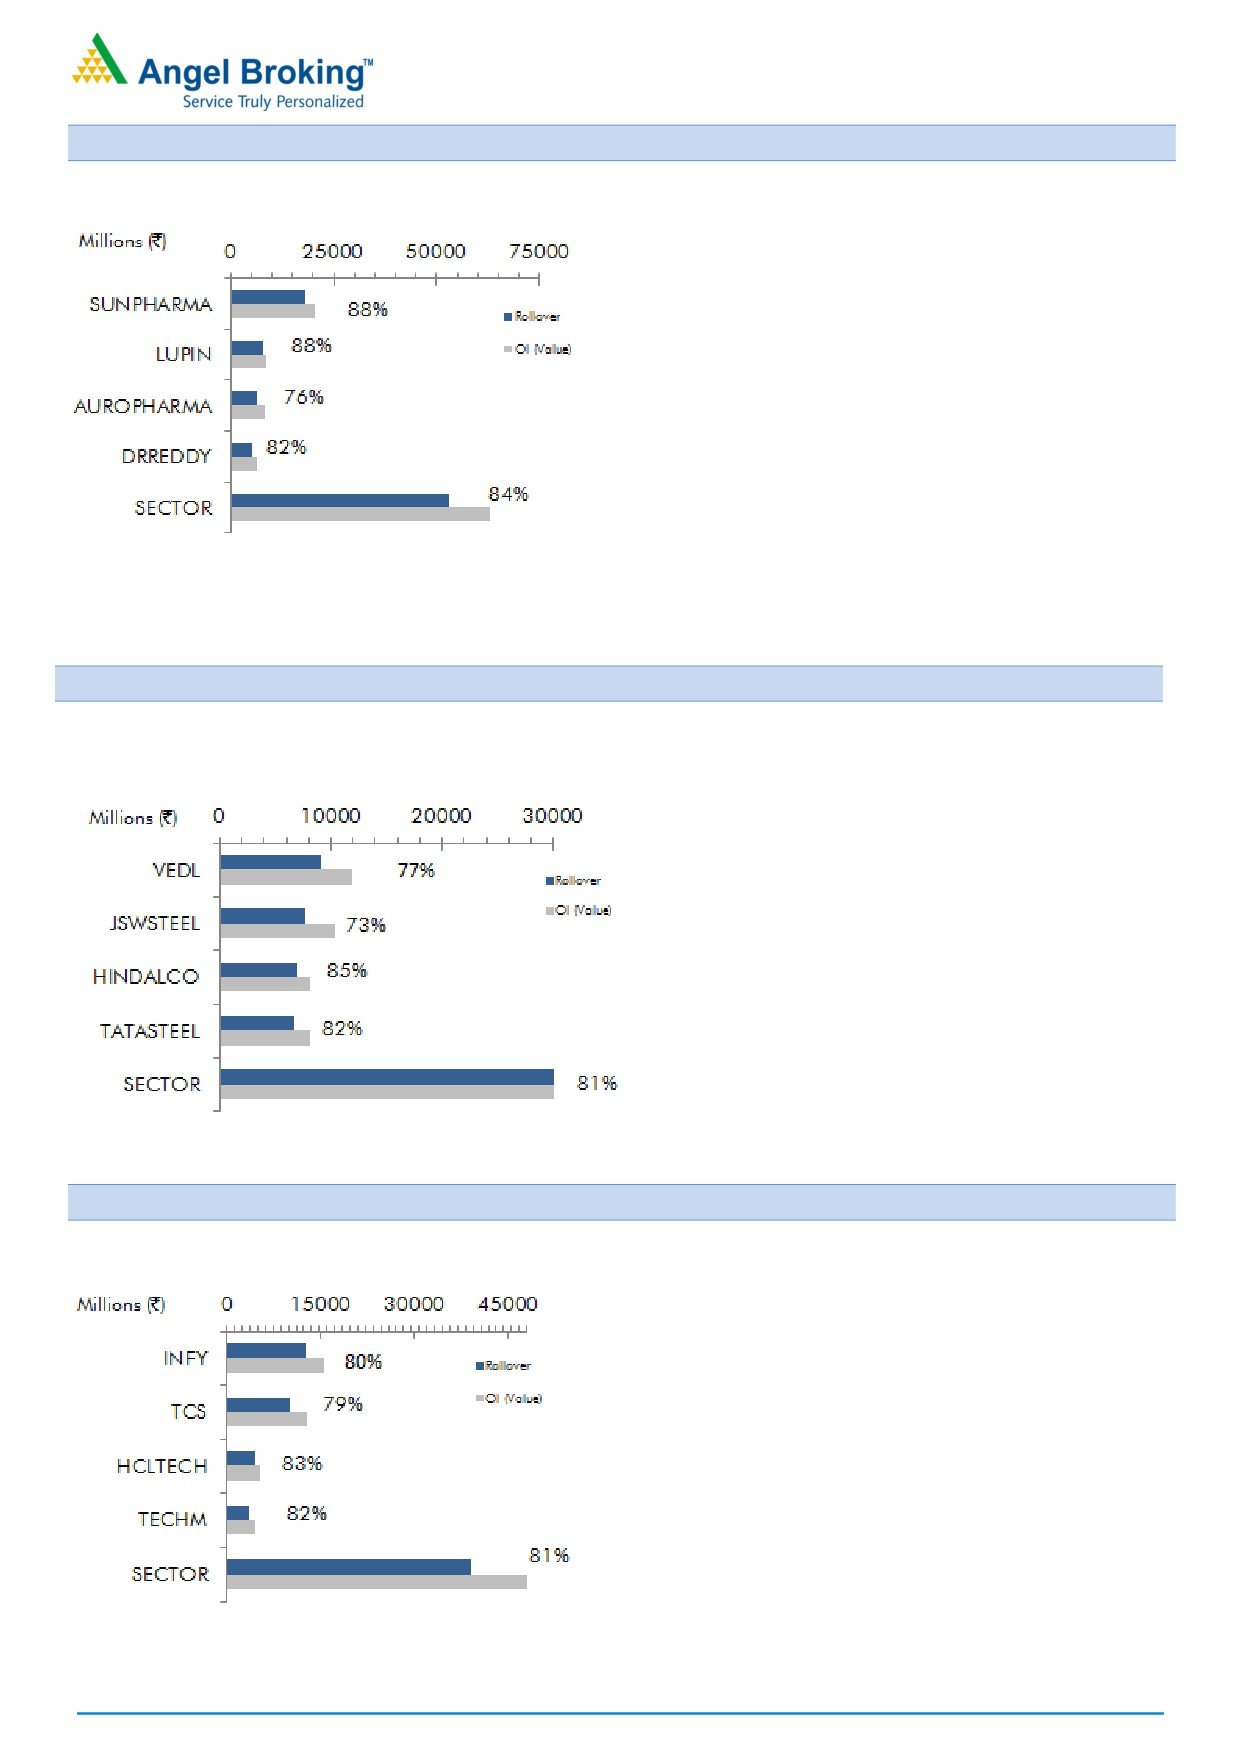
Auto & Auto Ancillaries
MARUTI (77.43%) plunged more than 17% series
on series. Most of the longs formed in October
series have been lightened, while huge amount of
fresh short positions were formed in the last few
days. `4650-`4700 is an immediate support in
this counter; traders who are short should look
towards covering their shorts at these level.
BHARATFORG (77.75%) out performed its peer
group. But, this move was mainly due to short
covering and some long formation. We expect
fresh long in this counter going ahead. Thus, it’s a
buy on dip counter for us.
TATAMOTORS (79.22%) corrected nearly 13% but
we hardly saw any meaningful short formation.
`430-`440 is a support zone for this stock and we
don’t expect it to breach, unless we see any
aggressive short formation in near term.
Oil & Gas
CAIRN’s (83.77%) bounced from `225 level with
good amount of long formation. These long
positions have been rolled too. We believe, this
stock may continue to show strength in near term,
which may bring it near `255-`256 level.
RELIANCE (80.58%), since start of November series,
remained under pressure but we hardly saw any
short formation. This stock is light in terms of open
interest and traders should wait for any meaningful
build-up in either direction before entering into
trade.
GAIL (84.37%) corrected from `450 level with good
amount of short formation and these positions have
been rolled too. This counter has a strong support
around `398-`402 level. We expect short covering
bounce in this stock. Hence, one should trade this
counter with a positive bias.
For Private Circulation Only
SEBI Registration No: INB 010996539
2
Derivatives Rollover Report
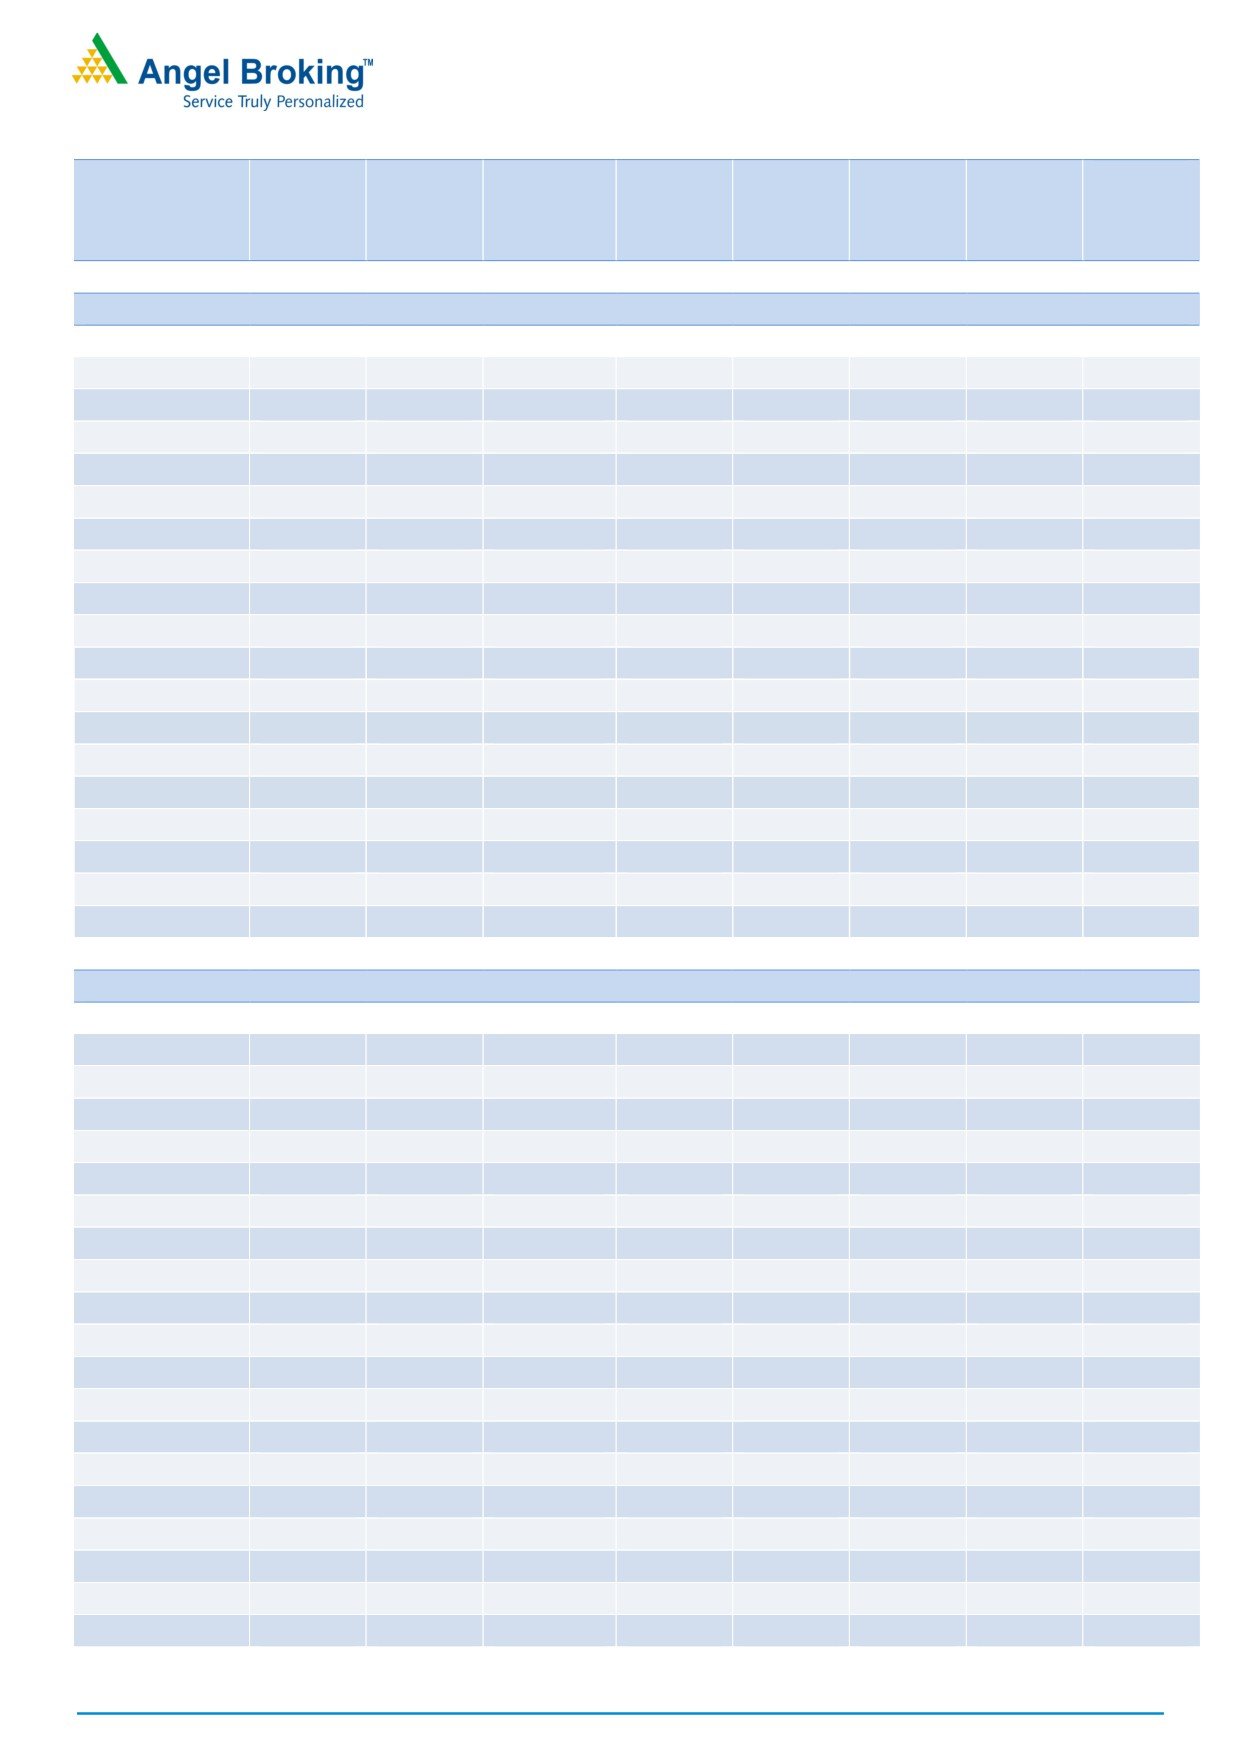
Pharmaceuticals
SUNPHARMA (88.23%) has seen decent correction
in first half of November series with formation of
fresh shorts. However, the stock consolidated in
later half with some unwinding. We may see
further short covering bounce in the counter on a
sustainable move above its resistance at `710-
`715 zones.
AUROPHARMA (75.70%) has corrected sharply in
last series; but we didn’t witness any short
formation in that fall. Currently, the stock is very
light in terms of OI and thus traders are advised to
wait for some fresh build-up before initiating any
positional trade in the counter.
STAR (89.00%) was the top gainer in this space,
but we hardly saw any long formation in last
series. Rollovers are also in-line with averages.
Traders should book profit in longs on rallies.
Metal & Mining
TATASTEEL (82.21%) remained flat on MoM basis.
We witnessed decent amount of unwinding in last
series and as a result, stock is light on positions.
Fresh build-up in next series will decide further
move in the counter.
VEDL (76.77%) is attracting long positions from
last couple of months. Up moves in the counter
was on back of fresh long build-up; while
corrective moves were not supported by fresh
positions. The stock may breach its resistance of
`230-`232 and move higher in near term.
HINDALCO (85.31%) and HINDZINC (83.78%)
were major gainers in this sector with huge OI
build-up. Most of them are on long side and got
rolled too. Traders are advised to trade these
counters with positive bias.
IT
INFY counter corrected from
`1030 level with
decent amount of short positions. Recently, stock
rebounded from lower levels, wherein, we
witnessed short covering and some fresh long
build-up in the stock. We expect some short
covering bounce in this counter which may bring it
near `980-`986 level.
TCS
(78.58%) has added highest positions in
percentage terms in this sector. These positions are
mixed and rolled too. Stock is rebounding from its
support of `2100-`2050 and we may see some
short covering move in upcoming sessions too.
TECHM (81.91%) was the major gainer in this
space. However, the up move was not supported
by significant long positions. Thus, traders should
lighten up their existing longs in the counter.
For Private Circulation Only
SEBI Registration No: INB 010996539
3
Derivatives Rollover Report
Average
Price
OI
Rollover
Change
Change
Rollover
(3month)
Scrip
Price
(%)
OI Futures
(%)
COC (%)
PCR-OI
(%)
(%)
AUTO & AUTO ANCILLARIES
AMARAJABAT
917.30
(8.88)
561000
(7.33)
-2.10
0.73
72.26
75.39
APOLLOTYRE
178.90
(10.97)
9396000
(6.79)
4.98
0.48
81.84
80.35
ASHOKLEY
76.10
(10.94)
54754000
(19.58)
6.20
0.54
84.49
81.63
BAJAJ-AUTO
2641.95
(4.87)
1262750
(11.07)
4.38
1.08
71.66
73.61
BHARATFORG
911.30
5.73
3391200
(37.62)
-2.80
0.29
77.75
83.21
BOSCHLTD
18923.60
(15.35)
75350
(22.00)
5.29
0.00
77.80
77.67
CASTROLIND
387.35
(15.88)
11060000
(21.98)
7.18
0.94
87.10
87.79
CEATLTD
1156.80
(4.04)
805700
(35.19)
5.35
0.58
66.80
66.28
EICHERMOT
20443.05
(17.12)
146800
10.38
4.43
0.20
77.59
77.51
EXIDEIND
172.10
(9.85)
16072000
(34.54)
6.40
0.81
88.64
88.96
HEROMOTOCO
3057.90
(8.35)
1172200
(26.60)
2.03
1.29
76.58
77.38
M&M
1170.25
(10.31)
5579000
(18.90)
5.87
1.00
74.01
77.04
MARUTI
4857.60
(17.61)
2631000
22.27
5.93
0.87
77.43
75.50
MOTHERSUMI
296.80
(9.88)
9930000
6.00
2.29
1.05
88.19
79.49
MRF
47334.60
1.35
22980
(53.49)
2.65
0.00
85.59
88.17
TATAMOTORS
455.65
(13.24)
21684000
(23.51)
6.22
0.59
79.22
78.43
TATAMTRDVR
288.75
(15.17)
15201900
(16.49)
8.01
0.58
79.21
80.66
TVSMOTOR
351.00
(14.08)
4978000
(20.63)
-25.93
0.90
69.14
69.99
BANKING & FINANCIALS
ALBK
67.10
(11.01)
12900000
(11.83)
7.04
1.08
78.56
80.48
ANDHRABANK
51.40
(8.21)
18040000
(10.91)
7.15
1.18
82.11
81.66
AXISBANK
471.15
(3.43)
27997200
(20.96)
6.57
0.66
77.13
75.99
BAJFINANCE
824.60
(25.82)
6305750
6.02
4.96
1.13
87.07
87.22
BANKBARODA
167.95
8.99
36396500
(16.51)
5.62
0.59
77.70
81.21
BANKINDIA
120.50
6.03
19788000
(2.54)
3.91
0.77
74.30
82.66
BHARATFIN
688.00
(22.34)
4883000
(27.72)
5.41
0.35
82.01
86.31
CANBK
306.90
(2.73)
6504000
(28.12)
3.24
0.65
72.58
73.68
DCBBANK
106.95
(16.64)
1746000
18.29
6.38
1.63
74.19
-
DHFL
228.95
(29.85)
17025000
17.13
5.96
0.68
84.32
84.14
FEDERALBNK
68.40
(16.74)
54472000
35.45
7.68
0.57
84.23
84.46
HDFC
1224.55
(11.48)
7925000
(19.57)
5.91
0.65
76.19
76.24
HDFCBANK
1175.75
(6.52)
29661000
(0.07)
9.17
0.76
80.89
85.00
IBULHSGFIN
679.80
(19.22)
7780800
13.25
4.78
0.45
82.71
84.68
ICICIBANK
260.95
(8.52)
60737500
32.38
6.64
0.46
75.48
72.56
IDBI
67.00
(10.61)
32640000
0.32
3.12
1.16
83.81
80.82
IDFCBANK
68.55
(11.83)
25168000
0.06
6.12
0.88
78.81
-
IDFC
55.45
(19.23)
58000800
(2.20)
3.78
0.53
91.62
88.03
IFCI
22.85
(12.28)
56474000
(17.14)
-9.05
0.65
67.87
79.21
For Private Circulation Only
SEBI Registration No: INB 010996539
4
Derivatives Rollover Report
Average
Price
OI
Rollover
Change
Change
Rollover
(3month)
Scrip
Price
(%)
OI Futures
(%)
COC (%)
PCR-OI
(%)
(%)
INDUSINDBK
1051.35
(11.23)
4873800
22.95
6.94
0.68
74.28
72.10
KOTAKBANK
747.10
(7.63)
7619200
0.12
7.03
0.65
68.16
72.66
KTKBANK
101.80
(16.11)
16166000
(0.23)
3.60
0.63
87.79
85.04
L&TFH
83.40
(21.62)
28098000
(23.85)
6.29
0.64
84.15
83.93
LICHSGFIN
521.90
(11.35)
6284300
(15.90)
3.71
0.60
78.21
78.22
M&MFIN
278.60
(24.16)
7810000
(39.59)
4.70
1.06
74.58
79.15
ORIENTBANK
120.00
(8.85)
12048000
20.17
0.43
0.97
73.15
79.22
PFC
127.10
1.60
8742000
(52.34)
-1.64
0.25
43.82
65.17
PNB
138.50
(2.98)
34405000
(15.05)
4.92
0.64
84.81
84.05
RECLTD
133.05
(2.28)
26454000
(9.65)
4.72
0.40
85.55
85.98
RELCAPITAL
425.60
(18.24)
11002500
(11.91)
6.04
0.75
84.56
80.49
SBIN
263.05
2.37
60822000
(1.69)
5.18
0.58
77.97
79.39
SOUTHBANK
20.65
(12.68)
38100000
(12.41)
7.63
0.31
84.95
86.37
SRTRANSFIN
877.55
(19.82)
3172800
(5.08)
7.06
0.25
75.51
79.60
SYNDIBANK
66.30
(10.53)
15075000
(14.06)
3.95
0.37
82.80
77.23
UNIONBANK
150.85
4.18
10604000
(20.84)
-4.47
0.72
80.68
84.45
YESBANK
1125.75
(10.78)
7606200
(6.38)
5.49
0.59
72.73
73.96
CAPITAL GOODS & INFRASTRUCTURE
ADANIPORTS
258.85
(15.71)
12497500
(31.73)
4.65
0.62
79.00
78.52
BEML
789.25
(14.92)
671300
(34.06)
3.91
0.52
84.25
87.23
BHEL
125.05
(10.17)
33100000
(7.63)
5.45
0.68
73.01
80.60
CROMPGREAV
75.05
0.87
6192000
(42.73)
3.49
0.67
62.55
72.21
ENGINERSIN
278.10
3.17
4648000
(52.02)
2.82
0.43
79.28
83.59
GMRINFRA
11.15
(18.61)
166590000
(11.41)
9.44
1.08
87.64
87.77
HAVELLS
335.70
(18.05)
2996000
(17.10)
3.12
0.83
75.89
75.04
IRB
186.00
(21.09)
9735000
(3.42)
-1.12
0.56
83.44
80.82
JPASSOCIAT
7.15
(35.29)
142392000
(10.70)
7.34
0.64
87.21
84.74
LT
1357.60
(8.39)
6596000
1.61
6.14
0.75
79.74
78.28
RELINFRA
453.25
(17.03)
8312200
(30.27)
6.13
0.81
82.77
82.12
SIEMENS
1052.95
(11.00)
823500
(0.78)
5.63
0.60
83.31
82.74
VOLTAS
297.55
(22.39)
3154000
(9.00)
-8.00
1.15
70.72
77.45
CEMENT
ACC
1329.65
(13.37)
1125600
(7.22)
3.54
1.60
80.35
78.81
AMBUJACEM
201.90
(17.54)
15685000
48.46
3.37
0.43
78.50
76.35
GRASIM
814.90
(15.52)
7679250
(12.63)
5.98
5.82
86.19
86.13
INDIACEM
114.85
(26.09)
20167000
(9.69)
6.40
0.72
83.58
85.42
ULTRACEMCO
3473.70
(12.21)
1585400
82.94
-3.01
1.98
81.69
73.73
For Private Circulation Only
SEBI Registration No: INB 010996539
5
Derivatives Rollover Report
Average
Price
OI
Rollover
Change
Change
Rollover
(3month)
Scrip
Price
(%)
OI Futures
(%)
COC (%)
PCR-OI
(%)
(%)
CHEMICAL & FERTILIZERS
PIDILITIND
614.55
(13.89)
1238000
(35.25)
4.17
0.75
73.21
80.49
TATACHEM
456.50
(15.81)
5044500
(28.06)
-3.19
1.48
81.92
87.58
UPL
612.35
(13.83)
4804800
(14.21)
5.31
0.94
81.93
85.56
CONSUMER GOODS & FMCG
ASIANPAINT
939.95
(13.84)
4148400
(9.95)
4.29
0.74
67.91
74.44
BRITANNIA
2957.90
(8.40)
973400
(3.49)
5.44
1.00
88.75
88.25
COLPAL
929.70
(1.16)
434000
(45.66)
-5.52
1.50
75.98
70.26
DABUR
276.90
(4.37)
12140000
85.27
2.45
0.44
88.08
86.95
GODREJCP
1438.60
(9.31)
427600
39.01
2.69
-
73.07
75.65
HINDUNILVR
829.45
(0.90)
4557600
(24.35)
5.24
0.69
76.21
76.36
ITC
224.75
(7.98)
41112000
3.17
5.83
0.81
76.07
73.61
JUBLFOOD
855.70
(14.40)
1875000
(8.56)
0.06
0.87
83.78
83.23
MARICO
251.50
(10.29)
7662200
(11.77)
5.21
3.67
88.26
90.75
MCLEODRUSS
147.10
(13.32)
4326000
(27.39)
7.14
1.10
77.03
80.54
TATAGLOBAL
115.80
(16.48)
28984500
(9.84)
6.34
1.09
89.38
89.50
TITAN
309.00
(16.88)
9721500
1.71
4.92
0.90
86.10
89.25
UBL
864.60
(1.31)
1060500
(7.68)
3.02
0.82
71.46
77.74
INFORMATION TECHNOLOGY
HCLTECH
771.70
(1.00)
5844300
2.18
5.30
0.61
83.08
78.54
HEXAWARE
191.15
(4.90)
4044000
(34.69)
6.59
0.44
80.94
83.31
INFY
935.85
(7.39)
13375500
5.46
6.22
0.66
79.83
76.09
KPIT
126.90
(12.90)
3712000
(15.41)
3.71
1.70
83.60
81.57
MINDTREE
464.70
5.45
3002400
(8.86)
4.17
1.08
85.06
84.97
NIITTECH
402.20
(2.39)
603500
(37.72)
5.47
2.50
88.30
84.04
OFSS
2976.95
(7.17)
208350
(8.98)
6.40
0.00
86.01
83.60
TATAELXSI
1163.30
(6.78)
1949800
(4.13)
4.77
0.25
87.67
85.14
TCS
2198.80
(9.32)
4605500
5.56
4.93
0.82
78.58
75.43
TECHM
460.30
10.45
7991500
(10.39)
3.75
0.67
81.91
80.44
WIPRO
453.20
(2.40)
5601200
(17.23)
5.67
1.36
75.31
75.36
MEDIA
DISHTV
82.20
(14.46)
36393000
15.76
6.38
0.60
86.74
84.74
SUNTV
446.90
(17.02)
7340000
(18.41)
5.87
0.92
87.26
87.63
TV18BRDCST
35.80
(19.37)
76534000
(4.15)
8.81
1.10
91.78
91.21
ZEEL
441.50
(13.06)
9075300
(17.20)
5.70
0.98
79.27
79.73
For Private Circulation Only
SEBI Registration No: INB 010996539
6
Derivatives Rollover Report
Average
Price
OI
Rollover
Change
Change
Rollover
(3month)
Scrip
Price
(%)
OI Futures
(%)
COC (%)
PCR-OI
(%)
(%)
METALS & MINING
COALINDIA
302.10
(5.09)
11621200
(9.13)
6.08
1.48
79.43
77.93
HINDALCO
180.80
21.14
38367000
9.82
2.02
0.90
85.31
80.21
HINDZINC
274.85
9.72
8016000
37.64
5.72
0.50
83.78
73.97
JINDALSTEL
65.00
(15.53)
43641000
(7.13)
4.84
0.47
90.70
92.11
JSWSTEEL
1622.90
(1.56)
4694100
(25.79)
5.26
0.71
73.43
80.42
NMDC
120.25
(2.87)
17376000
36.54
5.23
0.74
87.33
85.43
SAIL
47.80
(4.59)
51192000
(23.36)
-19.27
0.66
85.00
87.49
TATASTEEL
399.30
(0.14)
16744000
(16.20)
3.01
0.58
82.21
80.58
VEDL
222.05
11.75
41142000
13.83
1.18
0.77
76.99
79.52
MISCELLANIOUS
ABIRLANUVO
1178.05
(14.65)
3405400
(23.29)
4.40
3.62
86.78
85.86
ADANIENT
62.00
(7.81)
15512000
(14.96)
5.92
0.70
83.87
85.05
BATAINDIA
403.60
(15.46)
3478200
10.87
2.72
0.93
83.81
81.87
BEL
1306.45
3.04
1152450
19.90
6.38
1.00
84.72
72.78
CONCOR
1182.10
(13.43)
541000
6.60
-2.29
0.28
76.96
67.98
CUMMINSIND
778.10
(9.11)
503400
(11.22)
2.69
0.87
85.35
82.55
GODREJIND
369.20
(16.56)
1383000
(5.73)
5.97
2.00
81.45
81.37
JETAIRWAYS
356.05
(22.22)
5134000
(22.11)
6.19
0.52
86.53
87.12
JISLJALEQS
84.25
(21.48)
35505000
(10.58)
4.35
0.75
88.67
86.95
JUSTDIAL
352.00
(14.80)
3848800
(5.72)
-46.15
1.02
84.61
80.83
KSCL
384.90
(10.71)
2316000
4.39
-1.89
0.21
75.21
79.21
MCDOWELL-N
1859.20
(18.61)
2828750
(17.08)
4.54
1.26
84.88
85.69
PCJEWELLER
343.35
(32.64)
727500
13.05
-85.21
1.00
49.90
63.37
SINTEX
72.55
(15.79)
28478625
(19.55)
6.51
0.62
85.19
87.61
OIL & GAS
BPCL
637.40
(5.81)
10050000
(23.53)
-1.14
0.87
78.87
83.44
CAIRN
245.70
9.13
23443000
31.36
6.19
0.50
83.77
82.07
GAIL
404.40
(7.62)
6598500
20.85
4.79
0.70
84.37
78.10
HINDPETRO
450.55
(0.85)
16134300
(20.51)
-3.69
0.64
79.80
87.28
IGL
830.85
(2.18)
904200
(41.41)
-5.87
1.11
70.68
74.16
IOC
295.10
(6.35)
16284000
(29.72)
4.08
0.46
78.72
80.12
OIL
439.90
6.06
834700
(50.05)
1.31
0.86
76.36
73.32
ONGC
278.90
(3.04)
14380000
(21.60)
6.21
0.50
79.22
76.01
PETRONET
371.35
(3.13)
4090500
(35.62)
3.24
0.59
72.03
78.44
RELIANCE
992.85
(5.87)
16396000
(24.64)
5.81
0.60
80.58
81.18
For Private Circulation Only
SEBI Registration No: INB 010996539
7
Derivatives Rollover Report
Average
Price
OI
Rollover
Change
Change
Rollover
(3month)
Scrip
Price
(%)
OI Futures
(%)
COC (%)
PCR-OI
(%)
(%)
PHARMACEUTICAL
AJANTPHARM
1785.10
(9.93)
312800
(28.13)
5.67
0.92
78.67
80.22
APOLLOHOSP
1229.40
(8.20)
434800
(15.47)
-2.71
0.63
69.95
81.28
AUROPHARMA
713.85
(12.09)
8842400
(25.65)
6.17
0.70
75.70
82.16
BIOCON
861.10
(7.07)
2381300
(48.76)
7.07
0.97
80.75
84.52
CADILAHC
397.95
0.10
2892800
15.97
4.47
0.33
84.17
88.15
CIPLA
555.40
(5.41)
5823000
0.94
3.30
0.61
81.20
80.82
DIVISLAB
1153.75
(10.18)
1129200
(12.59)
5.54
1.00
80.36
74.73
DRREDDY
3121.15
(6.54)
1680000
17.25
3.17
0.84
81.66
76.44
GLENMARK
893.95
(1.66)
2020900
(6.99)
5.45
1.04
83.78
85.12
GRANULES
105.15
(13.95)
9470000
(32.33)
8.00
0.23
88.80
88.99
LUPIN
1466.65
(1.58)
5276400
(18.98)
5.83
0.65
88.05
84.53
STAR
1079.90
14.28
1561000
(34.32)
4.75
0.35
89.00
87.45
SUNPHARMA
686.20
(8.49)
26382300
3.05
5.65
0.70
88.23
84.94
TORNTPHARM
1347.85
(6.14)
214000
(42.16)
0.70
1.50
77.09
75.45
WOCKPHARMA
672.65
(21.70)
3120000
(11.46)
0.93
1.18
86.14
84.12
POWER
ADANIPOWER
24.25
(10.19)
103040000
(18.57)
8.67
0.62
86.60
80.33
CESC
570.70
(7.62)
1961300
14.59
4.22
2.60
73.95
75.75
JSWENERGY
55.15
(15.80)
24152000
(4.82)
6.66
1.21
88.98
86.59
NHPC
26.50
2.51
18144000
(2.04)
5.94
0.47
74.92
74.50
NTPC
157.85
3.44
14648000
6.70
5.65
0.33
81.74
75.22
POWERGRID
186.10
5.47
16868000
5.69
5.92
0.33
73.52
72.99
PTC
70.85
(3.80)
14728000
(0.81)
2.21
0.88
78.37
85.58
RPOWER
38.85
(17.52)
53544000
(9.77)
5.40
0.56
85.84
86.50
TATAPOWER
69.60
(13.05)
19809000
(7.83)
3.01
1.16
74.84
76.71
TORNTPOWER
172.35
(0.40)
1977000
2.49
5.17
0.13
85.25
-
REAL ESTATE
DLF
113.70
(24.05)
29805000
(29.71)
6.00
0.89
83.08
84.47
HDIL
58.20
(27.70)
23776000
1.57
6.31
0.92
82.88
81.70
IBREALEST
66.80
(24.09)
26380000
(28.53)
7.07
0.43
78.63
83.45
NCC
73.45
(19.77)
14560000
(49.92)
8.59
1.11
83.91
86.18
TELECOM
BHARTIARTL
301.75
(6.55)
23584900
1.80
-2.24
1.12
84.35
81.21
IDEA
71.70
(8.02)
56862000
(14.30)
3.65
0.65
84.76
82.59
INFRATEL
362.30
1.70
2843400
(18.79)
5.50
0.22
68.38
69.88
RCOM
34.70
(24.97)
86372000
(17.12)
6.05
0.49
88.00
82.97
TATACOMM
636.95
0.70
4501000
(26.01)
5.76
0.89
83.20
85.53
For Private Circulation Only
SEBI Registration No: INB 010996539
8
Derivatives Rollover Report
TEXTILES
ARVIND
347.15
(16.76)
4570000
(36.70)
3.31
0.83
78.98
79.83
CENTURYTEX
742.75
(17.12)
6400900
(14.69)
4.87
0.56
89.77
90.54
ICIL
137.30
(13.79)
3081000
(20.14)
3.81
0
78.46
82.33
PAGEIND
12496.05
(24.15)
34300
(4.19)
1.27
0.00
76.31
82.35
SRF
1456.15
(20.13)
344500
(28.53)
2.98
1.52
70.38
74.21
Research Team Tel: 022 - 39357800
DISCLAIMER
Angel Broking Private Limited (hereinafter referred to as “Angel”) is a registered Member of National Stock Exchange of India Limited, Bombay Stock
Exchange Limited and MCX Stock Exchange Limited. It is also registered as a Depository Participant with CDSL and Portfolio Manager with SEBI. It
also has registration with AMFI as a Mutual Fund Distributor. Angel Broking Private Limited is a registered entity with SEBI for Research Analyst in
terms of SEBI (Research Analyst) Regulations, 2014 vide registration number INH000000164. Angel or its associates has not been debarred/
suspended by SEBI or any other regulatory authority for accessing /dealing in securities Market. Angel or its associates including its relatives/analyst
do not hold any financial interest/beneficial ownership of more than 1% in the company covered by Analyst. Angel or its associates/analyst has not
received any compensation / managed or co-managed public offering of securities of the company covered by Analyst during the past twelve
months. Angel/analyst has not served as an officer, director or employee of company covered by Analyst and has not been engaged in market
making activity of the company covered by Analyst.
This document is solely for the personal information of the recipient, and must not be singularly used as the basis of any investment decision.
Nothing in this document should be construed as investment or financial advice. Each recipient of this document should make such investigations as
they deem necessary to arrive at an independent evaluation of an investment in the securities of the companies referred to in this document
(including the merits and risks involved), and should consult their own advisors to determine the merits and risks of such an investment.
Reports based on technical and derivative analysis center on studying charts of a stock's price movement, outstanding positions and trading volume,
as opposed to focusing on a company's fundamentals and, as such, may not match with a report on a company's fundamentals.
The information in this document has been printed on the basis of publicly available information, internal data and other reliable sources believed to
be true, but we do not represent that it is accurate or complete and it should not be relied on as such, as this document is for general guidance only.
Angel Broking Pvt. Limited or any of its affiliates/ group companies shall not be in any way responsible for any loss or damage that may arise to any
person from any inadvertent error in the information contained in this report. Angel Broking Pvt. Limited has not independently verified all the
information contained within this document. Accordingly, we cannot testify, nor make any representation or warranty, express or implied, to the
accuracy, contents or data contained within this document. While Angel Broking Pvt. Limited endeavors to update on a reasonable basis the
information discussed in this material, there may be regulatory, compliance, or other reasons that prevent us from doing so.
This document is being supplied to you solely for your information, and its contents, information or data may not be reproduced, redistributed or
passed on, directly or indirectly.
Neither Angel Broking Pvt. Limited, nor its directors, employees or affiliates shall be liable for any loss or damage that may arise from or in
connection with the use of this information.
Note: Please refer to the important ‘Stock Holding Disclosure' report on the Angel website (Research Section). Also, please refer to the latest update
on respective stocks for the disclosure status in respect of those stocks. Angel Broking Pvt. Limited and its affiliates may have investment positions in
the stocks recommended in this report.
Derivative Research Team
For Private Circulation Only
SEBI Registration No: INB 010996539
9