Derivatives
Rollover Report
March 31, 2017
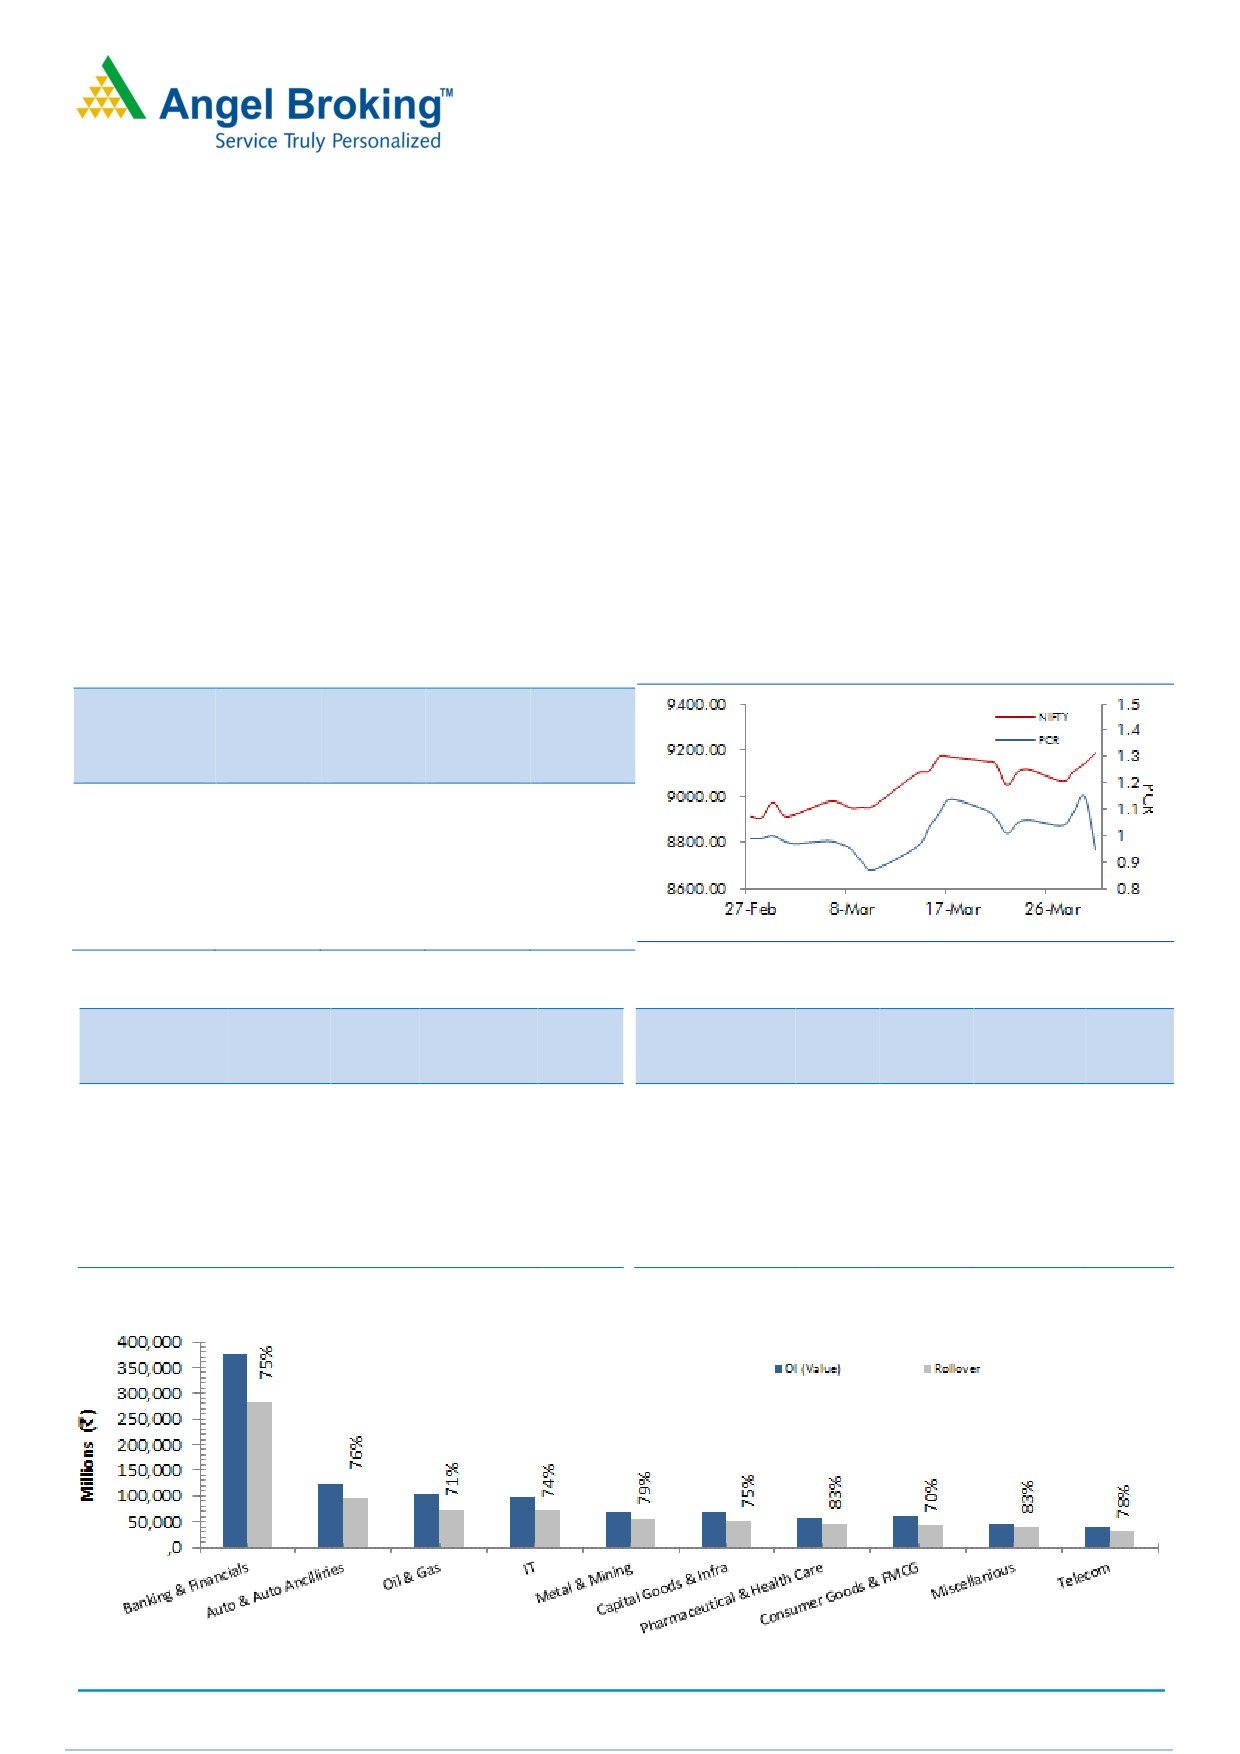
March series is the historical one for our market as the Nifty ended the F&O expiry above 9000 mark for the first time.
Despite being the eventful month (elections in four states), the March series began with healthy positions and kept on adding
further open interest during the month. The rollover is low in percentage terms; while it’s high in terms of OI. This is the
fourth consecutive month, when Nifty ended the series on a positive note (Month on Month basis) and FIIs too participated
heavily in this up move. FIIs added decent amount of long positions in index futures; however, they also added some short
positions in last few sessions, which resulted into decreasing the ‘Long Short Ratio’ from 82.90% to 76.70%. As far as their
activity in cash segment is concerned (in March series), we witnessed huge buying interest from FIIs’ desk after many years.
They bought equities worth more than `28,000 crores (including couple of block deals). It clearly depicts buying by stronger
hands, which certainly augurs well for our market with a directional perspective. In options segment, highest OI in April
series is placed at 9500 and 9200 call option; while in put option, it is placed at 9000 put option. Considering all these
data points, we believe that ongoing optimism should continue in the forthcoming series too.
Rollover in BANKNIFTY is marginally lower in terms of open interest; whiles it’s above its quarterly average in percentage
terms. Rollover data is hinting that majority of the longs formed have been rolled too. Some Midcap PSU Banks like
ORIENTBANK (81.73), BANKINDIA (81.25%) and UNIONBANK (72.56%) has seen decent rally in last series; but, their open
interest data is not so encouraging. While, some NBFCs like IBULHSGFIN (86.42%), DHFL (87.33%), RELCAPITAL (81.65%),
M&MFIN (76.54%) and L&TFH (81.95%) had seen decent rally in March series along with formation of long positions. The
overall data of BANKNIFTY is positive and thus we may see further rally in the banking space.
Indices Change
NIFTY & PCR Graph
Price
Change
3 month
INDEX
Price
(%)
Rollover
avg.
NIFTY
9189.50
2.61
67.66
71.36
BANKNIFTY
21545.45
3.19
67.57
62.78
NIFTYIT
10732.00
0.08
77.86
82.16
NIFTYMID50
3981.70
7.58
-
-
NIFTYINFRA
2940.90
7.64
-
-
Monthly Gainers
Monthly Losers
Price
Ol
Price
Ol
Change Open
Change
Change Open
Change
Scrip
Price
(%)
Interest
(%)
Scrip
Price
(%)
Interest
(%)
JETAIRWAYS
535.50
25.96
5705000
4.58
IDEA
87.65
(26.65)
92295000
29.71
ICIL
197.20
22.60
9338000
134.45
DIVISLAB
626.80
(16.68)
10145400
100.84
HDIL
82.25
19.64
20336000
(22.71)
APOLLOHOSP
1163.80
(12.35)
1513200
138.22
KSCL
545.90
19.18
2883000
(0.41)
DRREDDY
2628.85
(9.50)
3425000
29.31
RECLTD
180.20
18.98
26790000
(12.49)
IDBI
75.05
(8.64)
38368000
58.13
Note: Stocks which have more than 1000 contract in Futures OI.
Note: Stocks which have more than 1000 contract in Futures OI.
SEBI Registration No: INB 010996539
1
Derivatives Rollover Report
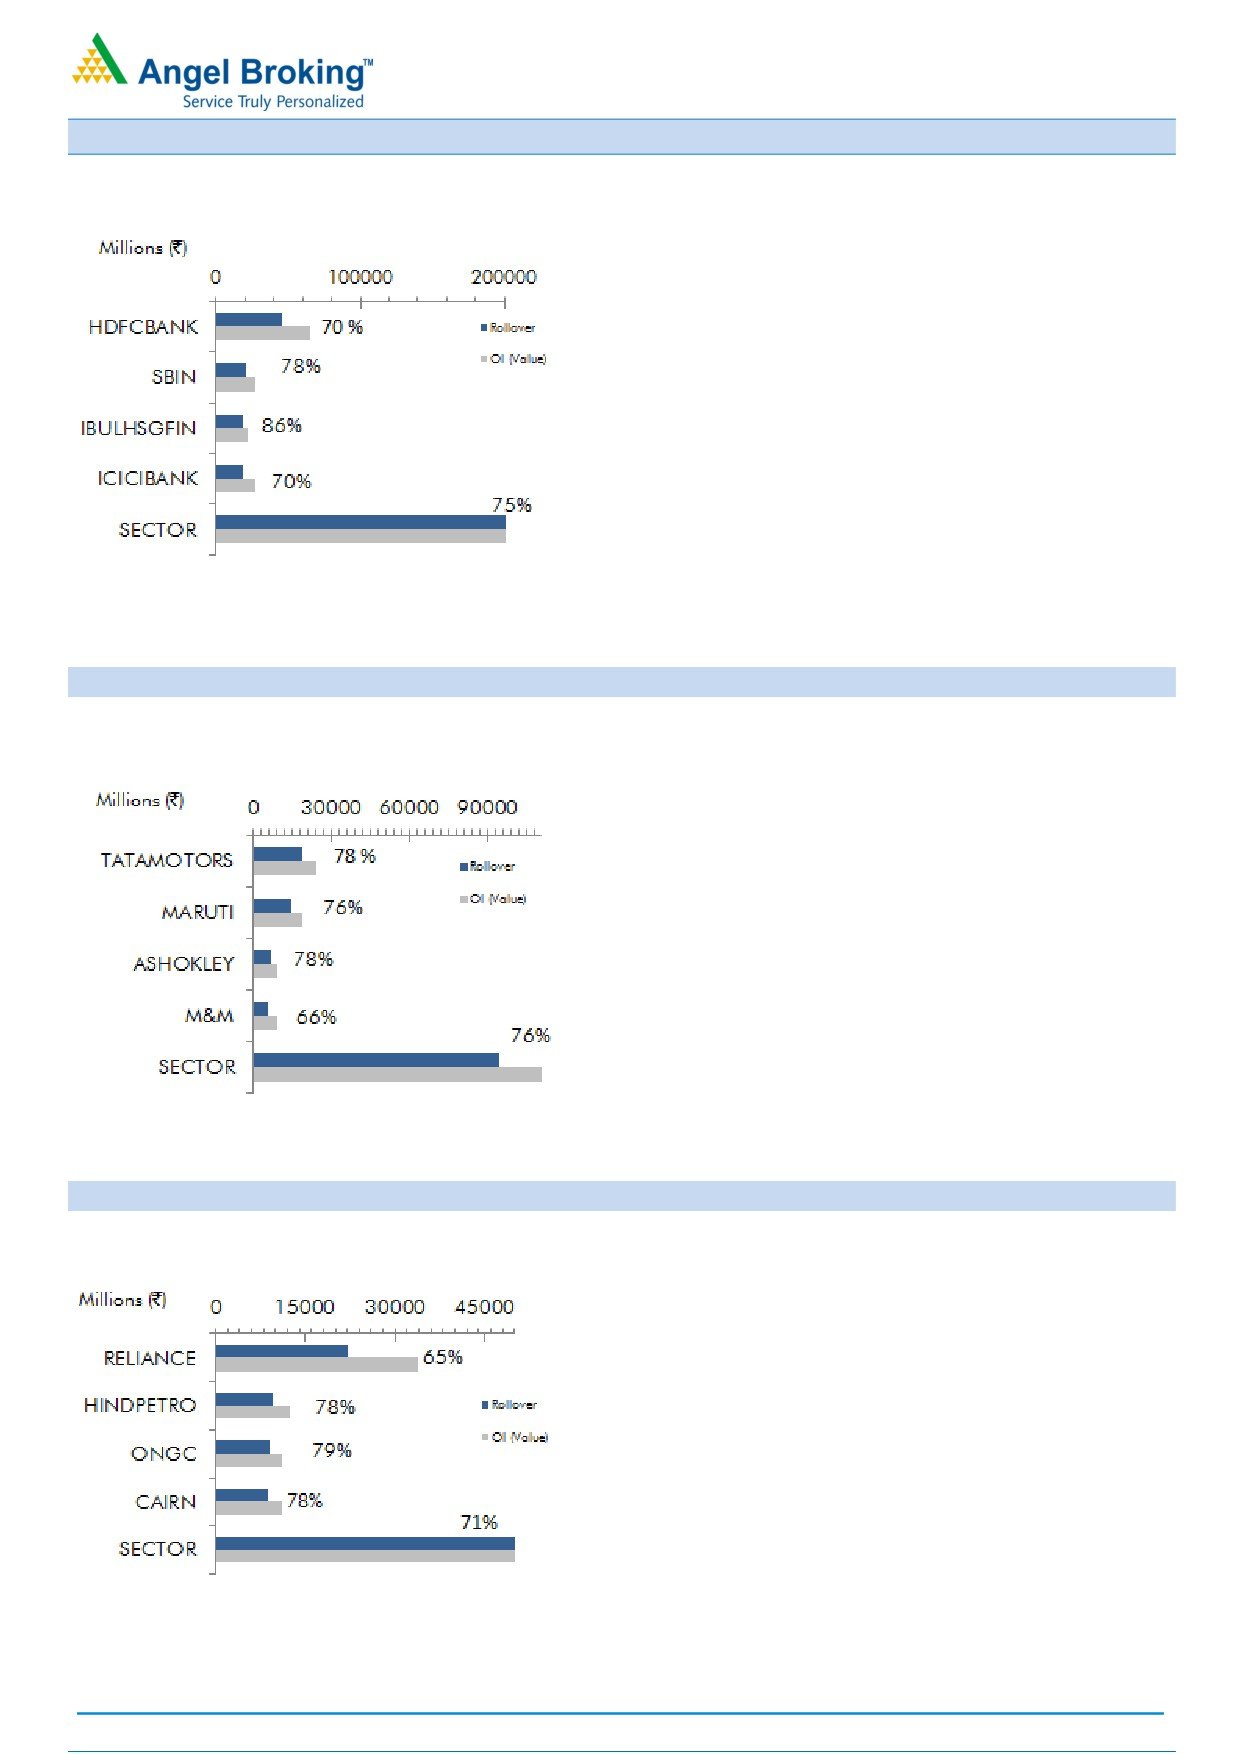
Banking and Financials
SBIN (78.14%) traded in a narrow range of `270 -
`280 for major part of the series; wherein, we
witnessed formation of mixed positions. However, the
stock rallied in last three sessions and closed above
its strong resistance of `280 - `285 along with long
build-up. The stock may continue its upward
momentum and should be traded with positive bias.
BANKBARODA (82.22%) remained under pressure
for first three weeks of the series and added some
short positions. However, strong rally was seen in last
week with formation of long positions. Rollover is
above its quarterly average. The stock has strong
support at `168 - `170 and any dips for upto that
zone should be used as a buying opportunity.
Some NBFCs like IBULHSGFIN
(86.42%), DHFL
(87.33%), RELCAPITAL (81.65%), M&MFIN (76.54%)
and L&TFH (81.95%) had seen decent rally in March
series along with formation of long positions. These
stocks can be traded with positive bias.
Auto & Auto Ancillaries
BAJAJ-AUTO (78.31%) remained flat on M-o-M basis
and has added good amount of positions. These
positions are blend of both long and short. Rollovers
are also in-line with its average. The stock has strong
support at `2765 - `2785 zone and traders may
look for buying around the same.
M&M (65.56%) ended the series with marginal loss
over its previous month’s expiry. In March series, we
witnessed huge open interest addition in the stock
and most of them are on short side and the same got
rolled too. Thus, traders are suggested to stay light
unless we see any positive development in data.
MRF (82.43%) was the biggest gainer in this space
and added decent amount of long formation. The
long positions got rolled to the next series. Traders
having long positions in the counter can continue to
hold the same. But, fresh buying is not advisable at
current levels.
Oil & Gas
RELIANCE (65.31%) was the biggest gainer in this
space. But, surprisingly, the up move was not
supported by long positions and we also some
witnessed some short formation in corrective moves.
Rollover is much below its average and thus indicates
that the shorts are now out of the system. Meaningful
fresh build-up will decide the further move in the stock.
CAIRN (79.98%) ended the March series with M-o-M
gains of 4.89% with huge open interest build-up. From
first sight, it seems long positions; but, considering its
daily activity, we can figure out that it’s a blend of both
long and short. The stock has good support at `292 -
`295 levels and long can be formed around the same.
ONGC (79.31%) remained under pressure in last
series along with formation of short positions.
Rollovers are also above its average. The stock has
also breached its crucial support of `188 - `190 zone.
Traders should refrain bottom fishing in the counter.
For Private Circulation Only
SEBI Registration No: INB 010996539
2
Derivatives Rollover Report
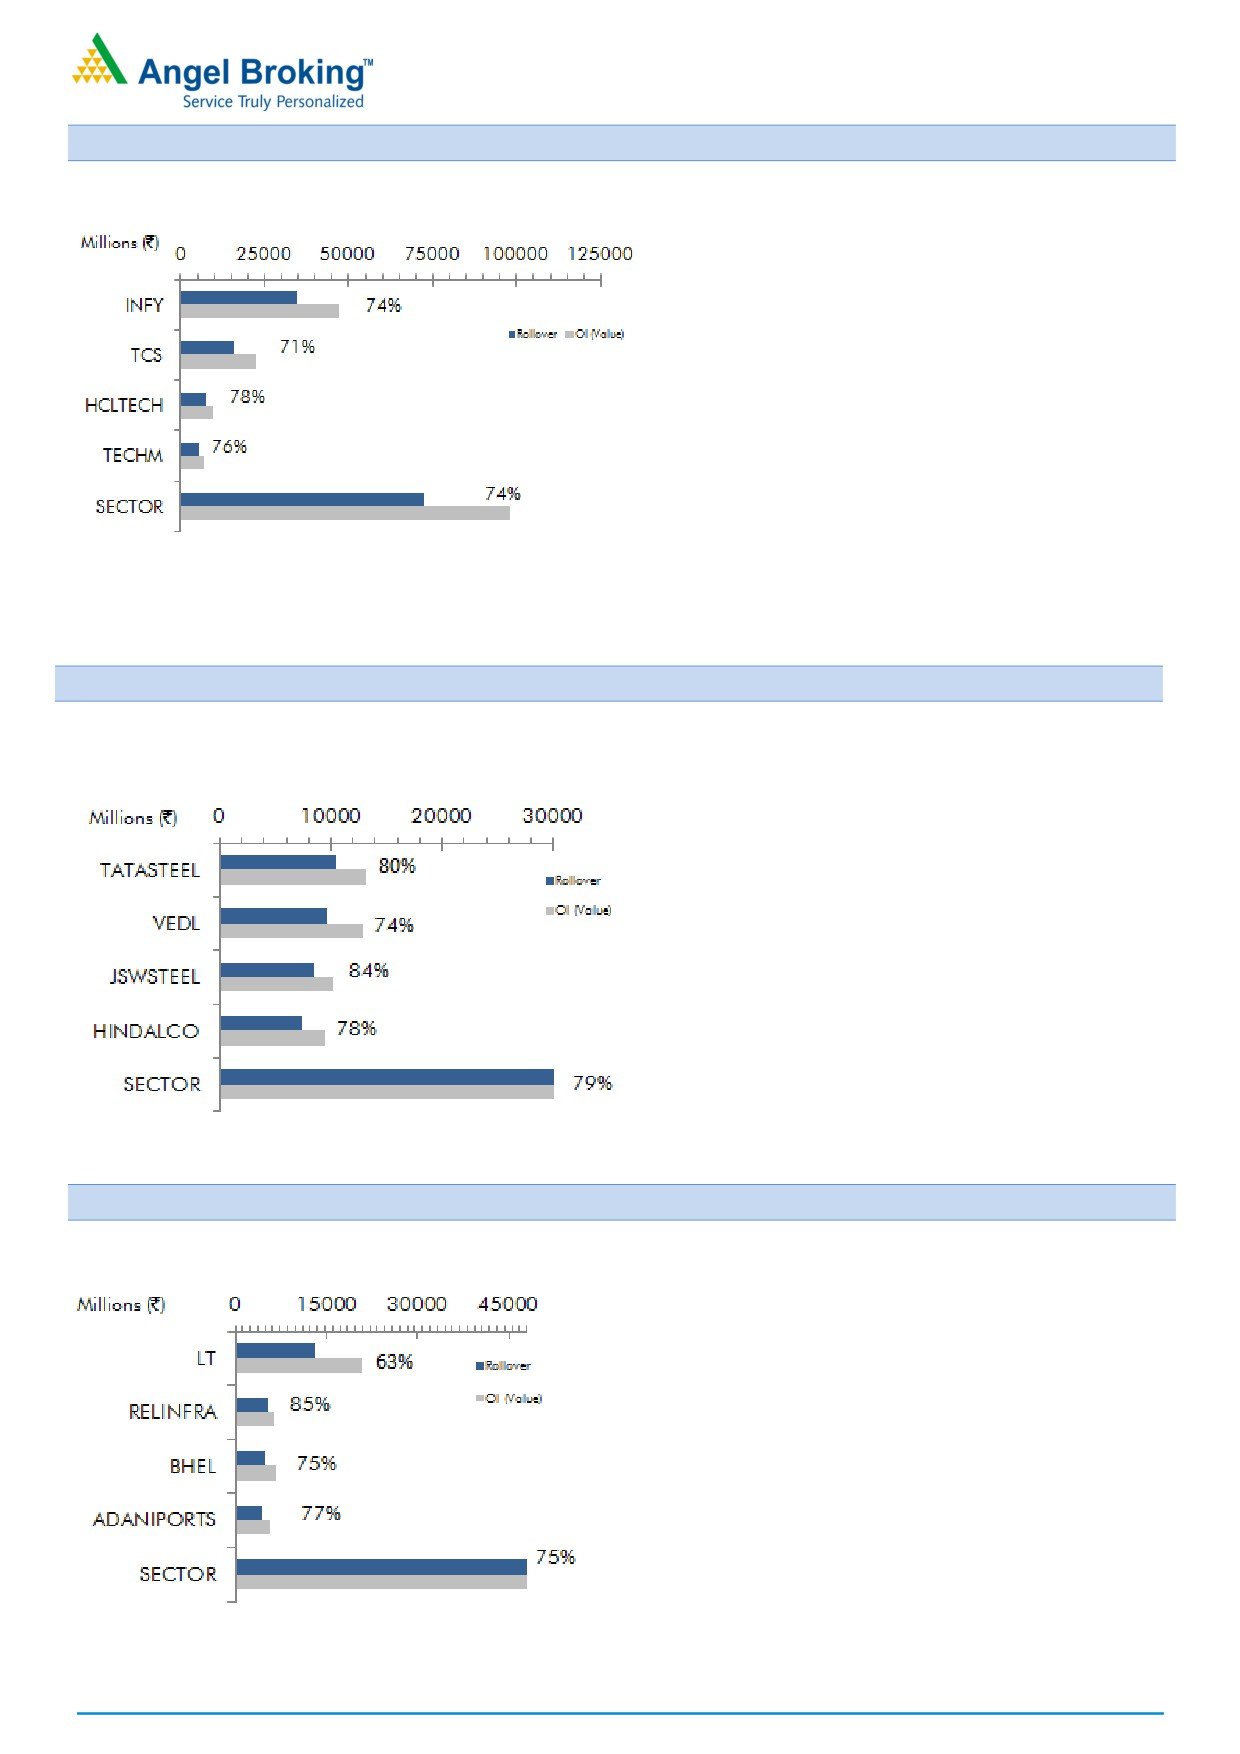
IT
Wipro (70.80%) out-performed its peers last series.
We witnessed good amount of long formation in this
counter as it bounced from `455 levels. Rollover in
percentage is below average but is high in open
interest term. We believe longs formed during last
series are still intact. Hence, one can go long at dips.
Infy (73.87%) is hardly up by 1.45% series on series,
but surprisingly we witnessed huge open interest
additions during last few trading sessions. We believe
these are mixed positions formed. Trades are
suggested to avoid forming any directional trade and
prefer long straddle/ strangle strategy in this counter.
TECHM (76.14%) plunged more than 8% series on
series with good amount of open interest additions.
Short positions formed in last series also got rolled in
April series. This counter has immediate support
around `445 - `450 levels, one can expect some
short covering bounced from these levels, trade
accordingly.
Metal & Mining
COALINDIA (77.42%) has been under pressure since
start of March series. We witnessed huge short
formation in this fall, due to which open interest has
doubled series on series. While, rollovers are also
above its averages, suggesting shorts formed are still
in system. Hence, this counter may remain under-
pressure. Thus, trades are suggested to avoid forming
long at current levels.
TATASTEEL (80.42%) has been consistently attracting
shorts between `500 - `505 levels. Last series, this
counter traded in range of `470 - `505 levels. We
witnessed good amount of short addition last series
and these positions got rolled too. At present, this
counter is trading at the lower side of the range.
Thus, traders can buy this stock on dips, as we expect
some short covering bounce which may bring near
`500 - `505 levels.
Capital Goods & Infra
BHEL (74.63%) continued the Feb month’s rally in last
series too with formation of long positions. Rollover is
also inline with its average, which indicates that longs
has been rolled to April series. The stock has good
support at `157 - `160 zone and traders can use
declines to initiate fresh longs in the counter.
LT (62.96%) has the lowest rollover in this space. The
stock has added good amount of positions and most
of them are on long side. The stock has managed to
sustain above its major resistance of `1512 and
`1545. Traders are advised to trade this counter with
positive bias.
VOLTAS (74.15%) outperformed the Capital Goods
sector with huge open interest addition, indicating
long build-up in the stock. The long positions have
been rolled to April series also. Traders should hold
their long positions in the stock.
For Private Circulation Only
SEBI Registration No: INB 010996539
3
Derivatives Rollover Report
Average
Price
OI
Rollover
Change
Change
Rollover
(3month)
Scrip
Price
(%)
OI Futures
(%)
COC (%)
PCR-OI
(%)
(%)
AUTO & AUTO ANCILLARIES
AMARAJABAT
876.50
3.02
1835400
25.57
9.29
0.84
70.06
74.70
APOLLOTYRE
209.20
12.75
14031000
(10.71)
8.15
0.73
88.68
89.39
ASHOKLEY
83.60
(8.28)
83244000
36.88
9.42
0.47
78.31
86.28
BAJAJ-AUTO
2836.20
0.76
1585250
31.88
6.16
0.53
75.62
76.02
BHARATFORG
1033.90
(3.99)
4226400
45.48
8.95
0.54
78.20
79.95
BOSCHLTD
22737.50
2.84
90300
20.40
7.93
0.00
74.66
77.32
CASTROLIND
431.90
3.31
8603000
(1.82)
8.66
0.25
90.34
90.65
CEATLTD
1322.25
13.37
1838900
9.37
8.38
0.23
83.21
81.36
EICHERMOT
25764.80
3.31
183525
26.96
5.40
0.54
67.85
73.35
EXIDEIND
221.25
3.44
16580000
3.32
4.14
0.26
87.45
89.95
HEROMOTOCO
3248.60
1.93
1503200
7.74
6.84
1.05
73.72
75.33
M&M
1287.50
(1.57)
4516000
44.54
7.79
0.82
65.56
70.97
MARUTI
5978.35
(1.42)
2400450
6.04
4.76
0.46
76.07
78.62
MOTHERSUMI
380.15
8.32
7975000
(13.64)
5.34
0.56
64.28
76.55
MRF
59983.20
15.86
52635
13.52
3.48
0.00
82.43
87.80
TATAMOTORS
469.30
1.16
40204500
13.19
2.50
0.80
77.56
70.31
TATAMTRDVR
283.55
0.37
19796700
6.45
9.03
1.09
77.11
82.99
TVSMOTOR
433.70
1.40
4202000
(31.25)
-6.58
0.73
67.43
77.78
BANKING & FINANCIALS
ALBK
73.40
(0.20)
13370000
(0.82)
9.84
0.38
82.89
72.78
ANDHRABANK
58.10
4.31
20160000
13.51
19.35
0.44
58.45
63.08
AXISBANK
500.60
(5.41)
31698000
20.51
3.52
0.64
74.66
76.25
BAJFINANCE
1182.15
9.97
4268000
2.06
1.21
0.46
85.45
79.24
BANKBARODA
174.50
3.32
53637500
32.33
6.38
0.67
82.22
77.01
BANKINDIA
139.35
9.12
24498000
12.23
8.00
0.42
81.25
82.92
BHARATFIN
813.10
(7.13)
17880000
79.88
9.37
0.57
86.41
84.96
CANBK
303.85
5.56
15009828
10.66
3.01
0.55
90.10
86.86
DCBBANK
169.20
9.59
4423500
14.30
6.58
1.06
72.65
77.18
DHFL
366.90
10.18
19458000
11.39
9.66
1.27
87.33
88.75
FEDERALBNK
91.15
7.74
53944000
(11.45)
5.75
0.57
81.76
83.37
HDFC
1524.10
9.54
9984000
(6.57)
3.56
0.50
52.02
66.49
HDFCBANK
1447.70
4.24
31518500
(5.36)
-16.45
0.53
69.86
73.25
IBULHSGFIN
992.15
14.67
19446400
35.08
2.04
0.28
86.42
85.13
ICICIBANK
281.95
(1.12)
68207500
5.83
2.78
0.80
70.18
70.78
IDBI
75.05
(8.64)
38368000
58.13
9.62
0.78
83.03
83.13
IDFCBANK
60.05
(4.83)
76888000
38.17
8.74
0.69
87.15
90.29
IDFC
54.90
3.10
99237600
23.92
9.57
0.72
81.72
88.96
IFCI
30.20
1.17
59950000
4.65
13.08
0.35
82.85
82.22
For Private Circulation Only
SEBI Registration No: INB 010996539
4
Derivatives Rollover Report
Average
Price
OI
Rollover
Change
Change
Rollover
(3month)
Scrip
Price
(%)
OI Futures
(%)
COC (%)
PCR-OI
(%)
(%)
INDUSINDBK
1425.20
5.84
7827000
33.60
2.66
0.57
71.43
69.76
KOTAKBANK
866.45
6.89
9700000
(1.73)
1.96
0.63
67.17
70.70
KTKBANK
141.15
7.95
27951250
(2.29)
9.77
0.48
75.77
83.56
L&TFH
124.15
6.25
21006000
25.01
7.92
0.43
81.95
79.67
LICHSGFIN
624.70
9.81
5051200
(41.72)
4.82
0.58
77.55
77.98
M&MFIN
316.40
8.02
13855000
9.37
6.21
0.80
76.54
75.63
ORIENTBANK
138.50
10.45
12318000
(7.56)
-44.54
0.80
81.73
84.98
PFC
143.50
6.89
31722000
16.63
7.31
0.86
77.10
74.07
PNB
149.40
6.33
51863000
11.43
-32.33
0.79
82.13
80.71
RECLTD
180.20
18.98
26790000
(12.49)
-14.66
0.54
67.74
74.69
RELCAPITAL
612.20
17.21
11232000
8.10
10.30
0.68
81.65
87.10
SBIN
291.55
7.29
72918000
(9.08)
2.24
0.69
78.14
76.05
SOUTHBANK
20.40
(1.92)
80830899
38.03
9.66
1.16
90.64
90.01
SRTRANSFIN
1055.90
12.52
1989600
(44.61)
3.96
0.19
55.39
75.89
SYNDIBANK
71.20
1.50
13149000
(6.76)
8.29
0.33
81.48
77.21
UNIONBANK
155.70
8.92
17428000
(21.11)
5.04
0.37
72.56
79.22
YESBANK
1555.60
7.14
7508200
(0.87)
2.90
1.13
73.29
75.31
CAPITAL GOODS & INFRASTRUCTURE
ADANIPORTS
340.20
13.89
12857500
(0.16)
3.46
0.59
76.85
77.44
BEML
1319.15
(0.89)
2130600
5.18
7.50
1.39
71.52
81.35
BHEL
165.60
7.39
29955000
30.81
9.12
0.55
74.63
74.51
CGPOWER
77.15
13.29
17556000
(8.45)
5.94
0.20
80.52
82.89
ENGINERSIN
144.85
(2.23)
26180000
18.35
9.98
1.10
81.50
79.23
GMRINFRA
16.55
9.97
207180000
17.06
15.95
0.44
88.90
87.12
HAVELLS
469.15
13.98
4212000
(11.74)
-5.12
0.32
76.03
77.42
IRB
238.20
2.45
16130000
63.59
9.93
0.49
89.08
88.59
JPASSOCIAT
14.15
(5.03)
150960000
0.77
18.69
0.30
89.55
88.33
LT
1563.15
4.65
8346500
8.93
4.77
0.44
62.96
73.37
RELINFRA
567.80
1.43
9623900
51.08
9.13
0.52
84.63
88.80
SIEMENS
1258.20
4.06
914500
2.64
7.29
0.41
74.99
79.24
VOLTAS
416.15
16.95
5634000
25.48
8.83
0.27
74.15
76.22
CEMENT
ACC
1426.80
(0.86)
1825200
68.94
7.21
0.36
81.05
79.82
AMBUJACEM
234.20
1.19
10912500
10.76
1.11
0.17
72.48
75.28
GRASIM
1069.45
4.14
6052500
20.72
1.46
0.75
74.39
70.53
INDIACEM
161.70
(3.46)
22848000
25.56
9.75
0.58
82.39
85.46
ULTRACEMCO
3996.90
5.28
2386000
16.81
2.76
0.69
77.43
76.84
For Private Circulation Only
SEBI Registration No: INB 010996539
5
Derivatives Rollover Report
Average
Price
OI
Rollover
Change
Change
Rollover
(3month)
Scrip
Price
(%)
OI Futures
(%)
COC (%)
PCR-OI
(%)
(%)
CHEMICAL & FERTILIZERS
PIDILITIND
694.60
0.33
1632000
11.86
6.89
0.39
79.30
80.95
TATACHEM
596.85
2.98
3823500
20.18
5.04
0.49
87.20
83.88
UPL
716.60
(0.65)
5030400
(11.56)
3.83
0.75
67.66
81.81
CONSUMER GOODS & FMCG
ASIANPAINT
1074.75
6.09
4222200
(9.52)
5.66
0.41
74.77
80.73
BRITANNIA
3406.75
5.03
337600
(71.53)
4.45
0.45
42.39
68.89
COLPAL
1007.25
12.02
877100
(36.59)
-1.10
0.38
63.60
77.72
DABUR
275.40
1.70
11920000
(6.38)
5.94
0.46
81.19
86.53
GODREJCP
1668.95
(0.30)
348400
(16.09)
5.49
0.50
67.83
64.30
HINDUNILVR
921.00
6.74
7116600
4.62
2.55
0.37
73.43
79.06
ITC
284.00
6.33
50956800
10.31
5.76
1.25
67.13
73.59
JUBLFOOD
1114.25
10.74
1840500
(12.75)
-3.73
0.43
57.16
69.83
MARICO
296.80
9.95
4526600
(2.68)
1.32
1.00
75.24
76.57
TATAGLOBAL
150.95
7.71
31810500
9.63
6.95
0.30
90.11
92.66
TITAN
459.60
5.63
4617000
(29.24)
6.56
0.54
66.34
71.35
UBL
784.65
(0.66)
1017800
(9.01)
9.20
0.44
61.98
74.41
INFORMATION TECHNOLOGY
HCLTECH
871.40
3.03
8373400
29.78
-6.62
0.87
78.36
79.71
HEXAWARE
219.70
(0.54)
3603000
(16.25)
6.26
0.57
81.98
81.57
INFY
1027.20
1.45
33820500
56.69
2.16
0.71
73.87
73.11
KPIT
131.35
(5.74)
5012000
32.45
6.98
2.79
76.26
80.03
MINDTREE
453.45
(4.10)
2887200
(3.88)
0.72
0.62
71.29
83.54
NIITTECH
421.35
(0.70)
592500
(18.39)
4.03
1.00
57.08
73.62
OFSS
3625.35
(2.46)
239850
(4.14)
-54.09
0.00
74.86
75.87
TATAELXSI
1485.15
0.30
1220000
19.56
9.33
0.78
78.87
80.83
TCS
2450.90
(1.45)
6400250
20.43
5.29
2.59
70.58
71.54
TECHM
462.95
(8.31)
11420200
43.20
4.95
0.68
76.14
74.01
WIPRO
517.15
6.08
6992400
38.47
3.03
0.82
70.80
75.93
MEDIA
DISHTV
108.75
15.88
25585000
(7.59)
2.40
0.34
78.96
83.78
SUNTV
792.25
11.73
6878000
(4.82)
6.62
0.33
86.17
85.30
TV18BRDCST
42.40
5.47
89998000
3.54
10.85
0.82
92.25
91.91
ZEEL
535.10
2.67
7616700
6.78
6.61
0.48
74.35
78.63
For Private Circulation Only
SEBI Registration No: INB 010996539
6
Derivatives Rollover Report
Average
Price
OI
Rollover
Change
Change
Rollover
(3month)
Scrip
Price
(%)
OI Futures
(%)
COC (%)
PCR-OI
(%)
(%)
METALS & MINING
COALINDIA
291.35
(6.44)
20366000
100.13
8.33
0.68
77.42
71.03
HINDALCO
191.50
4.70
38650500
(12.37)
8.22
0.99
78.41
82.10
HINDZINC
287.80
(4.97)
10112000
27.83
9.12
0.41
76.44
76.78
JINDALSTEL
120.05
2.43
32184000
(13.12)
11.50
0.49
77.34
84.53
JSWSTEEL
186.10
(0.67)
45633000
6.47
4.92
0.70
83.73
85.04
NMDC
132.90
(6.51)
27582000
52.52
7.89
0.65
84.19
80.08
SAIL
61.40
1.57
52584000
8.41
7.47
0.80
85.79
84.80
TATASTEEL
480.40
(1.27)
21936000
13.87
7.92
0.79
80.42
80.69
VEDL
253.70
(3.50)
37884000
9.78
-98.78
0.40
74.22
77.22
MISCELLANIOUS
ABIRLANUVO
1540.55
2.80
3250400
24.08
8.95
0.90
87.31
90.29
ADANIENT
106.60
9.61
19640000
(7.18)
9.86
0.34
81.18
84.79
BATAINDIA
571.35
14.54
4185500
59.54
4.35
0.10
86.40
84.27
BEL
154.55
2.10
31806000
(10.67)
9.34
0.52
81.40
86.24
CONCOR
1269.20
7.24
964500
(24.59)
1.44
0.60
75.53
78.85
CUMMINSIND
947.15
6.70
621600
(0.67)
9.36
0.67
74.37
77.91
GODREJIND
505.90
(0.50)
1941000
110.41
8.95
1.21
76.03
74.35
JETAIRWAYS
535.50
25.96
5705000
4.58
7.84
0.33
77.85
77.75
JISLJALEQS
93.75
(0.58)
37269000
(1.73)
10.51
0.72
85.26
86.22
JUSTDIAL
544.85
4.77
2498400
(4.93)
4.80
0.54
72.29
74.31
KSCL
545.90
19.18
2883000
(0.41)
9.14
1.88
74.35
80.82
MCDOWELL-N
2206.15
(5.96)
3552000
32.22
7.16
0.38
88.97
91.10
PCJEWELLER
419.25
10.62
861000
(5.12)
9.24
0.46
64.35
70.57
SINTEX
106.20
13.04
37897875
12.52
9.89
0.60
85.86
89.09
OIL & GAS
BPCL
644.85
(7.87)
10959600
6.84
8.55
0.56
75.92
77.91
CAIRN
301.65
4.89
29046500
13.90
7.17
0.52
78.30
84.65
GAIL
377.95
(1.24)
15790000
10.51
-3.61
0.57
54.85
68.99
HINDPETRO
519.20
(5.39)
18549300
8.90
4.79
0.33
77.60
78.04
IGL
1010.30
(2.98)
2352900
52.46
9.42
1.95
78.29
78.77
IOC
375.25
(3.11)
16356000
8.91
-5.36
0.53
70.53
72.65
OIL
328.45
0.09
1930632
(17.52)
-0.99
0.53
62.60
74.73
ONGC
185.10
(5.75)
48052500
25.75
8.51
0.51
79.31
75.80
PETRONET
402.70
0.32
3940500
(33.09)
7.98
0.54
82.64
81.13
RELIANCE
1274.20
7.19
17377000
(9.10)
3.64
0.50
65.31
77.53
For Private Circulation Only
SEBI Registration No: INB 010996539
7
Derivatives Rollover Report
Average
Price
OI
Rollover
Change
Change
Rollover
(3month)
Scrip
Price
(%)
OI Futures
(%)
COC (%)
PCR-OI
(%)
(%)
PHARMACEUTICAL
AJANTPHARM
1767.10
2.96
578400
18.33
9.44
1.19
70.09
80.00
APOLLOHOSP
1163.80
(12.35)
1513200
138.22
9.08
0.96
83.33
83.47
AUROPHARMA
675.25
0.72
14450100
3.20
6.89
0.84
81.18
83.21
BIOCON
1145.65
2.65
2896800
24.34
7.55
0.59
79.03
86.01
CADILAHC
451.65
4.66
3016000
(0.89)
3.62
0.28
80.56
81.12
CIPLA
600.50
0.99
6357000
(4.68)
4.68
0.65
76.47
80.54
DIVISLAB
626.80
(16.68)
10145400
100.84
8.06
0.34
90.10
83.57
DRREDDY
2628.85
(9.50)
3425000
29.31
7.78
0.69
79.40
78.23
GLENMARK
867.90
(7.31)
3604300
58.77
8.62
1.15
87.52
85.55
GRANULES
140.05
8.31
12955000
(5.30)
8.90
0.73
85.74
86.77
LUPIN
1452.80
(0.40)
8691600
22.53
5.27
0.91
75.24
77.90
STAR
1111.45
(5.60)
1996500
47.02
9.03
0.80
80.80
77.50
SUNPHARMA
690.70
2.02
28576800
(0.08)
6.93
0.76
78.19
81.73
TORNTPHARM
1488.10
14.63
179200
(39.05)
-7.88
0.33
71.45
76.06
WOCKPHARMA
731.70
3.19
3162000
(1.22)
9.33
0.79
83.76
86.97
POWER
ADANIPOWER
40.20
4.55
125940000
(2.16)
9.80
0.29
88.33
90.73
CESC
846.00
(1.76)
4348300
34.41
3.55
0.83
83.52
86.40
JSWENERGY
63.20
0.08
57608000
38.08
8.30
0.72
85.47
88.82
NHPC
31.90
4.76
21276000
(13.12)
8.22
0.52
74.90
72.17
NTPC
164.05
(1.35)
23884000
10.25
7.59
0.79
70.75
74.76
POWERGRID
196.60
(1.87)
31544000
63.98
7.67
0.49
73.24
77.50
PTC
92.30
2.56
15280000
(8.31)
5.67
0.84
78.15
83.91
RPOWER
48.15
3.88
55656000
2.29
10.92
0.43
87.13
89.97
TATAPOWER
90.25
7.44
28341000
1.19
5.08
0.40
80.07
83.89
TORNTPOWER
231.25
14.51
3654000
10.93
-28.94
0.50
88.26
88.77
REAL ESTATE
DLF
150.50
0.77
31120000
7.40
10.92
0.54
83.29
79.56
HDIL
82.25
19.64
20336000
(22.71)
3.97
0.23
72.82
79.17
IBREALEST
87.90
12.48
31470000
(1.07)
9.71
0.32
86.08
88.15
NCC
81.25
(1.04)
30576000
7.57
7.26
1.00
81.06
82.82
TELECOM
BHARTIARTL
348.60
(5.04)
36247400
(7.54)
-9.65
0.38
78.89
77.11
IDEA
87.65
(26.65)
92295000
29.71
8.98
0.61
76.09
72.35
INFRATEL
325.65
8.77
8086400
5.47
-42.78
0.45
64.06
74.56
RCOM
38.35
2.95
89928000
(10.75)
3.41
0.39
79.86
85.04
TATACOMM
718.60
(3.75)
6582800
16.85
8.77
0.56
90.58
88.95
For Private Circulation Only
SEBI Registration No: INB 010996539
8
Derivatives Rollover Report
TEXTILES
ARVIND
393.05
5.14
6802000
(0.15)
7.34
0.72
80.17
82.14
CENTURYTEX
1055.30
10.93
7991500
(0.47)
9.27
0.38
88.75
90.88
ICIL
197.20
22.60
9338000
134.45
8.99
0.27
81.64
86.93
PAGEIND
14824.05
5.12
31650
(2.01)
10.22
0.00
78.63
76.04
SRF
1614.75
3.29
802500
9.71
8.65
1.18
77.87
77.79
Research Team Tel: 022 - 39357800
DISCLAIMER
Angel Broking Private Limited (hereinafter referred to as “Angel”) is a registered Member of National Stock Exchange of India Limited, Bombay Stock
Exchange Limited and MCX Stock Exchange Limited. It is also registered as a Depository Participant with CDSL and Portfolio Manager with SEBI. It
also has registration with AMFI as a Mutual Fund Distributor. Angel Broking Private Limited is a registered entity with SEBI for Research Analyst in
terms of SEBI (Research Analyst) Regulations, 2014 vide registration number INH000000164. Angel or its associates has not been debarred/
suspended by SEBI or any other regulatory authority for accessing /dealing in securities Market. Angel or its associates including its relatives/analyst
do not hold any financial interest/beneficial ownership of more than 1% in the company covered by Analyst. Angel or its associates/analyst has not
received any compensation / managed or co-managed public offering of securities of the company covered by Analyst during the past twelve
months. Angel/analyst has not served as an officer, director or employee of company covered by Analyst and has not been engaged in market
making activity of the company covered by Analyst.
This document is solely for the personal information of the recipient, and must not be singularly used as the basis of any investment decision.
Nothing in this document should be construed as investment or financial advice. Each recipient of this document should make such investigations as
they deem necessary to arrive at an independent evaluation of an investment in the securities of the companies referred to in this document
(including the merits and risks involved), and should consult their own advisors to determine the merits and risks of such an investment.
Reports based on technical and derivative analysis center on studying charts of a stock's price movement, outstanding positions and trading volume,
as opposed to focusing on a company's fundamentals and, as such, may not match with a report on a company's fundamentals.
The information in this document has been printed on the basis of publicly available information, internal data and other reliable sources believed to
be true, but we do not represent that it is accurate or complete and it should not be relied on as such, as this document is for general guidance only.
Angel Broking Pvt. Limited or any of its affiliates/ group companies shall not be in any way responsible for any loss or damage that may arise to any
person from any inadvertent error in the information contained in this report. Angel Broking Pvt. Limited has not independently verified all the
information contained within this document. Accordingly, we cannot testify, nor make any representation or warranty, express or implied, to the
accuracy, contents or data contained within this document. While Angel Broking Pvt. Limited endeavors to update on a reasonable basis the
information discussed in this material, there may be regulatory, compliance, or other reasons that prevent us from doing so.
This document is being supplied to you solely for your information, and its contents, information or data may not be reproduced, redistributed or
passed on, directly or indirectly.
Neither Angel Broking Pvt. Limited, nor its directors, employees or affiliates shall be liable for any loss or damage that may arise from or in
connection with the use of this information.
Note: Please refer to the important ‘Stock Holding Disclosure' report on the Angel website (Research Section). Also, please refer to the latest update
on respective stocks for the disclosure status in respect of those stocks. Angel Broking Pvt. Limited and its affiliates may have investment positions in
the stocks recommended in this report.
Derivative Research Team
For Private Circulation Only
SEBI Registration No: INB 010996539
9