Derivatives
Rollover Report
July 28, 2017
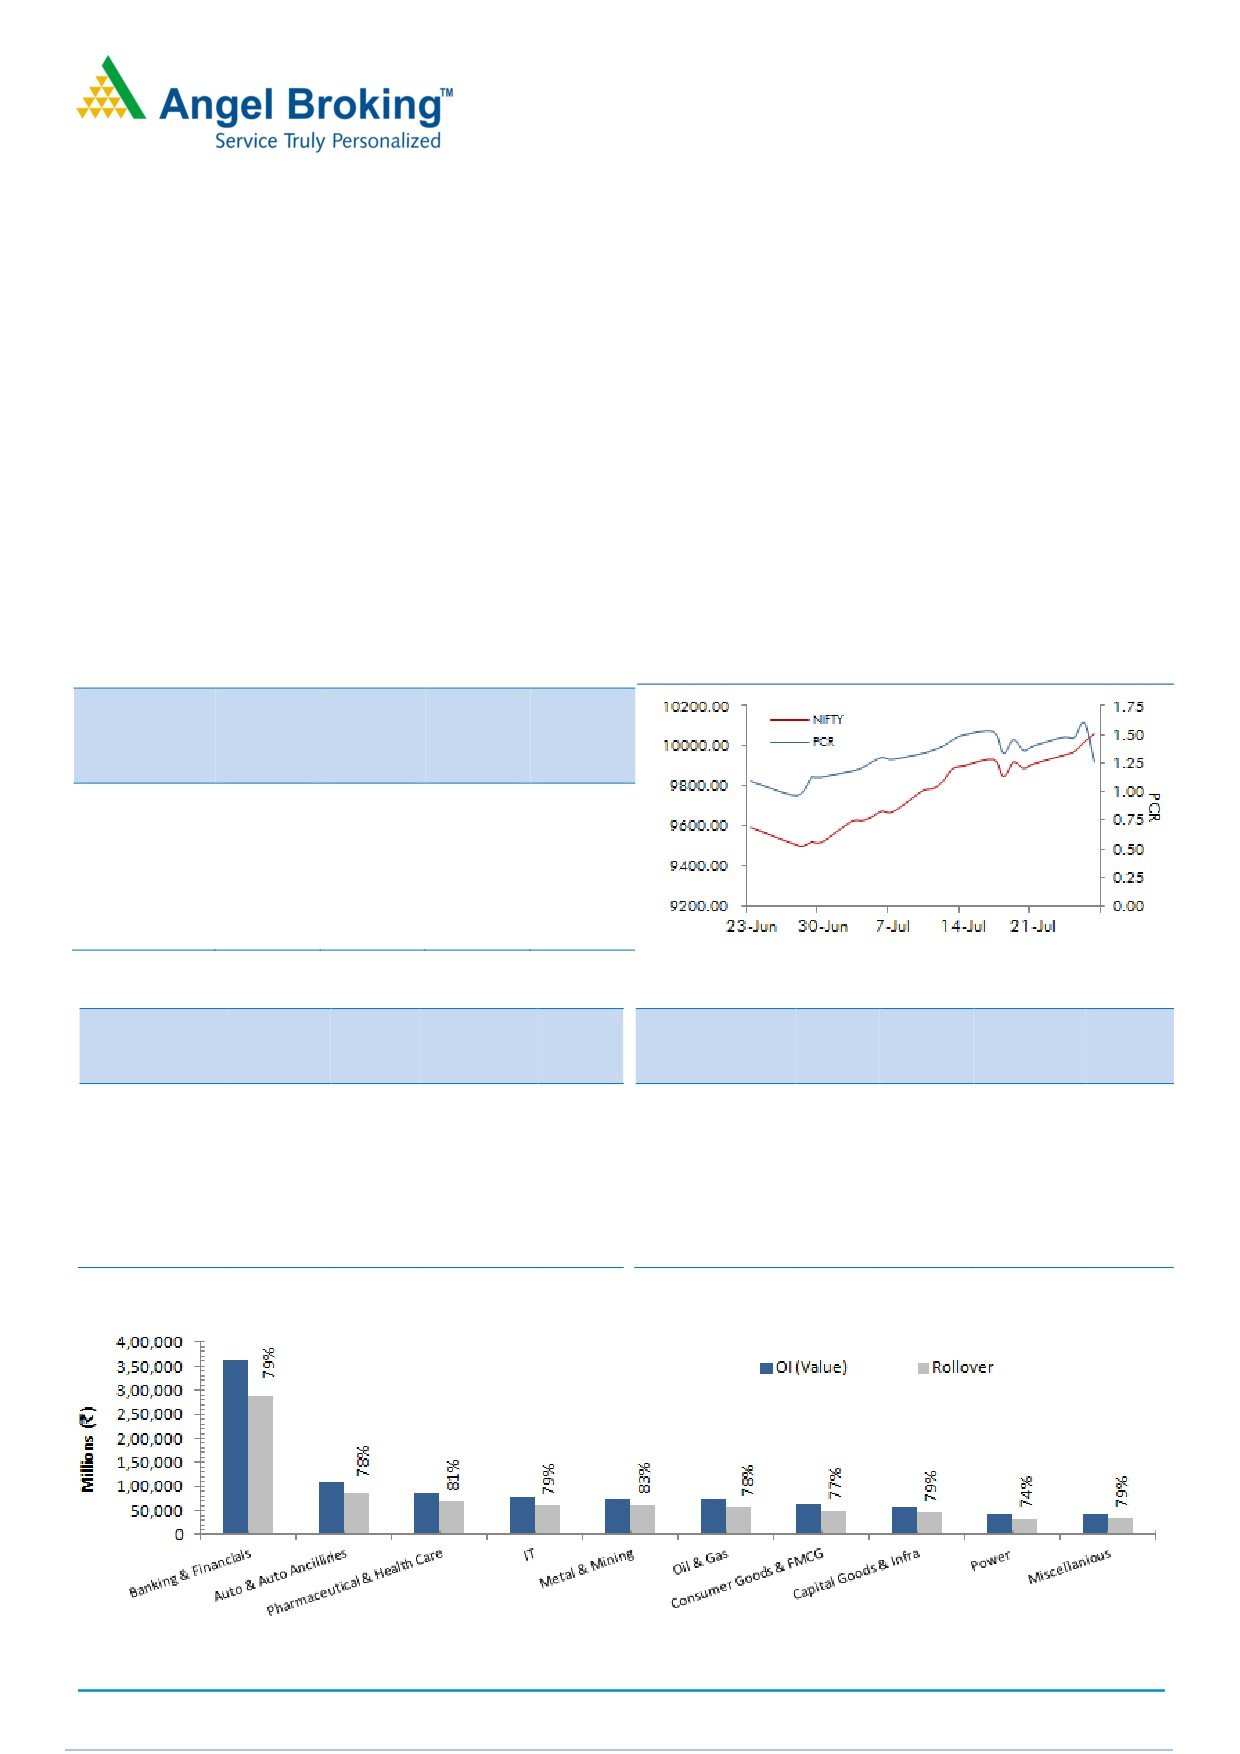
July series has been the historical one for our market as the benchmark index (Nifty) ended the expiry above the
magical five digit figure of 10000. This calendar year has been so remarkable for our markets as we saw six out of
seven series closing on a cheerful note. Rollover in Nifty (68.41%) is lower than its quarterly average of 71.82%; while,
the market wide rollovers are also on the lower side at 77.36%. One of the important observations in Nifty is that the
OI (Open interest) at present is lowest since the start of calendar year 2017; indicating majority of the longs formed in
last seven series have been lightened. Throughout July series, FIIs formed short positions in index futures; out of which
hardly 23% of the positions were rolled to the August series. During the same time, FIIs poured liquidity in equities as
they bought worth Rs. 2885 crores. In options segment, 10000-10200 call and 9700-10000 put options are attracting
trader’s attention. Looking at the overall rollover data, we would advice traders to remain light in index until we see
any relevant fresh positions forming in either direction.
BANKNIFTTY (76.12%) rollover in term of percentage as well as open interest is on the higher side. Post consistent
reduction of open interest in preceding two series, we witnessed decent amount of build-up in July series. Looking at
the price action and open interest activity, it seems longs were formed in this rate sensitive index and these positions
got rolled too. As far individual stocks are concerned, YESBANK, L&TFH, INDIANB, ORIENTALBANK, KOTAKBANK
and IDFC rallied due to long formation and rollovers in these counters are also encouraging.
Indices Change
NIFTY & PCR Graph
Price
Change
3 month
INDEX
Price
(%)
Rollover
avg.
NIFTY
10020.55
5.43
68.41
71.82
BANKNIFTY
24922.40
7.30
76.12
68.46
NIFTYIT
10612.30
4.82
83.25
76.23
NIFTYMID50
4746.25
5.50
-
-
NIFTYINFRA
3376.15
5.22
-
-
Monthly Gainers
Monthly Losers
Price
Ol
Price
Ol
Change Open
Change
Change Open
Change
Scrip
Price
(%)
Interest
(%)
Scrip
Price
(%)
Interest
(%)
SINTEX
34.95
40.93
17926500
(16.72)
ICIL
156.35
(9.31)
8449000
(2.58)
JUBLFOOD
1278.40
35.25
1647500
(31.41)
AJANTPHARM
1421.15
(8.68)
616400
96.06
INFIBEAM
1353.50
30.34
1282400
19.76
MINDTREE
485.45
(7.96)
4636800
24.32
JPASSOCIAT
29.05
27.13
170340000
7.74
NIITTECH
528.60
(7.70)
985500
124.23
JINDALSTEL
153.50
24.14
34528500
(16.67)
ITC
290.60
(6.99)
41800800
7.59
Note: Stocks which have more than 1000 contract in Futures OI.
Note: Stocks which have more than 1000 contract in Futures OI.
SEBI Registration No: INB 010996539
1
Derivatives Rollover Report
Banking and Financials
YESBANK
(76.18%) outperformed its peers as it
rallied nearly
24% last series with some long
formation. At the average price of Rs. 1640 we
witnessed this counter attracting huge buying. Thus,
data remains positive and we expect further strength
going ahead, buy on dip.
We witnessed decent rally in SBIN (73.35%) from the
support zone of Rs. 268-272 levels; but surprisingly
no longs were formed in this upmove. Now, it has an
immediate resistance near Rs. 300-304 levels. Thus,
traders are advised to exit from their longs.
M&MFIN (82.06%) is up 18.45% series on series; out
of which it rallied
12% in the expiry week with
significant open interest addition and huge volume.
The average price of the move ie- Rs. 380 may
now act as a strong base. Thus, this counter
remains buy on dips for us.
Auto & Auto Ancillaries
BHARTAFORG (76.69%) added significant positions
last series and we believe these are mixed positions.
At present, OI is at its peak since October 2016. As
this counter is heavy in open interest, we expect this
counter attract volatility in next series. Thus one can
adopt long straddle or long strangle strategy in this
counter.
APOLLTYRE (84.79%) rallied nearly 8% but we could
hardly trace any relevant build-up. In fact, in last 2-3
sessions this counter added decent shorts and we
believe these positions are still intact. At current
juncture, this counter is hovering near its resistance of
Rs. 266-268 levels. Thus, one can formed fresh
shorts for the target of Rs. 248-250.
TATAMTRDVR has highest rollover in this space.
However, it remained in a range of Rs. 257-272
throughout the series and added mixed positions.
Thus, unless we don’t see it breaching these levels,
one should remain light.
Pharmaceutical
During the start of July series DRREDDY
(87.35%)
showed strength mainly because of short covering.
However, soon it again attracted huge shorts along
with volumes. This counter has immediate support
near Rs.
2380-2400 levels, but looking at the
quantum of shorts we would advise traders to avoid
bottom fishing.
AJANTPHARM (73.24%) open interest has got nearly
doubled in the span of just one month. This stock has
been under pressure since quite some time and last
series it added massive shorts. Now this counter is
near support zone of Rs. 1400-1410 levels but we
believe it may continue to remain under pressure.
Stocks like BIOCON
(75.54%) and GLENMARK
(84.07%) rallied 21.76% and 13.79% respectively but
it was mainly due short covering bounce. Thus, one
should wait for fresh build-up before initiating fresh
positions.
For Private Circulation Only
SEBI Registration No: INB 010996539
2
Derivatives Rollover Report
Information Technology
HEXAWARE (79.15%) added more than 50% of open
interest last series along with rise in price. At the
same time, rollovers are above average, suggesting
longs formed have been rolled to August series. This
counter has an immediate resistance around
Rs. 262-267 levels, looking at the volume and open
interest activity, we believe this counter may surpass
its resistance. Thus, traders can buy this counter on
dips for the target of Rs. 273-274.
TCS (71.79%) rallied nearly 7% last series and also
added good amount of long positions. But, these
longs were not rolled to August series. Thus, one
should exit from the longs and wait for further
development before forming any positions.
MINDTREE (83.29%) underperformed its peers. We
witnessed huge short formation and rollovers are also
on the higher side, suggesting short are still intact.
We believe this stock may correct below its support of
Rs. 580-584 levels; avoid buying.
Metal & Mining
The overall metal pack rallied sharply in the recent
upmove. However, we hardly witnessed any stock
adding fresh open interest series on series.
HINDALCO (80.61%) surpassed the important hurdle
of Rs. 202-204 levels in last series. Surprisingly, we
hardly saw any buying interest in this upmove. At
present, this stock is light in terms of open interest. As
the overall momentum is strong in this counter one
should avoid shorting until we see meaningful fresh
short formation.
Liquid counters with high rollovers are SAIL (87.09%),
TATASTEEL
(86.96%), JINDALSTEL
(86.62%) and
NMDC (86.16%).
Oil & Gas
RELIANCE
(73.75%) outperformed its peers by
rallying more than 16% in July series. We witnessed
good amount of long formation in this upmove but
rollovers are below average, which is not encoring.
This stock has immediate resistance around
Rs. 1630-1632 levels. Thus, traders are suggested to
book profit near these levels.
As mentioned in the last report, BPCL
(83.48%)
rallied due to short covering. However, despite 14%
of upmove we are hardly witnessing any buying
interest; while majority of the shorts are also out of
the system. Thus, unless we don’t seen fresh build-up,
one should avoid aggressive positions in this stock.
Some of the liquid counters that have high rollovers
in this space are HINDPETRO
(87.63%), IOC
(85.98%), OIL (85.85%) and GAIL (84.30%).
For Private Circulation Only
SEBI Registration No: INB 010996539
3
Derivatives Rollover Report
Average
Price
OI
Rollover
Change
Change
Rollover
(3month)
Scrip
Price
(%)
OI Futures
(%)
COC (%)
PCR-OI
(%)
(%)
AUTO & AUTO ANCILLARIES
AMARAJABAT
849.45
0.71
1738800
60.38
3.08
0.86
83.01
83.60
APOLLOTYRE
264.00
7.89
11628000
(21.16)
8.36
0.49
84.78
85.27
ASHOKLEY
105.80
14.25
43043000
(6.05)
7.95
0.56
81.91
83.80
BAJAJ-AUTO
2860.70
3.65
818500
(42.61)
7.49
1.06
71.25
79.98
BALKRISIND
1613.70
(1.96)
580800
98.63
8.17
1.33
73.44
77.75
BHARATFORG
1141.65
5.37
4998000
32.43
2.52
0.73
79.69
77.69
BOSCHLTD
24145.15
3.20
72725
(21.86)
7.07
0.00
81.17
83.64
CASTROLIND
406.45
0.81
9574600
(5.13)
5.03
0.47
75.91
85.50
CEATLTD
1875.70
4.52
1155000
(1.55)
1.73
0.87
74.16
73.74
EICHERMOT
29105.30
6.07
90025
(50.93)
0.11
0.51
58.39
73.04
ESCORTS
646.25
(3.16)
4690400
25.60
7.80
0.58
77.70
81.20
EXIDEIND
216.50
(0.89)
14364000
4.54
7.76
0.57
87.18
86.68
HEROMOTOCO
3723.90
0.47
828800
(25.97)
5.73
0.63
70.19
75.09
M&M
1404.95
3.89
3627500
(34.82)
5.03
0.45
70.18
74.84
MARUTI
7568.90
4.26
1663350
(13.25)
-4.21
0.38
83.76
80.51
MOTHERSUMI
321.40
4.99
7001250
(23.86)
3.58
0.45
73.77
77.30
MRF
69228.05
0.18
48045
38.72
7.92
0.00
85.80
87.70
TATAMOTORS
448.55
2.20
36792000
(7.78)
7.38
0.59
80.04
79.29
TATAMTRDVR
264.50
(1.91)
19351500
12.31
8.75
1.17
89.03
87.18
TVSMOTOR
573.65
5.41
4272000
(12.64)
-2.90
0.65
68.40
73.77
BANKING & FINANCIALS
ALBK
75.05
9.96
13800000
(22.52)
7.70
0.71
80.00
77.97
ANDHRABANK
57.25
5.05
21250000
(5.13)
9.19
0.80
82.11
82.66
AXISBANK
528.65
3.99
29292000
(17.22)
7.95
0.42
75.00
78.70
BAJAJFINSV
4965.25
20.49
327875
(16.06)
6.51
2.01
77.79
84.38
BAJFINANCE
1685.45
22.28
3200500
(4.23)
3.79
1.34
85.47
86.53
BANKBARODA
162.00
3.42
50333500
6.34
6.80
1.02
83.24
82.63
BANKINDIA
156.30
15.56
17742000
(26.31)
9.43
0.52
77.49
78.13
BHARATFIN
823.75
15.17
12602000
(15.13)
6.69
0.38
78.30
81.98
CANBK
354.05
8.55
9495636
(42.07)
0.29
0.58
71.34
78.85
CANFINHOME
3138.40
(2.21)
543250
8.81
7.80
0.45
85.82
87.53
CAPF
767.30
15.51
3116800
(7.46)
5.05
0.58
78.93
80.61
CHOLAFIN
1183.85
7.48
381500
(10.97)
4.82
0.07
72.19
77.16
DCBBANK
198.30
0.30
6745500
41.02
7.68
0.23
75.36
73.11
DHFL
453.80
4.13
18438000
(9.76)
9.39
1.26
86.43
89.86
EQUITAS
167.15
10.66
6419200
(24.73)
6.59
0.66
79.45
82.70
FEDERALBNK
113.85
0.75
85360000
10.95
6.92
0.59
85.70
84.72
HDFC
1734.45
6.71
7037000
(14.99)
3.77
1.11
68.35
75.77
HDFCBANK
1780.35
7.16
19809000
(9.45)
-5.42
0.62
76.61
75.97
For Private Circulation Only
SEBI Registration No: INB 010996539
4
Derivatives Rollover Report
Average
Price
OI
Rollover
Change
Change
Rollover
(3month)
Scrip
Price
(%)
OI Futures
(%)
COC (%)
PCR-OI
(%)
(%)
IBULHSGFIN
1160.30
5.50
6968000
(42.03)
1.30
0.42
72.53
79.24
ICICIBANK
309.55
5.34
82458750
(17.62)
7.98
0.43
82.81
74.01
ICICIPRULI
441.05
-
3209700
-
4.75
0.71
83.30
-
IDBI
59.90
11.23
32256000
(22.09)
7.89
0.74
88.63
87.23
IDFC
58.15
5.06
101059200
38.12
9.96
0.63
86.22
81.38
IDFCBANK
59.60
8.96
96318000
(3.76)
7.93
0.62
85.76
87.37
IFCI
27.35
12.55
71610000
0.25
9.62
0.31
85.39
86.54
INDIANB
312.10
10.73
3984000
24.66
7.74
1.14
83.07
80.75
INDUSINDBK
1614.45
9.16
4231800
(10.56)
5.03
0.99
77.13
74.62
KOTAKBANK
1006.10
5.48
8860000
11.46
8.31
0.38
77.25
71.47
KTKBANK
152.85
(4.44)
26524000
10.85
7.91
0.59
84.65
84.13
L&TFH
161.85
12.16
20065500
6.04
4.21
0.41
80.08
81.59
LICHSGFIN
736.85
(1.41)
4329600
17.60
-0.42
0.51
79.05
75.89
M&MFIN
403.25
18.45
8655000
(16.32)
7.29
0.60
82.06
80.22
MANAPPURAM
105.35
-
23814000
-
9.99
0.38
90.95
-
MFSL
606.55
(1.17)
3835000
(20.76)
7.01
0.35
88.71
87.16
MUTHOOTFIN
469.15
1.15
2434500
33.69
8.52
0.34
87.40
84.96
ORIENTBANK
148.15
6.85
12948000
9.60
9.23
0.43
83.48
84.36
PFC
122.25
(0.49)
40938000
0.01
6.87
1.01
84.41
84.74
PNB
155.55
16.26
25914000
(44.68)
9.47
1.15
72.43
75.88
RBLBANK
525.75
7.10
10855000
(13.32)
-24.12
1.00
72.28
-
RECLTD
175.55
2.51
31566000
(18.19)
6.88
0.54
84.43
80.00
RELCAPITAL
663.75
1.49
11008500
37.08
6.72
0.37
87.38
83.36
REPCOHOME
775.30
-
287700
-
7.79
0.00
79.04
-
SBIN
300.15
9.38
55539000
(26.85)
6.29
0.78
73.35
72.99
SOUTHBANK
30.65
11.05
100549794
8.94
-8.44
0.43
71.73
82.69
SREINFRA
120.30
-
7860000
-
10.07
0.25
80.91
-
SRTRANSFIN
987.15
(0.75)
5850600
118.49
6.38
0.55
86.09
84.30
SYNDIBANK
76.60
3.51
15615000
(0.57)
8.93
0.84
82.86
81.54
UJJIVAN
337.30
9.60
5666400
(7.68)
18.73
4.00
81.51
86.06
UNIONBANK
156.05
7.44
15608000
(26.11)
7.74
0.91
80.62
81.07
YESBANK
1791.00
23.91
8578150
6.14
3.01
0.84
76.18
75.79
CAPITAL GOODS & INFRASTRUCTURE
ADANIPORTS
393.05
7.24
5097500
(23.00)
1.46
0.60
71.77
76.07
BEML
1668.85
14.15
2021400
8.54
6.60
0.23
88.29
87.34
BHEL
142.75
4.69
26465000
(18.38)
3.30
0.88
83.60
84.98
CGPOWER
85.25
4.73
16896000
11.48
8.63
0.37
82.73
83.32
ENGINERSIN
161.30
5.63
12705000
(5.22)
8.80
0.57
84.50
81.37
GMRINFRA
19.55
1.30
273825000
23.75
13.51
0.53
91.13
87.55
HAVELLS
464.05
2.64
3354000
(23.14)
5.65
1.14
75.20
74.76
HCC
41.15
2.75
22296000
50.20
10.24
0.64
85.90
-
IRB
216.55
2.34
20922500
9.37
-5.51
1.08
86.24
86.75
For Private Circulation Only
SEBI Registration No: INB 010996539
5
Derivatives Rollover Report
Average
Price
OI
Rollover
Change
Change
Rollover
(3month)
Scrip
Price
(%)
OI Futures
(%)
COC (%)
PCR-OI
(%)
(%)
JPASSOCIAT
29.05
27.13
170340000
7.74
10.88
0.41
87.34
88.77
LT
1175.65
(31.28)
7790250
(11.70)
-5.65
0.64
67.88
68.04
NBCC
208.95
1.51
3975000
4.00
2.25
0.31
84.83
85.05
RELINFRA
511.45
0.92
8522800
(3.57)
5.95
0.80
80.84
85.83
SIEMENS
1398.65
6.99
658500
(11.13)
6.11
0.40
81.35
77.73
VOLTAS
505.30
10.90
2650000
(54.96)
-21.43
0.52
56.84
71.89
CEMENT
ACC
1742.70
9.60
1003600
(20.42)
6.44
0.42
66.24
73.62
AMBUJACEM
265.20
7.17
8350000
(29.22)
2.36
0.58
81.05
80.40
DALMIABHA
2643.55
8.56
714300
(2.90)
6.69
0.73
82.08
86.29
GRASIM
1078.75
(11.81)
2435250
(52.39)
7.89
0.89
89.55
77.99
INDIACEM
216.60
7.92
26040000
10.80
6.54
0.34
85.66
87.28
RAMCOCEM
662.70
(2.26)
632800
75.78
7.21
0.00
82.22
-
SHREECEM
17682.85
5.49
31000
28.90
10.03
0.00
79.69
79.76
ULTRACEMCO
4068.60
2.65
1401200
(22.01)
6.62
0.49
84.18
80.75
CHEMICALS & FERTILIZERS
GSFC
134.50
15.35
10381500
43.38
8.21
0.36
92.21
88.95
PIDILITIND
788.80
(0.72)
1451000
(8.34)
-0.53
0.59
76.09
85.34
TATACHEM
615.05
2.32
4738500
47.00
-9.66
0.61
90.18
87.58
UPL
872.70
5.00
4840800
(27.29)
4.92
0.78
85.54
78.47
CONSUMER GOODS & FMCG
ASIANPAINT
1153.40
3.97
2465400
(17.24)
4.18
0.88
73.89
77.67
BERGEPAINT
251.05
5.15
1062600
(12.50)
8.59
0.72
70.51
77.63
BRITANNIA
3873.75
6.00
300600
4.38
-0.58
0.20
84.06
83.46
COLPAL
1085.65
(0.02)
1396500
40.99
7.74
0.73
72.86
73.85
DABUR
312.05
7.88
12905000
10.16
0.50
0.78
78.65
87.29
GODFRYPHLP
1154.00
(5.91)
732500
44.05
7.83
0.40
74.74
81.81
GODREJCP
1075.20
12.76
1247200
(15.36)
1.17
1.80
69.38
75.20
HINDUNILVR
1175.25
7.56
8547000
(0.97)
2.98
0.37
77.13
80.21
ITC
290.60
(6.99)
41800800
7.59
7.41
0.45
71.77
72.65
JUBLFOOD
1278.40
35.25
1647500
(31.41)
-0.04
0.52
72.29
79.53
MARICO
328.55
4.48
2685800
(33.48)
7.19
0.70
71.29
74.26
MCDOWELL-N
2563.40
8.47
1883500
(10.89)
7.21
0.37
87.67
86.93
NESTLEIND
6849.15
1.02
87300
39.01
7.59
0.00
86.78
83.19
TATAGLOBAL
167.40
13.68
28269000
(7.92)
-6.19
0.49
90.15
91.19
TITAN
530.65
3.63
3144000
(10.58)
6.33
0.86
78.21
78.96
UBL
817.60
3.93
888300
25.40
8.75
0.83
84.71
77.25
For Private Circulation Only
SEBI Registration No: INB 010996539
6
Derivatives Rollover Report
Average
Price
OI
Rollover
Change
Change
Rollover
(3month)
Scrip
Price
(%)
OI Futures
(%)
COC (%)
PCR-OI
(%)
(%)
METALS & MINING
COALINDIA
257.20
4.26
20782500
(9.67)
7.97
0.46
79.79
82.09
HINDALCO
221.95
14.76
32340000
(17.71)
3.30
0.45
80.61
84.22
HINDZINC
277.45
5.27
9875200
(40.02)
8.72
0.33
85.77
87.16
JINDALSTEL
153.50
24.14
34528500
(16.67)
4.43
0.59
86.62
89.56
JSWSTEEL
215.60
4.48
52941000
0.88
3.88
0.58
83.76
81.84
NATIONALUM
70.75
8.26
10248000
158.79
5.93
0.75
80.31
-
NMDC
123.55
13.92
23274000
(24.31)
8.94
0.59
86.16
86.83
SAIL
63.80
9.34
48396000
(24.77)
8.24
0.70
87.09
84.12
TATASTEEL
563.30
6.94
21160000
(26.29)
3.81
0.64
86.96
86.01
VEDL
281.90
11.69
40218500
(17.83)
7.45
0.53
80.86
81.28
INFORMATION TECHNOLOGY
HCLTECH
895.25
5.54
5382300
(13.22)
5.86
0.39
78.96
77.50
HEXAWARE
259.80
5.22
3804000
53.14
6.67
0.27
79.15
76.99
INFY
976.90
4.50
25303000
(23.42)
6.28
0.55
81.35
83.75
KPIT
124.20
(0.72)
14128000
249.70
-7.92
0.78
88.81
83.92
MINDTREE
485.45
(7.96)
4636800
24.32
7.90
0.37
83.29
77.85
NIITTECH
528.60
(7.70)
985500
124.23
8.85
0.20
74.66
72.10
OFSS
3630.55
1.04
64500
(18.71)
4.54
0.00
83.50
73.42
TATAELXSI
1751.25
9.48
1310400
14.03
8.83
1.77
90.60
88.55
TCS
2502.00
6.91
5283250
(16.18)
8.53
0.43
71.79
75.60
TECHM
379.75
(0.78)
8166400
(28.94)
6.91
1.16
60.76
77.85
WIPRO
290.35
12.10
19694400
(21.19)
2.34
0.95
78.88
82.28
MISCELLANIOUS
ADANIENT
139.15
3.57
22896000
2.32
4.89
0.55
86.33
85.95
APOLLOHOSP
1301.10
1.24
899500
(37.34)
2.65
1.29
65.13
75.85
BALRAMCHIN
154.55
2.49
10874500
(5.68)
-0.67
0.37
68.12
82.40
BATAINDIA
574.75
9.21
3685000
(16.83)
6.57
0.34
75.72
84.63
BEL
178.60
10.86
19917000
(30.67)
6.76
0.46
80.33
86.05
CONCOR
1169.50
2.61
806250
(15.91)
4.57
1.41
72.15
77.98
CUMMINSIND
967.60
6.89
363600
(27.08)
8.69
0.68
71.04
75.18
GODREJIND
673.20
6.30
1935000
9.04
6.31
1.00
82.90
84.90
INDIGO
1246.40
1.73
1813200
66.59
2.43
0.93
82.75
81.53
INFIBEAM
1353.50
30.34
1282400
19.76
0.89
0.00
55.68
68.33
JETAIRWAYS
577.90
0.86
3510000
16.26
7.91
0.48
79.59
77.92
JISLJALEQS
106.65
3.24
36297000
0.00
9.37
0.51
87.85
87.33
JUSTDIAL
382.05
1.81
4077600
4.78
8.67
0.16
80.75
80.53
KAJARIACER
658.25
(0.90)
483200
26.89
2.62
3.00
85.19
-
KSCL
664.90
(1.34)
4032000
12.66
16.00
0.42
86.10
81.72
For Private Circulation Only
SEBI Registration No: INB 010996539
7
Derivatives Rollover Report
Average
Price
OI
Rollover
Change
Change
Rollover
(3month)
Scrip
Price
(%)
OI Futures
(%)
COC (%)
PCR-OI
(%)
(%)
MCX
1111.60
2.65
1348000
12.33
-3.27
0.66
92.87
80.54
PCJEWELLER
247.90
(0.51)
5136000
20.22
6.99
0.54
82.47
75.24
RDEL
63.00
6.60
11700000
(3.27)
9.18
0.58
84.36
75.78
SINTEX
34.95
40.93
17926500
(16.72)
7.51
0.26
73.70
81.08
VGUARD
195.00
12.33
3321000
2.69
7.81
1.04
86.62
85.93
OIL & GAS
BPCL
480.10
14.67
9599400
(50.27)
6.34
0.70
74.54
78.30
CHENNPETRO
370.00
-
1254000
-
-46.71
0.00
77.05
-
GAIL
378.00
3.79
8976000
(27.58)
-1.93
0.34
84.30
80.53
HINDPETRO
369.80
8.60
23760450
(10.99)
7.38
0.38
87.63
87.79
IGL
1179.20
11.23
974050
(30.98)
1.95
0.80
70.31
78.86
IOC
370.90
(4.76)
20895000
(15.13)
5.65
0.87
85.98
85.57
MGL
985.30
(0.12)
738000
91.29
7.73
1.13
81.19
81.01
MRPL
116.75
(1.81)
9445500
95.99
-43.24
0.55
68.51
70.45
OIL
281.30
5.20
2034868
(3.23)
8.60
0.71
85.85
82.49
ONGC
163.75
3.05
46751250
(17.49)
5.44
0.46
79.03
83.11
PETRONET
207.15
(4.48)
13638000
(12.96)
6.08
0.79
75.80
76.25
RELIANCE
1606.65
15.47
11622500
5.30
7.75
0.63
73.75
77.80
PHARMACEUTICAL
AJANTPHARM
1421.15
(8.68)
616400
96.06
7.91
1.09
73.24
78.37
AUROPHARMA
744.15
10.38
10782400
(14.67)
7.62
0.47
85.84
83.20
BIOCON
402.60
21.76
8625600
(24.68)
8.62
0.56
75.54
75.60
CADILAHC
544.25
3.76
2262400
(22.22)
7.43
0.32
82.59
81.60
CIPLA
571.50
4.56
5196000
(12.76)
5.13
0.64
76.23
80.23
DIVISLAB
663.65
3.32
7321600
(4.09)
5.45
0.43
82.81
85.15
DRREDDY
2634.70
(0.46)
2652000
22.14
5.71
0.90
87.35
87.91
FORTIS
164.80
(0.42)
31962600
12.91
7.33
0.70
88.88
90.97
GLENMARK
718.10
13.79
4640300
(32.05)
2.84
0.35
84.07
83.02
GRANULES
138.25
3.17
14055000
7.37
7.98
0.48
87.65
87.53
LUPIN
1116.50
5.61
6424800
(18.67)
6.06
1.04
81.86
76.10
PEL
2864.20
3.28
700500
(28.57)
8.59
1.20
80.27
83.86
STAR
1087.65
11.30
1853000
(16.02)
7.97
0.40
87.47
87.45
SUNPHARMA
576.45
6.85
28827200
(15.70)
7.93
0.52
73.09
81.13
TORNTPHARM
1280.50
7.38
196400
(12.01)
9.24
1.25
76.01
67.84
WOCKPHARMA
623.05
1.91
3360000
(10.90)
8.27
1.04
86.00
85.70
REAL ESTATE
DLF
197.10
0.79
41070000
28.22
6.66
0.67
80.85
77.72
HDIL
87.50
(0.74)
29424000
9.96
12.06
0.60
81.61
82.22
IBREALEST
227.45
7.80
43930000
77.57
9.48
0.45
91.90
85.16
NCC
89.75
0.17
23528000
17.26
5.26
0.62
83.67
78.31
For Private Circulation Only
SEBI Registration No: INB 010996539
8
Derivatives Rollover Report
POWER
ADANIPOWER
34.25
16.89
95680000
(20.81)
9.22
0.78
85.67
87.26
CESC
905.25
3.65
6496600
(0.86)
8.65
0.81
90.71
90.24
JSWENERGY
67.75
4.55
64965500
2.00
9.32
1.20
92.26
92.40
NHPC
30.55
(5.42)
28728000
40.93
8.60
0.48
78.18
79.87
NTPC
165.95
4.31
15104000
(9.88)
3.47
0.32
65.28
72.27
POWERGRID
217.70
4.16
7868000
(59.84)
5.05
0.32
40.08
70.25
PTC
114.80
20.40
12920000
2.28
8.24
0.86
79.71
83.78
RPOWER
45.25
4.62
55812000
3.38
6.96
0.39
91.79
89.88
SUZLON
20.00
9.29
389160000
2.43
0.00
0.27
62.89
76.87
TATAPOWER
81.30
(1.09)
22194000
(4.42)
-8.90
0.33
85.45
82.83
TORNTPOWER
181.10
1.66
3459000
0.35
9.88
1.30
76.26
82.29
TELECOM
BHARTIARTL
419.10
9.11
28265900
(18.48)
7.65
1.09
74.66
77.88
IDEA
93.30
10.22
56728000
(17.48)
6.18
0.65
72.96
81.43
INFRATEL
414.00
10.05
4132700
(29.23)
7.48
1.03
66.90
71.65
RCOM
25.95
16.89
98056000
(10.46)
10.14
0.53
73.39
80.31
TATACOMM
679.50
(5.40)
8943900
13.39
7.96
0.80
90.40
84.29
TEXTILES
ARVIND
367.20
1.56
5434000
(8.70)
8.01
1.05
80.86
73.21
CENTURYTEX
1172.65
5.99
7357350
(1.64)
3.44
0.51
95.54
93.63
ICIL
156.35
(9.31)
8449000
(2.58)
8.07
1.29
82.00
83.05
PAGEIND
16775.20
2.61
28800
28.00
6.44
0.00
72.45
70.43
RAYMOND
794.50
9.47
2009600
28.23
10.01
1.32
89.05
87.72
SRF
1548.40
0.28
642000
27.89
1.11
1.52
83.81
80.57
MEDIA
DISHTV
81.75
2.70
16240000
(26.33)
5.77
0.42
65.50
75.43
PVR
1343.30
(5.87)
537200
46.94
10.19
0.52
78.49
80.82
SUNTV
800.45
(1.40)
6447000
(4.57)
7.61
0.93
87.83
87.11
TV18BRDCST
40.85
13.63
81668000
(15.20)
10.31
0.60
89.61
91.43
ZEEL
541.25
10.80
5539300
(34.30)
3.77
0.34
0.00
82.52
For Private Circulation Only
SEBI Registration No: INB 010996539
9
Derivatives Rollover Report
Research Team Tel: 022 - 39357800
DISCLAIMER
Angel Broking Private Limited (hereinafter referred to as “Angel”) is a registered Member of National Stock Exchange of India Limited, Bombay Stock
Exchange Limited and MCX Stock Exchange Limited. It is also registered as a Depository Participant with CDSL and Portfolio Manager with SEBI. It
also has registration with AMFI as a Mutual Fund Distributor. Angel Broking Private Limited is a registered entity with SEBI for Research Analyst in
terms of SEBI (Research Analyst) Regulations, 2014 vide registration number INH000000164. Angel or its associates has not been debarred/
suspended by SEBI or any other regulatory authority for accessing /dealing in securities Market. Angel or its associates including its relatives/analyst
do not hold any financial interest/beneficial ownership of more than 1% in the company covered by Analyst. Angel or its associates/analyst has not
received any compensation / managed or co-managed public offering of securities of the company covered by Analyst during the past twelve
months. Angel/analyst has not served as an officer, director or employee of company covered by Analyst and has not been engaged in market
making activity of the company covered by Analyst.
This document is solely for the personal information of the recipient, and must not be singularly used as the basis of any investment decision.
Nothing in this document should be construed as investment or financial advice. Each recipient of this document should make such investigations as
they deem necessary to arrive at an independent evaluation of an investment in the securities of the companies referred to in this document
(including the merits and risks involved), and should consult their own advisors to determine the merits and risks of such an investment.
Reports based on technical and derivative analysis center on studying charts of a stock's price movement, outstanding positions and trading volume,
as opposed to focusing on a company's fundamentals and, as such, may not match with a report on a company's fundamentals.
The information in this document has been printed on the basis of publicly available information, internal data and other reliable sources believed to
be true, but we do not represent that it is accurate or complete and it should not be relied on as such, as this document is for general guidance only.
Angel Broking Pvt. Limited or any of its affiliates/ group companies shall not be in any way responsible for any loss or damage that may arise to any
person from any inadvertent error in the information contained in this report. Angel Broking Pvt. Limited has not independently verified all the
information contained within this document. Accordingly, we cannot testify, nor make any representation or warranty, express or implied, to the
accuracy, contents or data contained within this document. While Angel Broking Pvt. Limited endeavors to update on a reasonable basis the
information discussed in this material, there may be regulatory, compliance, or other reasons that prevent us from doing so.
This document is being supplied to you solely for your information, and its contents, information or data may not be reproduced, redistributed or
passed on, directly or indirectly.
Neither Angel Broking Pvt. Limited, nor its directors, employees or affiliates shall be liable for any loss or damage that may arise from or in
connection with the use of this information.
Note: Please refer to the important ‘Stock Holding Disclosure' report on the Angel website (Research Section). Also, please refer to the latest update
on respective stocks for the disclosure status in respect of those stocks. Angel Broking Pvt. Limited and its affiliates may have investment positions in
the stocks recommended in this report.
Derivative Research Team
For Private Circulation Only
SEBI Registration No: INB 010996539
10