Derivatives
Rollover Report
January 27, 2017
Nifty (73.12%) inaugurated the first series of year 2017 with a constructive move. Rollover in Nifty in terms of
percentage as well as open interest is on the upper side. Nifty rallied nearly 6% MoM with good amount of long
positions and rollover figure suggests that these positions are still intact. FIIs too added significant longs in Index
Futures in recent up move and as a result, their Long-Short ratio in Index future segment jumped from 67% to 82%.
They rolled more than 75% of their longs, which clearly depicts their optimistic stance on our market ahead of ‘Union
Budget’. On options front, being start of new series the overall build-up is quite scattered. However, 8700 & 9000 call
options and 8400 & 8500 put options are attracting trader’s attention. At current juncture, the overall data indicates
continuation in ongoing momentum in near term too. Thus, traders are advised to avoid shorting in index and use
declines as a buying opportunity.
Rollover in BANKNIFTY (60.79%) are below its average in percentage terms; however, its inline in terms of open
interest. We witnessed good amount of longs in the range of 18400 - 19000 and we believe these positions got rolled
too. The overall banking and financial basket (except LICHSGFIN) performed well in January series. At current
juncture, banking index has strong support at 18700-19000 levels. Considering overall data, it’s advisable to trade
banking stocks with positive bias in near term.
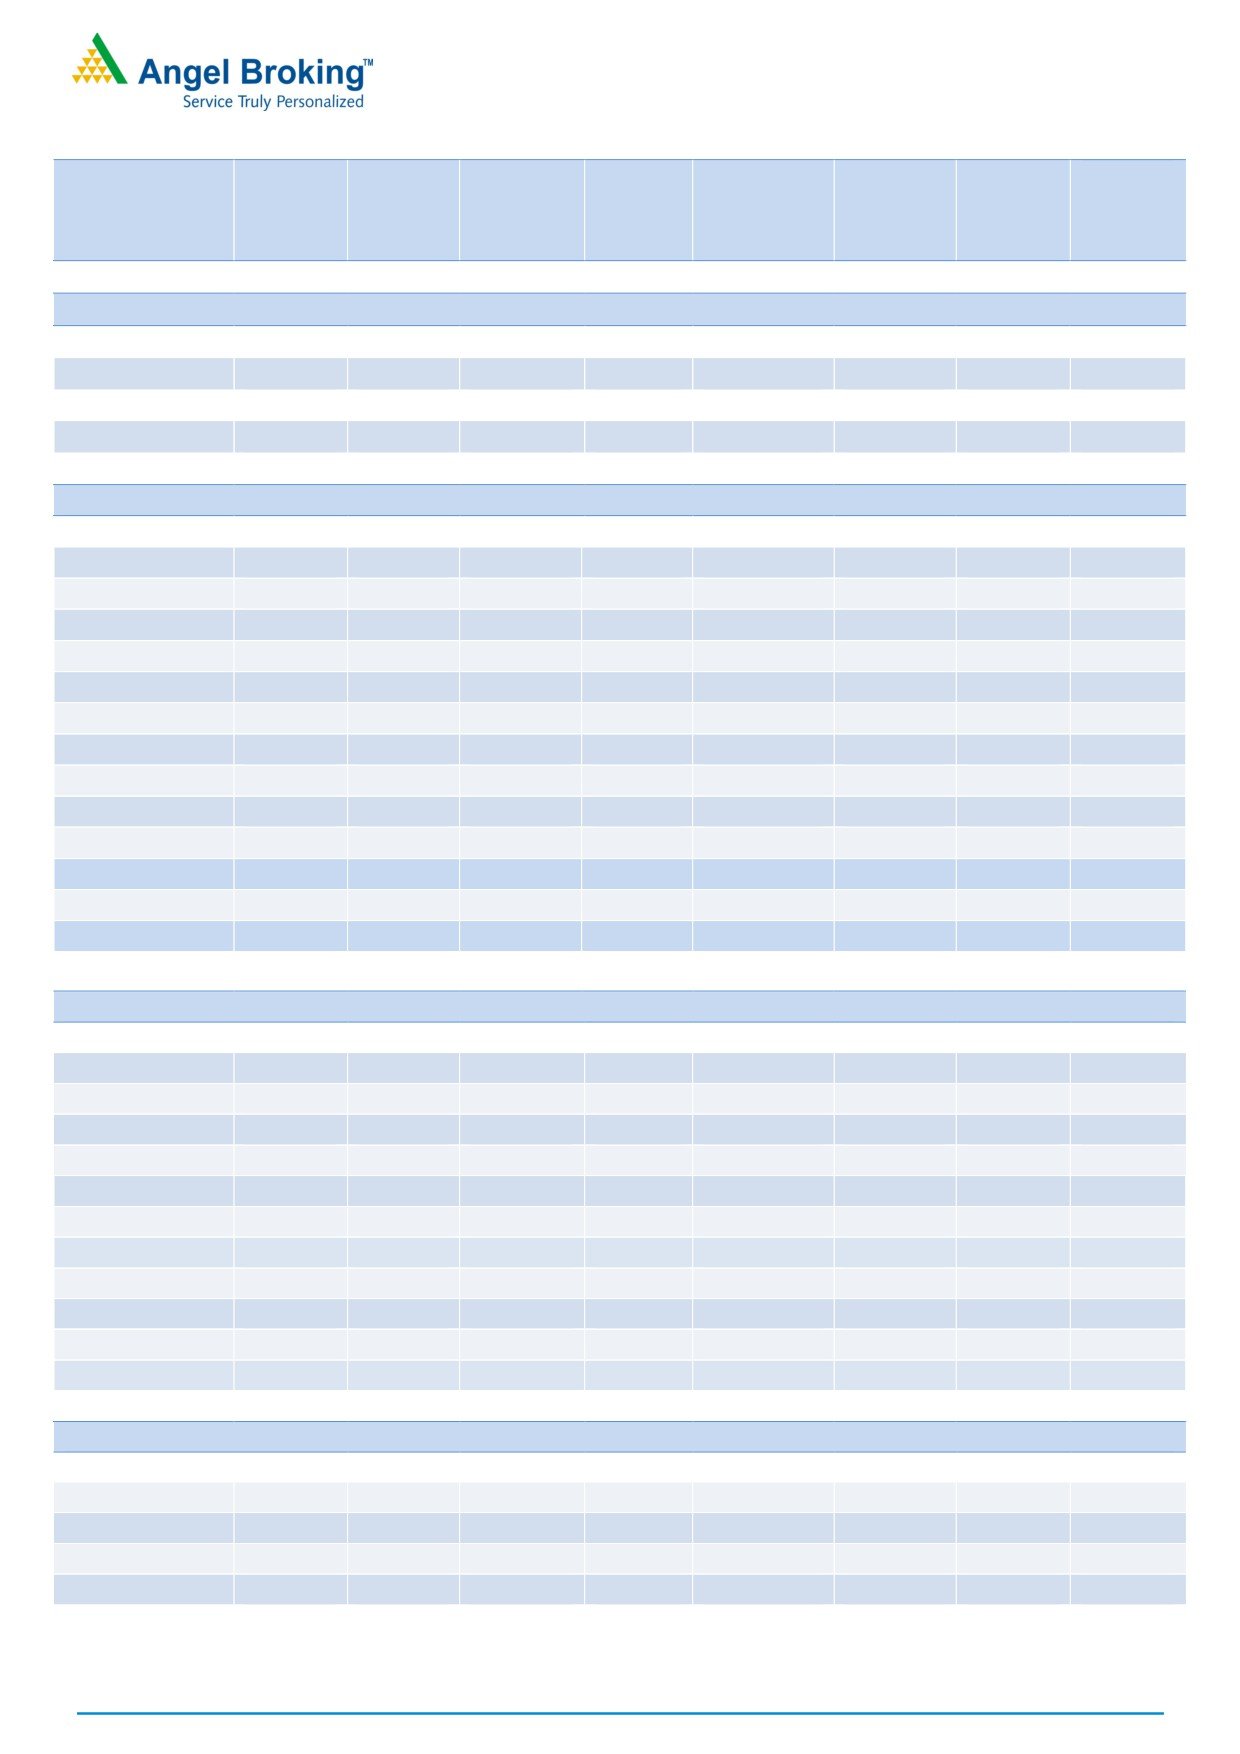
Indices Change
NIFTY & PCR Graph
Price
Change
3 month
INDEX
Price
(%)
Rollover
avg.
NIFTY
8614.85
6.13
73.12
68.57
BANKNIFTY
19509.85
7.95
60.79
63.45
NIFTYIT
10184.00
(1.29)
82.08
80.37
NIFTYMID50
3622.15
(12.13)
-
-
NIFTYINFRA
2713.70
(6.82)
-
-
Monthly Gainers
Monthly Losers
Price
Ol
Price
Ol
Change Open
Change
Change Open
Change
Scrip
Price
(%)
Interest
(%)
Scrip
Price
(%)
Interest
(%)
JPASSOCIAT
10.85
44.67
121516000
1.59
DIVISLAB
677.95
(14.47)
6937800
128.97
HAVELLS
421.85
28.38
4696000
27.61
MINDTREE
464.05
(11.21)
2576400
41.25
INDIACEM
143.85
27.02
22526000
(16.10)
RCOM
31.05
(7.73)
102444000
9.53
SAIL
62.00
26.92
43800000
(11.36)
INFY
940.25
(5.61)
17068000
26.01
DLF
137.85
25.95
28030000
(16.01)
HEXAWARE
197.25
(4.25)
4674000
9.56
Note: Stocks which have more than 1000 contract in Futures OI.
Note: Stocks which have more than 1000 contract in Futures OI.
SEBI Registration No: INB 010996539
1
Derivatives Rollover Report
Banking and Financials
HDFCBANK (74.38%) bounced from `1188 levels
last series with good amount of open interest
addition. In terms of percentage the rollover may
seem to be on the lower side but it’s high if open
interest is considered. Thus, any dip near `1250-
`1270 shall be a buying opportunity.
SBIN (70.61%) is nearly 5% up series on series which
was mainly due to short covering. However, we saw
some fresh in last two-three trading session and we
believe these positions are still intact. Thus, one
should form fresh long between `252- `256 levels for
the target of `278.
LICSGFIN (77.24%) is the only counter in this space
that closed in red series on series. We witnessed
significant build-up in correction from `560 to `517
levels. Although, this counter gave decent short
covering bounced, still meaningful short are intact.
Thus, we expect the up move to continue due to
further short covering.
Auto & Auto Ancillaries
TVSMOTORS (85.73%) rallied nearly 10% last series
with good amount of longs. Rollover in this counter is
above its averages both in terms of OI and
percentage. Thus, this counter is a buy on dip for us.
HEROMOTOCO (83.46%) traded in a narrow range
in the start of January series. In last
3 trading
sessions, we witnessed huge long positions when it
bounced from `3058 levels and we believe these
positions have been rolled too. Thus, traders are
suggested to trade with a positive bias.
Rollover in MARUTI (75.51%) is on the lower side.
This counter rallied more than 9% but surprisingly no
relevant longs were visible. Thus, trades should avoid
forming longs at current levels unless we see relevant
fresh longs in system.
Oil & Gas
RELIANCE (86.91%) is the only counter in large cap
We
that underperformed (except some IT stocks).
witness huge short formation in this counter when it
corrected from
`1090-`1092 levels. At present.
RELIANCE is trading near its support zone of Rs.
`1000-`1020 levels. We expect some short covering
bounce which may bring it near `1080-`1082 levels.
GAIL (79.98%) rallied nearly with 70% (MoM) rise in
open interest. Majority of the positions formed were on
long side and these positions got rolled too. Thus, any
dip near
`460-`465 levels shall be a buying
opportunity. One can expect `480-`482 levels in near
term.
Few counters like CAIRN
(91.54%), PETRONET
(87.38%) and IGL (79.02%) has high rollovers in this
space.
For Private Circulation Only
SEBI Registration No: INB 010996539
2
Derivatives Rollover Report
Metal & Mining
HINDALCO (88.28%) was one of the major gainer in
this space. The stock has added good amount of long
positions and the same got rolled too. Stock has
breached its immediate resistance of `180 - `182
and managed to sustain above the same. Stock may
rally further towards `198 - `200 levels. Thus, trade
with positive bias.
VEDL
(76.84%) is continuously attracting long
positions. From last few months, corrections are not
supported by short formations; while, we witnessed
good amount of long build-up in up moves. Traders
should use declines as a buying opportunity.
Some of the liquid counters with high rollovers in this
space are JINDALSTEL (92.11%), JSWSTEEL (86.05%)
and SAIL (85.74%).
Pharmaceuticals
Open Interest of LUPIN (70.42%) remained flat on
Month-on-Month basis and rollovers are also below
its quarterly average. In last few days, we witnessed
long build-up in the stock and any move above its
resistance of `1530 - `1540 may result into decent
rally in the counter.
DIVISLAB (87.60%) was the biggest loser in this space
and added huge amount of short positions in last
series. Shorts positions have got rolled too. Traders
should avoid bottom fishing at current juncture.
Rollover in DRREDDY (70.75%) is below its averages.
Recently, the stock has rebounded from its support
zone of `2900 - `2920 along with formation of fresh
longs. Currently, the stock is light on positions and
further long build-up may lead to an up move
towards `3120 - `3140 levels.
IT
INFY (79.78%) was one of the major Nifty losers in
January series and we also witnessed short
formations in that correction. Most of the shorts are
still intact in the system and thus traders should
refrain forming long positions at current levels.
HCLTECH (82.68%) has added mixed positions in last
series and most of them are still intact. Rollovers are
marginally higher than its average. Currently, the
stock has strong support at `830 levels and resistance
at
`880 levels. Traders should wait for further
development in data before initiating any fresh
position in the counter.
MINDTREE (88.50%) was the major loser in this space
and added highest OI on Month-on-Month basis.
Stock added huge shorts in January series and
rollovers are also above its average. The stock may
continue to correct towards its strong support zone of
`420 - `425.
For Private Circulation Only
SEBI Registration No: INB 010996539
3
Derivatives Rollover Report
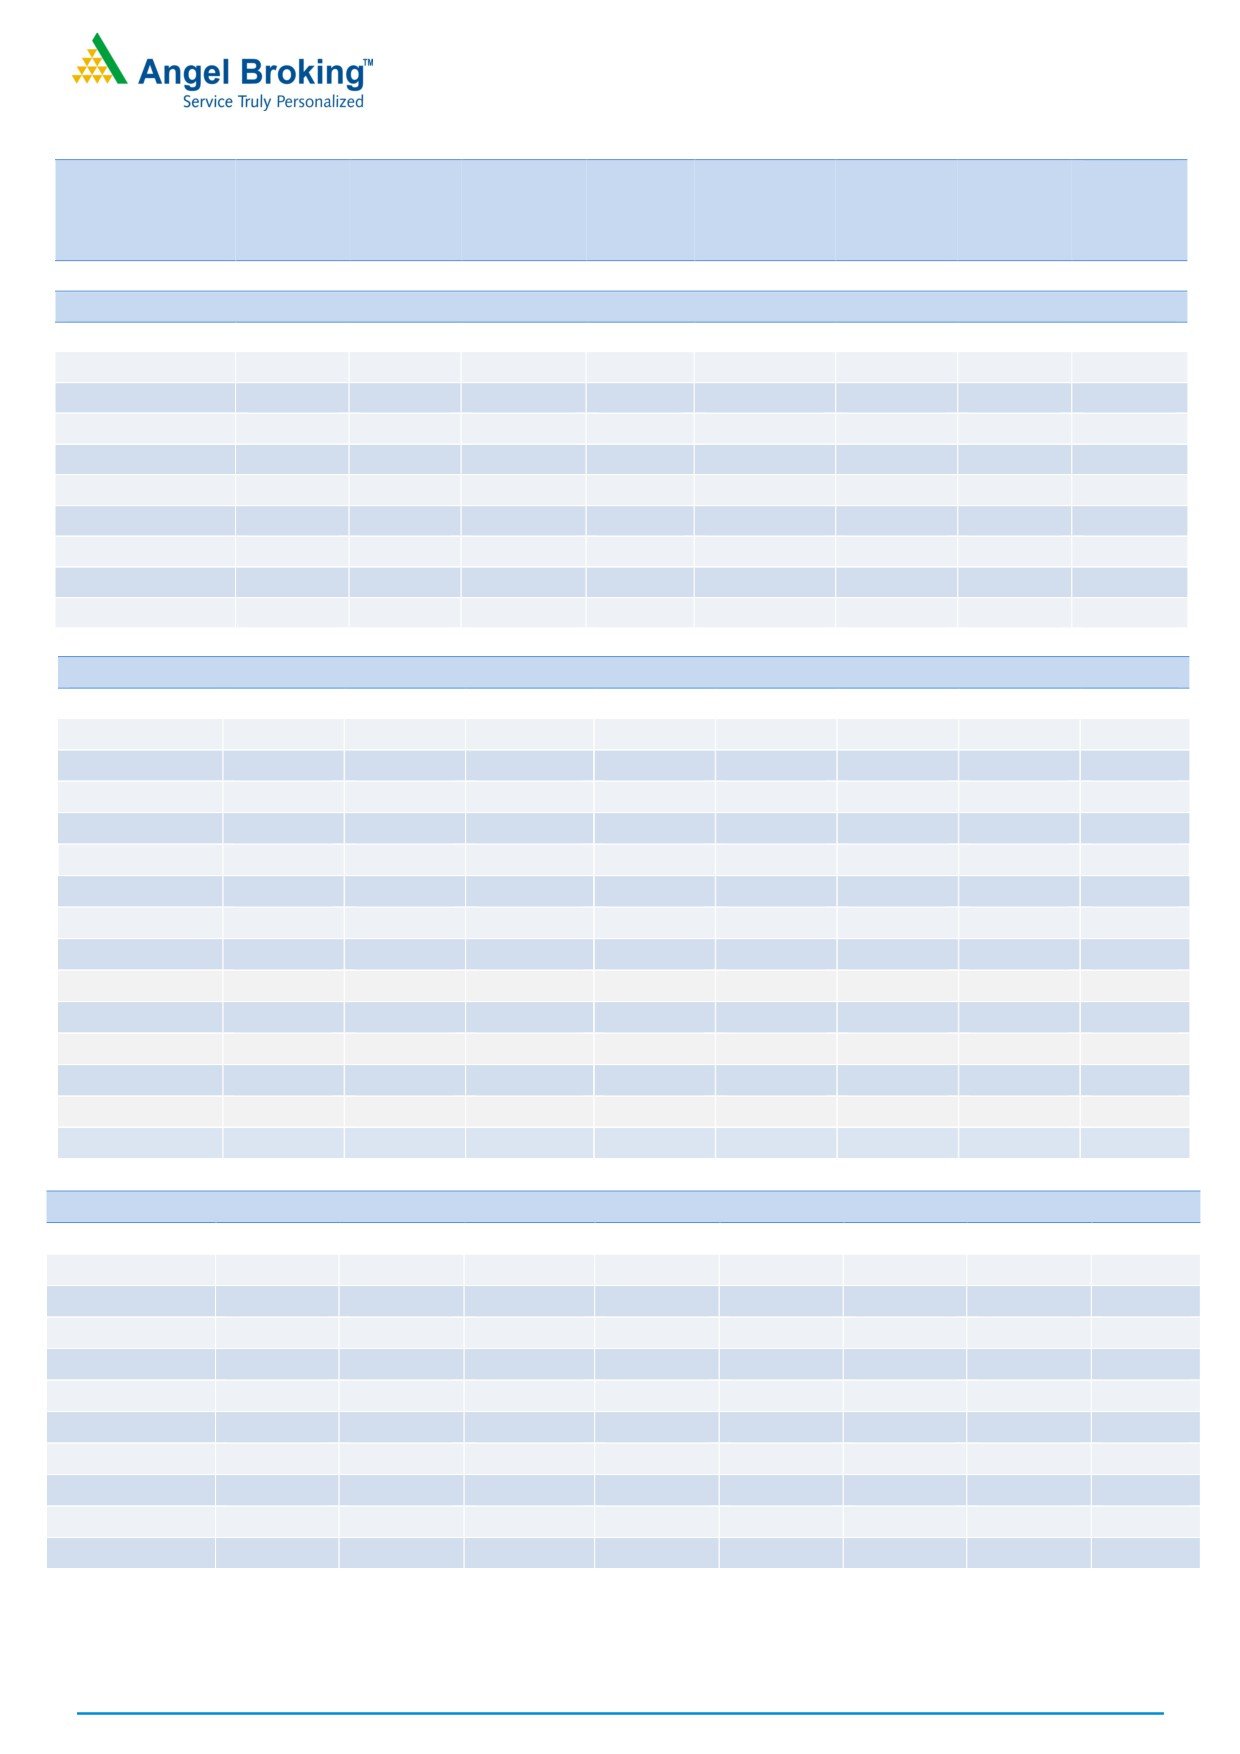
Average
Price
OI
Rollover
Change
Change
Rollover
(3month)
Scrip
Price
(%)
OI Futures
(%)
COC (%)
PCR-OI
(%)
(%)
AUTO & AUTO ANCILLARIES
AMARAJABAT
891.15
2.04
588600
13.41
7.10
1.12
71.71
74.49
APOLLOTYRE
188.10
0.99
10140000
45.82
9.10
0.51
90.69
85.35
ASHOKLEY
87.05
9.63
62349000
17.18
7.27
0.52
89.38
88.26
BAJAJ-AUTO
2850.85
7.25
1347750
0.71
0.53
0.65
82.07
78.97
BHARATFORG
954.45
4.69
4015200
(13.05)
2.38
0.29
83.08
83.46
BOSCHLTD
22953.90
11.00
73150
5.56
4.18
0.00
77.12
79.87
CASTROLIND
402.10
6.09
9640400
(13.67)
7.72
0.81
92.12
91.12
CEATLTD
1193.15
2.60
1640800
47.33
7.75
0.49
86.05
75.78
EICHERMOT
23118.55
7.46
203950
(3.12)
6.99
0.55
86.84
81.61
EXIDEIND
196.70
9.37
10112000
(5.18)
10.97
0.71
89.90
89.02
HEROMOTOCO
3250.05
6.58
1781800
26.75
1.01
1.30
83.46
80.02
M&M
1248.75
5.87
5401500
7.13
5.01
0.55
86.25
82.16
MARUTI
5828.15
9.38
1962450
(3.80)
5.55
0.61
75.51
77.81
MOTHERSUMI
333.35
1.85
10625000
23.30
7.02
0.76
87.88
88.15
MRF
53390.10
9.39
29730
7.31
7.67
0.00
87.78
85.50
TATAMOTORS
550.05
16.80
26850000
19.08
2.64
0.59
58.38
74.10
TATAMTRDVR
343.65
15.63
15550500
2.05
9.22
0.68
88.48
86.13
TVSMOTOR
391.80
10.07
8294000
30.99
-3.20
0.66
85.73
78.66
BANKING & FINANCIALS
ALBK
66.50
11.30
11950000
(9.40)
0.95
0.84
76.80
81.06
ANDHRABANK
50.15
6.25
19030000
(0.78)
6.31
0.71
73.36
79.04
AXISBANK
464.80
4.31
24571200
(8.30)
3.39
0.57
78.70
79.06
BAJFINANCE
1004.10
20.69
5975000
(26.50)
5.35
0.58
71.21
82.25
BANKBARODA
162.10
6.93
33586000
(0.36)
1.17
1.07
73.82
72.48
BANKINDIA
115.50
10.42
21348000
(10.33)
4.92
0.44
83.62
80.53
BHARATFIN
752.60
25.74
10045000
7.30
5.80
0.59
80.37
84.15
CANBK
276.65
5.94
14028000
4.84
-22.78
0.69
83.51
80.85
DCBBANK
119.10
9.82
3636000
105.08
6.91
0.57
78.52
79.70
DHFL
286.75
16.45
17988000
14.82
7.51
0.59
87.58
88.22
FEDERALBNK
79.20
19.01
50644000
9.54
6.39
0.51
81.36
82.15
HDFC
1341.25
6.28
10684500
19.63
3.62
0.60
76.99
77.75
HDFCBANK
1293.55
7.20
32046500
14.03
2.88
0.50
74.36
80.73
IBULHSGFIN
752.05
16.63
14496800
13.21
-5.66
0.75
92.75
84.08
ICICIBANK
260.80
3.41
52537500
(3.46)
4.12
0.59
69.60
75.03
IDBI
80.35
15.36
20304000
(29.13)
5.51
0.85
82.22
86.21
IDFCBANK
65.85
10.39
48608000
(2.03)
4.80
0.43
92.24
84.22
IDFC
59.65
8.75
60997200
11.06
9.57
0.81
94.40
86.44
IFCI
28.10
0.00
58410000
(5.11)
6.75
0.33
77.88
75.37
For Private Circulation Only
SEBI Registration No: INB 010996539
4
Derivatives Rollover Report
Average
Price
OI
Rollover
Change
Change
Rollover
(3month)
Scrip
Price
(%)
OI Futures
(%)
COC (%)
PCR-OI
(%)
(%)
INDUSINDBK
1271.25
15.00
4491600
0.75
5.82
0.31
65.87
72.70
KOTAKBANK
796.15
11.14
8432000
7.89
1.50
0.43
75.25
73.78
KTKBANK
114.90
1.91
17360750
24.29
7.71
0.67
83.39
85.11
L&TFH
101.70
19.58
23121000
(9.61)
8.72
0.45
82.66
85.56
LICHSGFIN
548.15
(1.76)
9132200
49.08
4.72
0.61
77.24
81.35
M&MFIN
287.05
7.05
10980000
(8.96)
3.30
0.63
69.43
71.79
ORIENTBANK
116.85
13.34
14220000
0.89
8.68
0.89
87.55
81.36
PFC
136.10
13.70
13128000
(6.77)
-23.59
0.60
60.81
61.36
PNB
131.65
16.09
39067000
(24.06)
-15.11
0.88
75.26
80.67
RECLTD
141.50
16.75
24522000
7.50
-42.13
0.45
77.70
77.02
RELCAPITAL
462.20
8.40
11656500
6.44
8.50
0.70
89.85
87.49
SBIN
259.65
4.89
67032000
1.02
2.19
0.71
70.61
77.94
SOUTHBANK
21.45
9.72
39930000
(4.04)
11.85
0.93
91.48
87.42
SRTRANSFIN
957.00
14.59
3461400
5.74
7.47
0.10
89.26
83.10
SYNDIBANK
68.25
10.71
15831000
15.19
-27.07
0.31
68.66
79.96
UNIONBANK
137.05
13.97
17260000
(8.33)
-44.73
0.77
82.33
84.09
YESBANK
1409.60
22.53
8110200
2.12
2.51
0.71
77.55
77.43
CAPITAL GOODS & INFRASTRUCTURE
ADANIPORTS
305.20
15.06
15222500
2.18
2.27
0.47
87.31
84.55
BEML
1246.85
25.91
1554000
97.11
8.90
0.22
81.60
84.77
BHEL
132.50
11.06
32640000
(9.07)
5.73
0.60
77.84
78.83
CROMPGREAV
65.10
11.09
16908000
(5.88)
8.76
0.45
83.52
75.32
ENGINERSIN
152.55
(3.80)
14364000
(11.67)
4.55
0.88
69.68
72.86
GMRINFRA
12.85
9.83
156195000
(2.66)
9.87
0.58
77.13
84.40
HAVELLS
421.85
28.38
4696000
27.61
-5.94
0.63
78.61
80.82
IRB
228.10
17.09
9145000
7.21
-1.10
0.34
88.21
85.71
JPASSOCIAT
10.85
44.67
121516000
1.59
11.71
0.38
87.60
87.27
LT
1453.55
8.11
8153000
5.13
3.30
0.91
72.28
79.17
RELINFRA
524.20
13.64
5651100
(20.95)
8.46
0.67
91.96
87.66
SIEMENS
1180.20
8.85
783000
9.43
0.11
0.25
84.69
80.03
VOLTAS
326.95
1.93
4374000
15.41
3.47
0.66
83.70
74.83
CEMENT
ACC
1399.30
6.76
1298400
9.37
-0.09
0.96
81.93
83.07
AMBUJACEM
228.25
11.40
13370000
8.96
-4.94
0.39
77.14
77.51
GRASIM
930.20
9.84
7676250
(15.02)
2.85
0.60
71.18
82.37
INDIACEM
143.85
27.02
22526000
(16.10)
8.81
0.80
87.04
87.18
ULTRACEMCO
3684.10
14.47
2505200
(0.69)
1.27
0.97
71.65
79.61
For Private Circulation Only
SEBI Registration No: INB 010996539
5
Derivatives Rollover Report
Average
Price
OI
Rollover
Change
Change
Rollover
(3month)
Scrip
Price
(%)
OI Futures
(%)
COC (%)
PCR-OI
(%)
(%)
CHEMICAL & FERTILIZERS
PIDILITIND
680.30
14.90
1149000
(24.41)
-17.06
0.45
79.13
79.31
TATACHEM
539.55
8.87
4531500
24.63
-4.07
0.51
86.74
84.87
UPL
744.80
16.18
5646000
(1.18)
7.82
0.34
91.55
88.61
CONSUMER GOODS & FMCG
ASIANPAINT
980.35
10.92
4920600
(14.76)
3.41
0.49
83.82
77.96
BRITANNIA
3147.10
8.79
1113000
5.88
4.90
1.22
74.99
85.04
COLPAL
903.10
0.82
694400
24.62
7.92
0.22
85.08
82.81
DABUR
282.35
2.88
10885000
(13.46)
4.92
0.18
89.66
89.90
GODREJCP
1544.55
3.61
455600
(17.58)
2.90
0.37
50.55
72.06
HINDUNILVR
871.40
6.31
5320800
10.79
3.19
0.54
82.72
80.37
ITC
266.30
12.55
38882400
(2.14)
3.79
0.69
78.33
78.30
JUBLFOOD
857.95
4.43
1954000
(11.66)
5.75
0.45
78.11
80.33
MARICO
256.35
1.48
5293600
(34.47)
2.46
0.00
78.43
85.55
MCLEODRUSS
154.80
9.98
3816000
3.25
9.42
0.32
79.25
81.18
TATAGLOBAL
129.25
6.12
26865000
3.06
8.83
0.67
94.76
93.34
TITAN
373.00
15.77
6709500
(28.23)
2.87
0.50
72.61
82.39
UBL
826.85
4.84
994000
2.08
6.12
0.80
85.29
77.34
INFORMATION TECHNOLOGY
HCLTECH
838.95
2.71
6346200
21.69
-3.44
0.22
82.68
80.84
HEXAWARE
197.25
(4.25)
4674000
9.56
5.13
0.44
78.37
80.25
INFY
940.25
(5.61)
17068000
26.01
4.90
0.57
79.78
79.99
KPIT
135.15
0.78
3236000
(8.38)
7.49
5.67
77.19
81.34
MINDTREE
464.05
(11.21)
2576400
41.25
6.54
1.00
88.50
83.21
NIITTECH
438.25
2.84
516000
9.55
6.06
3.00
83.90
81.37
OFSS
3366.40
7.67
186150
(4.61)
6.41
0.00
77.27
85.94
TATAELXSI
1471.45
6.11
1246400
4.95
5.76
0.31
75.91
82.89
TCS
2358.30
0.26
4639750
4.49
2.83
0.70
69.15
76.16
TECHM
468.50
(2.97)
8666900
11.46
7.70
1.74
80.23
83.08
WIPRO
472.00
(0.42)
4138800
(16.87)
-4.52
1.20
76.19
73.30
MEDIA
DISHTV
87.45
4.54
35784000
5.77
9.43
0.87
92.32
90.17
SUNTV
539.25
10.13
9220000
41.11
2.10
0.25
85.80
85.31
TV18BRDCST
36.90
(0.27)
85850000
6.29
8.59
1.17
93.57
93.09
ZEEL
500.15
11.37
8587800
5.39
4.93
0.44
77.34
79.98
For Private Circulation Only
SEBI Registration No: INB 010996539
6
Derivatives Rollover Report
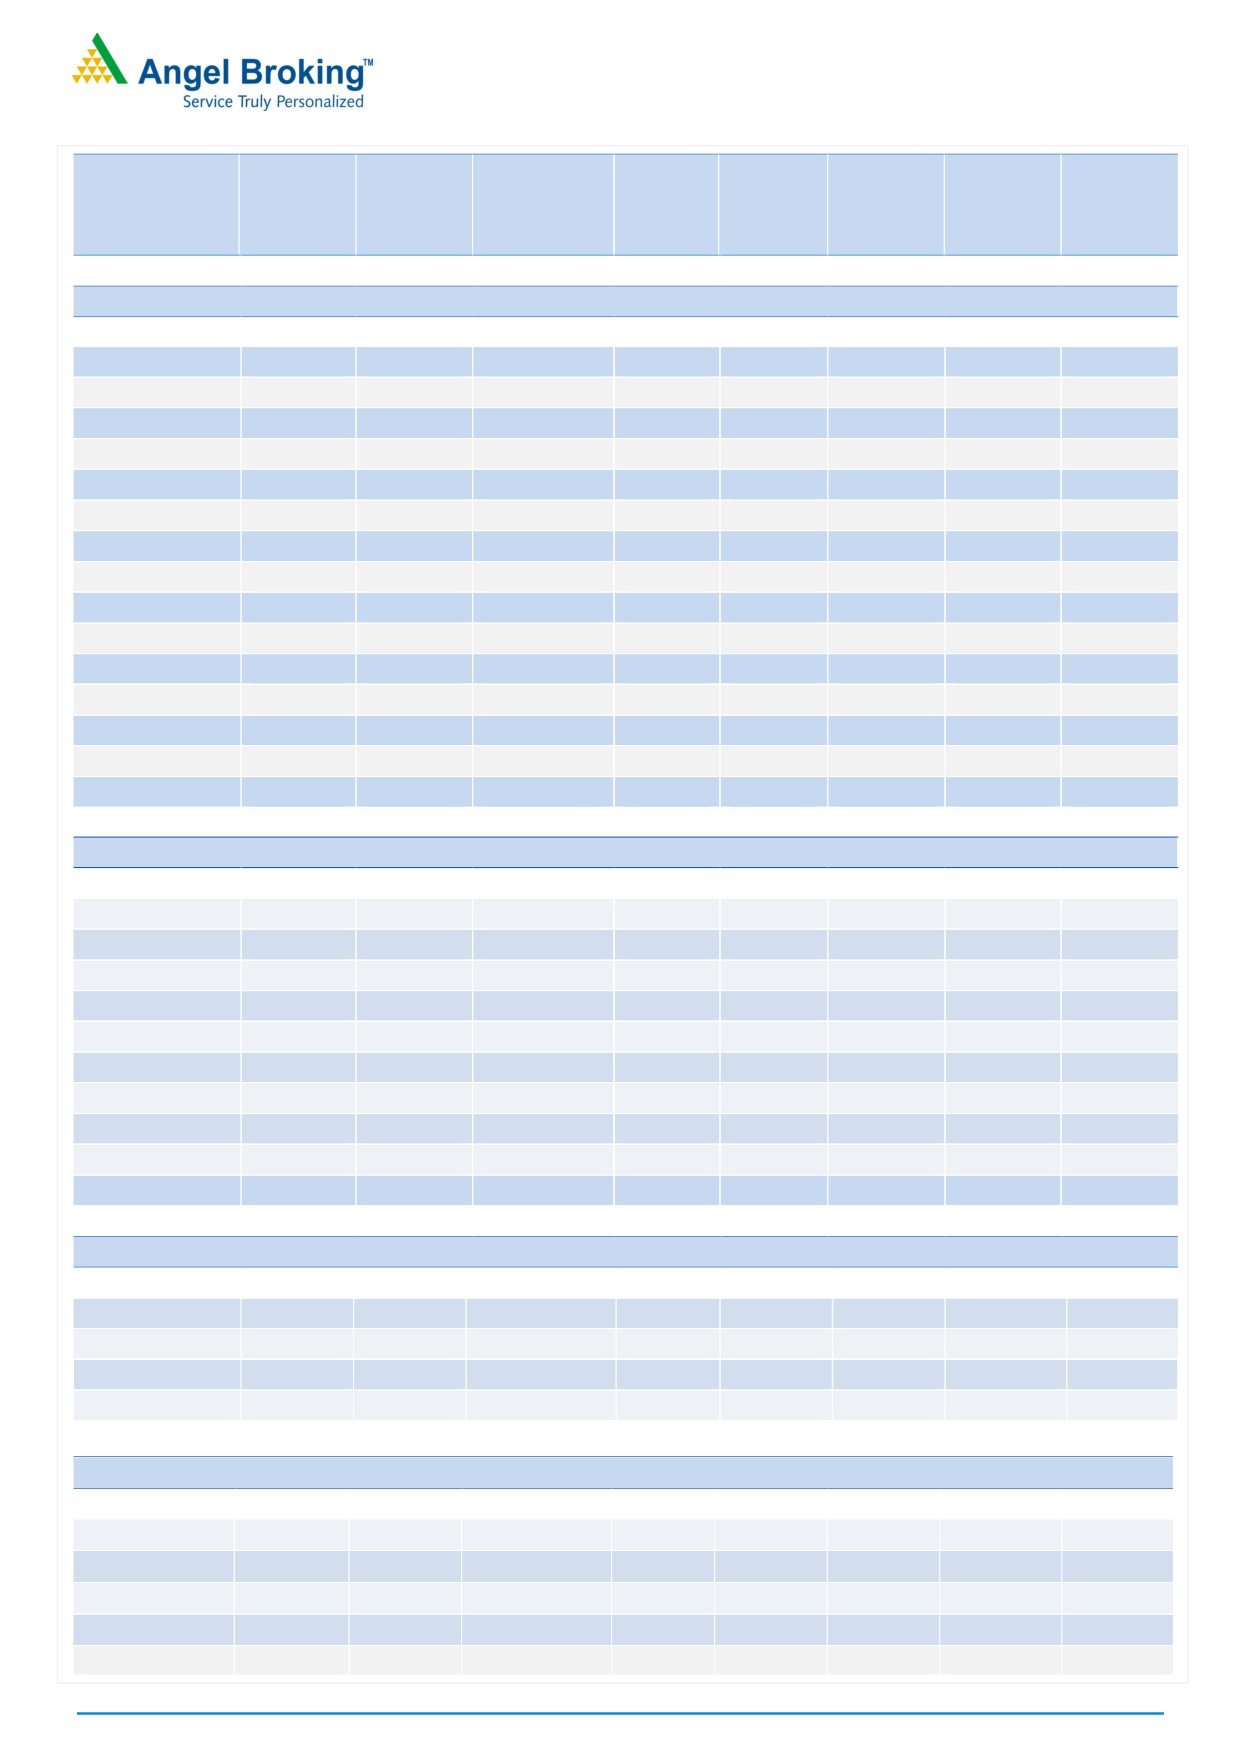
Average
Price
OI
Rollover
Change
Change
Rollover
(3month)
Scrip
Price
(%)
OI Futures
(%)
COC (%)
PCR-OI
(%)
(%)
METALS & MINING
COALINDIA
310.25
4.67
13542200
40.94
-27.58
0.51
75.72
75.03
HINDALCO
191.20
23.00
41709500
18.27
2.97
0.72
88.28
88.30
HINDZINC
301.50
17.04
7321600
(8.19)
4.40
0.43
80.17
84.83
JINDALSTEL
83.00
18.74
49185000
5.58
12.25
0.24
92.11
92.63
JSWSTEEL
196.80
22.69
51165000
(0.10)
4.17
1.35
86.05
84.43
NMDC
145.60
17.85
19458000
8.28
4.77
0.61
79.29
82.97
SAIL
62.00
26.92
43800000
(11.36)
-1.01
0.36
85.74
86.33
TATASTEEL
471.65
19.91
20414000
0.82
5.76
0.51
81.63
84.65
VEDL
258.40
19.13
39557000
(0.77)
-0.97
0.53
76.84
80.06
MISCELLANIOUS
ABIRLANUVO
1375.15
10.36
3041200
(21.96)
3.44
0.44
92.91
91.69
ADANIENT
80.45
9.60
13912000
2.72
7.08
0.56
88.77
87.82
BATAINDIA
478.75
7.69
2827000
1.58
-1.58
0.45
85.70
80.99
BEL
1520.85
10.97
2051550
30.41
5.32
0.27
86.97
84.92
CONCOR
1181.90
6.25
1108000
50.85
-12.55
0.28
80.58
80.21
CUMMINSIND
839.90
3.32
497400
(12.92)
2.85
0.14
87.17
87.93
GODREJIND
431.05
1.83
1014000
(21.94)
10.30
1.33
72.92
79.43
JETAIRWAYS
419.15
21.90
4162000
(23.37)
7.25
0.53
73.16
83.54
JISLJALEQS
95.05
9.76
38394000
2.08
10.01
0.26
88.69
89.43
JUSTDIAL
361.15
8.94
3066000
(24.14)
-1.57
0.82
80.42
80.36
KSCL
494.45
20.83
2272500
(2.57)
9.23
0.17
85.06
82.69
MCDOWELL-N
2207.75
14.82
2438000
3.01
7.80
0.20
91.96
90.07
PCJEWELLER
387.15
5.08
961500
55.21
-5.66
0.80
75.59
57.78
SINTEX
85.75
16.43
26269875
9.60
8.87
0.38
89.82
89.17
OIL & GAS
BPCL
696.25
9.91
12639600
(7.75)
-26.46
0.51
75.70
77.43
CAIRN
282.30
16.27
22428000
6.18
7.63
0.41
91.54
86.90
GAIL
471.15
11.26
8965500
70.63
-12.56
0.44
79.98
74.99
HINDPETRO
522.15
22.53
21533400
(5.34)
-51.55
0.60
76.31
81.01
IGL
939.45
4.64
1388200
6.77
8.02
1.08
79.02
75.91
IOC
367.40
15.26
15945000
10.89
-42.69
0.43
75.01
76.41
OIL
335.65
2.12
2367970
24.81
-7.64
0.38
78.28
73.80
ONGC
203.15
5.59
27198750
(6.53)
-10.75
0.50
67.74
74.86
PETRONET
376.80
2.54
4860000
54.88
6.89
0.66
85.92
81.07
RELIANCE
1024.15
(4.11)
21105000
44.72
8.47
0.50
87.38
84.41
For Private Circulation Only
SEBI Registration No: INB 010996539
7
Derivatives Rollover Report
Average
Price
OI
Rollover
Change
Change
Rollover
(3month)
Scrip
Price
(%)
OI Futures
(%)
COC (%)
PCR-OI
(%)
(%)
PHARMACEUTICAL
AJANTPHARM
1720.25
(2.76)
662000
79.70
9.06
0.38
87.06
83.59
APOLLOHOSP
1226.05
5.20
669600
21.83
4.33
1.30
84.89
79.97
AUROPHARMA
709.20
9.11
9233000
(14.88)
6.33
0.66
87.03
83.91
BIOCON
1030.05
9.11
2989200
15.51
9.17
0.54
88.08
85.19
CADILAHC
359.20
2.15
2940800
(6.80)
6.16
2.75
85.25
86.52
CIPLA
585.20
3.47
5678000
(2.17)
-0.97
0.42
84.80
84.14
DIVISLAB
677.95
(14.47)
6937800
128.97
8.69
0.73
87.60
84.15
DRREDDY
3008.70
(2.26)
1578400
1.44
5.21
1.01
70.75
79.10
GLENMARK
879.45
(1.34)
2507400
11.83
7.56
1.11
90.36
87.40
GRANULES
116.20
7.59
9320000
7.87
9.27
0.14
90.71
90.94
LUPIN
1525.50
3.72
4452400
(1.00)
5.18
0.74
70.42
81.09
STAR
1139.50
7.39
1828000
27.30
3.60
0.33
85.74
88.47
SUNPHARMA
639.60
3.56
27988800
(10.30)
7.42
1.06
80.51
86.14
TORNTPHARM
1306.70
1.25
200800
6.81
5.37
6.00
78.19
73.13
WOCKPHARMA
665.45
2.06
3137400
9.74
7.52
1.12
87.11
86.96
POWER
ADANIPOWER
35.65
17.85
125640000
30.77
10.68
0.32
93.05
90.19
CESC
739.95
15.61
3664100
102.86
5.47
0.31
89.04
80.67
JSWENERGY
60.70
1.08
39464000
18.78
8.35
0.88
89.56
89.54
NHPC
28.15
7.03
31401000
5.82
9.01
0.28
71.13
71.38
NTPC
171.60
5.44
17256000
24.97
1.84
0.30
71.64
75.57
POWERGRID
203.45
12.75
11348000
(31.59)
2.17
0.45
74.42
72.01
PTC
84.55
14.88
15176000
10.55
8.24
0.55
84.91
85.28
RPOWER
44.30
9.11
51408000
1.52
8.58
0.38
91.99
89.88
TATAPOWER
80.60
7.18
23571000
9.44
7.86
0.41
85.84
82.26
TORNTPOWER
196.35
10.22
3219000
31.98
10.01
0.30
91.47
87.92
REAL ESTATE
DLF
137.85
25.95
28030000
(16.01)
4.12
0.66
73.76
78.88
HDIL
63.70
13.65
27720000
20.56
8.95
0.36
85.70
83.40
IBREALEST
82.15
16.77
35430000
24.23
10.82
1.26
89.38
84.43
NCC
82.05
1.93
25088000
78.38
10.05
0.38
83.83
85.45
TELECOM
BHARTIARTL
307.95
1.65
34204000
42.83
-13.74
1.22
63.90
77.08
IDEA
74.50
4.49
108906000
48.91
-27.27
0.43
78.56
83.27
INFRATEL
353.60
3.02
5675200
0.08
6.62
0.75
82.47
78.62
RCOM
31.05
(7.73)
102444000
9.53
8.16
0.92
86.78
87.67
TATACOMM
718.80
16.04
5024600
4.57
9.17
0.30
89.08
88.83
For Private Circulation Only
SEBI Registration No: INB 010996539
8
Derivatives Rollover Report
TEXTILES
ARVIND
374.95
11.83
6000000
14.16
7.94
0.60
80.86
80.96
CENTURYTEX
845.70
5.51
7456900
7.89
8.62
0.66
91.03
91.56
ICIL
181.10
10.36
3342500
(1.85)
9.81
0.27
90.09
85.79
PAGEIND
14415.25
6.88
30200
(9.72)
-4.16
0.00
73.04
73.48
SRF
1718.95
12.24
421000
2.31
6.81
0.86
74.71
75.88
Research Team Tel: 022 - 39357800
DISCLAIMER
Angel Broking Private Limited (hereinafter referred to as “Angel”) is a registered Member of National Stock Exchange of India Limited, Bombay Stock
Exchange Limited and MCX Stock Exchange Limited. It is also registered as a Depository Participant with CDSL and Portfolio Manager with SEBI. It
also has registration with AMFI as a Mutual Fund Distributor. Angel Broking Private Limited is a registered entity with SEBI for Research Analyst in
terms of SEBI (Research Analyst) Regulations, 2014 vide registration number INH000000164. Angel or its associates has not been debarred/
suspended by SEBI or any other regulatory authority for accessing /dealing in securities Market. Angel or its associates including its relatives/analyst
do not hold any financial interest/beneficial ownership of more than 1% in the company covered by Analyst. Angel or its associates/analyst has not
received any compensation / managed or co-managed public offering of securities of the company covered by Analyst during the past twelve
months. Angel/analyst has not served as an officer, director or employee of company covered by Analyst and has not been engaged in market
making activity of the company covered by Analyst.
This document is solely for the personal information of the recipient, and must not be singularly used as the basis of any investment decision.
Nothing in this document should be construed as investment or financial advice. Each recipient of this document should make such investigations as
they deem necessary to arrive at an independent evaluation of an investment in the securities of the companies referred to in this document
(including the merits and risks involved), and should consult their own advisors to determine the merits and risks of such an investment.
Reports based on technical and derivative analysis center on studying charts of a stock's price movement, outstanding positions and trading volume,
as opposed to focusing on a company's fundamentals and, as such, may not match with a report on a company's fundamentals.
The information in this document has been printed on the basis of publicly available information, internal data and other reliable sources believed to
be true, but we do not represent that it is accurate or complete and it should not be relied on as such, as this document is for general guidance only.
Angel Broking Pvt. Limited or any of its affiliates/ group companies shall not be in any way responsible for any loss or damage that may arise to any
person from any inadvertent error in the information contained in this report. Angel Broking Pvt. Limited has not independently verified all the
information contained within this document. Accordingly, we cannot testify, nor make any representation or warranty, express or implied, to the
accuracy, contents or data contained within this document. While Angel Broking Pvt. Limited endeavors to update on a reasonable basis the
information discussed in this material, there may be regulatory, compliance, or other reasons that prevent us from doing so.
This document is being supplied to you solely for your information, and its contents, information or data may not be reproduced, redistributed or
passed on, directly or indirectly.
Neither Angel Broking Pvt. Limited, nor its directors, employees or affiliates shall be liable for any loss or damage that may arise from or in
connection with the use of this information.
Note: Please refer to the important ‘Stock Holding Disclosure' report on the Angel website (Research Section). Also, please refer to the latest update
on respective stocks for the disclosure status in respect of those stocks. Angel Broking Pvt. Limited and its affiliates may have investment positions in
the stocks recommended in this report.
Derivative Research Team
For Private Circulation Only
SEBI Registration No: INB 010996539
9


