Derivatives
Rollover Report
February 27, 2017
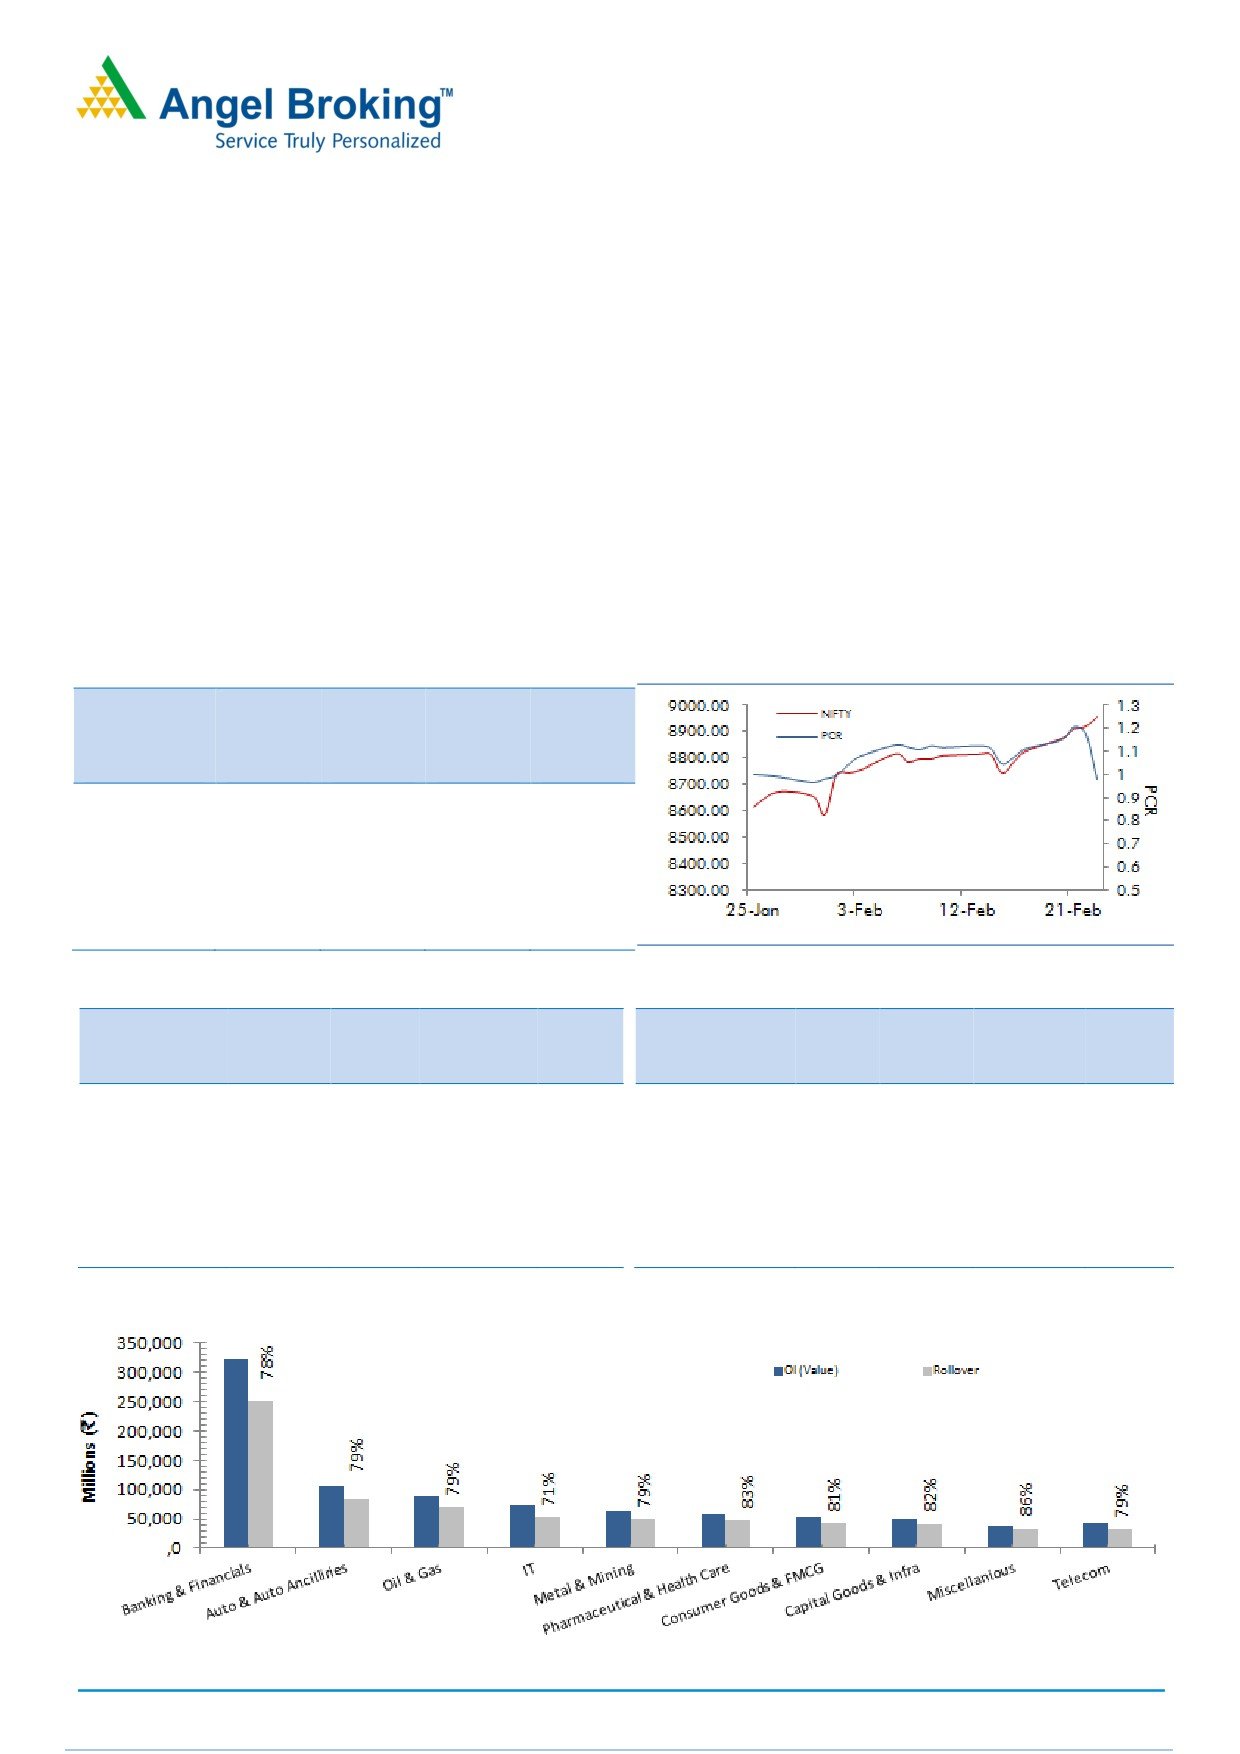
Generally, we see average rollovers ahead of any major; but, despite the ‘Union Budget’ were lined up, the February series
began with healthy data points. Nifty rallied nearly 4% series on series with good amount of long build-up. FIIs continued
their buying streak in Index Futures in February series as well. In last three months, their long positions in index futures have
increased by three times. While, shorts added in index futures during the last week are now out of the system and as a result
long short ratio has again soared to 83%. On options front, 9000-9200 call strikes and 8800-8500 put strikes are attracting
trader’s attention. Now, rollover in Nifty (73.30%), in terms of percentage is in line with averages; however, it’s on higher
side in terms of open interest. At current juncture, looking at the above data, we believe that there is further upside potential
in Nifty. Thus, traders are suggested to hold on to their longs until we see any signs of reversal on data front.
The BankNifty out-performed the benchmark index last series as it gained by around 7% M-o-M. Rollover data is hinting that
majority of the longs formed have been rolled too. Private sector financials stocks like BHARATFIN (88.09%), DHFL (91.33%),
IBULHSGFIN (76.24%) and L&TFH (74.41%) were the major gainers in the space; but, the overall OI activity in these
counters were not so encouraging. However, considering the open interest data and rollovers figures, we believe that PSU
banks will now have some catch up rally and hence, may lead the ongoing momentum in banking space.
Indices Change
NIFTY & PCR Graph
Price
Change
3 month
INDEX
Price
(%)
Rollover
avg.
NIFTY
8956.15
3.96
73.30
71.97
BANKNIFTY
20878.85
7.02
59.98
62.94
NIFTYIT
10723.00
5.29
86.53
84.68
NIFTYMID50
3701.15
2.18
-
-
NIFTYINFRA
2732.10
0.68
-
-
Monthly Gainers
Monthly Losers
Price
Ol
Price
Ol
Change Open
Change
Change Open
Change
Scrip
Price
(%)
Interest
(%)
Scrip
Price
(%)
Interest
(%)
IDEA
119.50
60.40
71155000
(34.66)
TATAMTRDVR
282.50
(17.79)
18597600
19.59
JUSTDIAL
520.05
44.00
2628000
(14.29)
TATAMOTORS
463.90
(15.66)
35520000
32.29
JINDALSTEL
117.20
41.20
37044000
(24.68)
INFRATEL
299.40
(15.33)
7667200
35.10
JPASSOCIAT
14.90
37.33
149804000
23.28
ICIL
160.85
(11.18)
3983000
19.16
SUNTV
709.10
31.50
7226000
(21.63)
IDFC
53.25
(10.73)
80084400
31.29
Note: Stocks which have more than 1000 contract in Futures OI.
Note: Stocks which have more than 1000 contract in Futures OI.
SEBI Registration No: INB 010996539
1
Derivatives Rollover Report
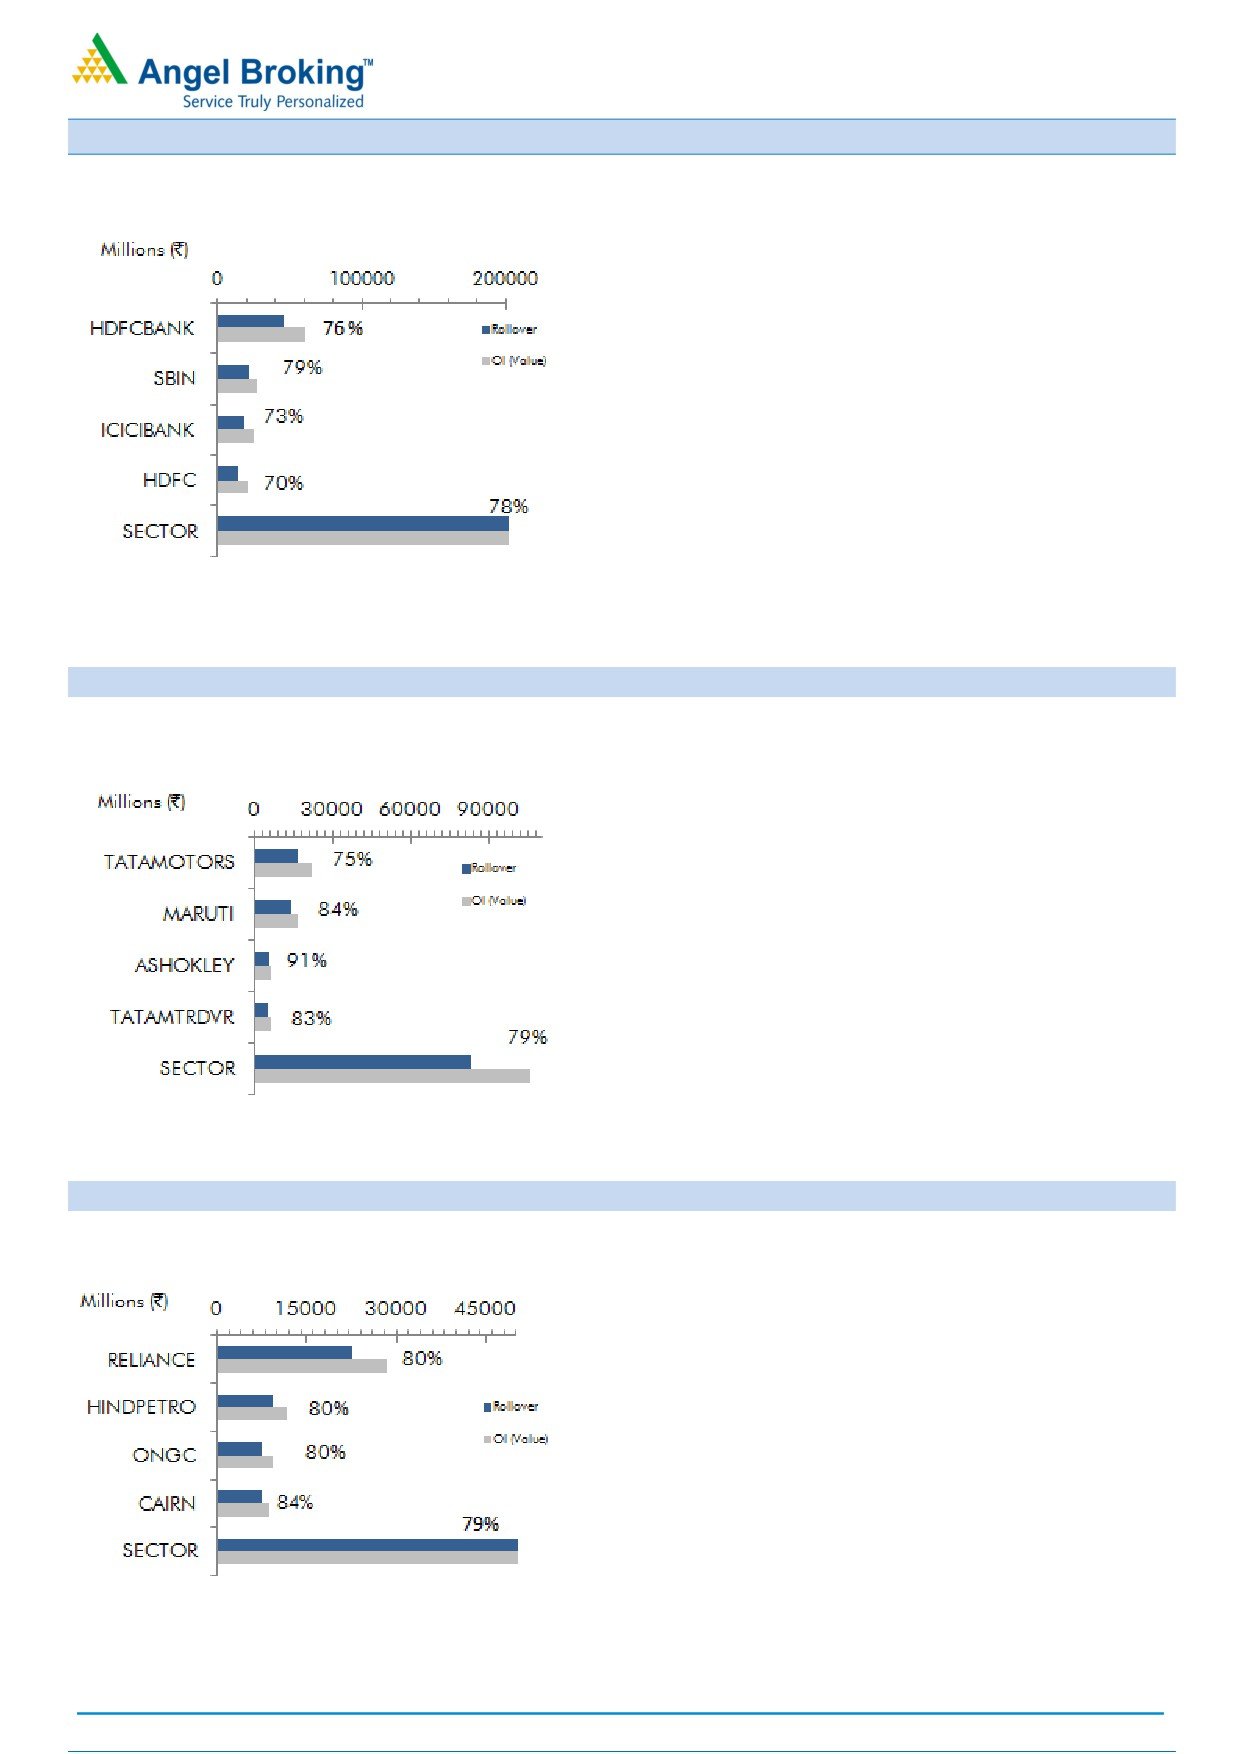
Banking and Financials
We witnessed mixed activity in PNB
(84.73%),
wherein, majority of the positions formed were on
long side. Rollover data suggests major portion of
these longs are still in system. Thus, any dip near
`136 - `138 shall be a buying opportunity.
KTKBANK (91.51%) has highest rollover in this space.
Last week, we saw significant long addition in this
counter. Rollover percentage hints these positions
have been rolled too. We expect continuation of
ongoing move, which may bring it near to
`135 - `137 levels.
IDBI (84.13%) is hardly up 2% series on series;
however, we saw good amount of open interest
addition and most of them are long positions, which
are still intact. We believe,
`84 - `85 levels is an
immediate resistance for the counter, once these
levels get breached one can expect `90 - `92 levels.
Thus, this is a buy on dip counter for us; one can
maintain a stop loss around `78 - `79 levels.
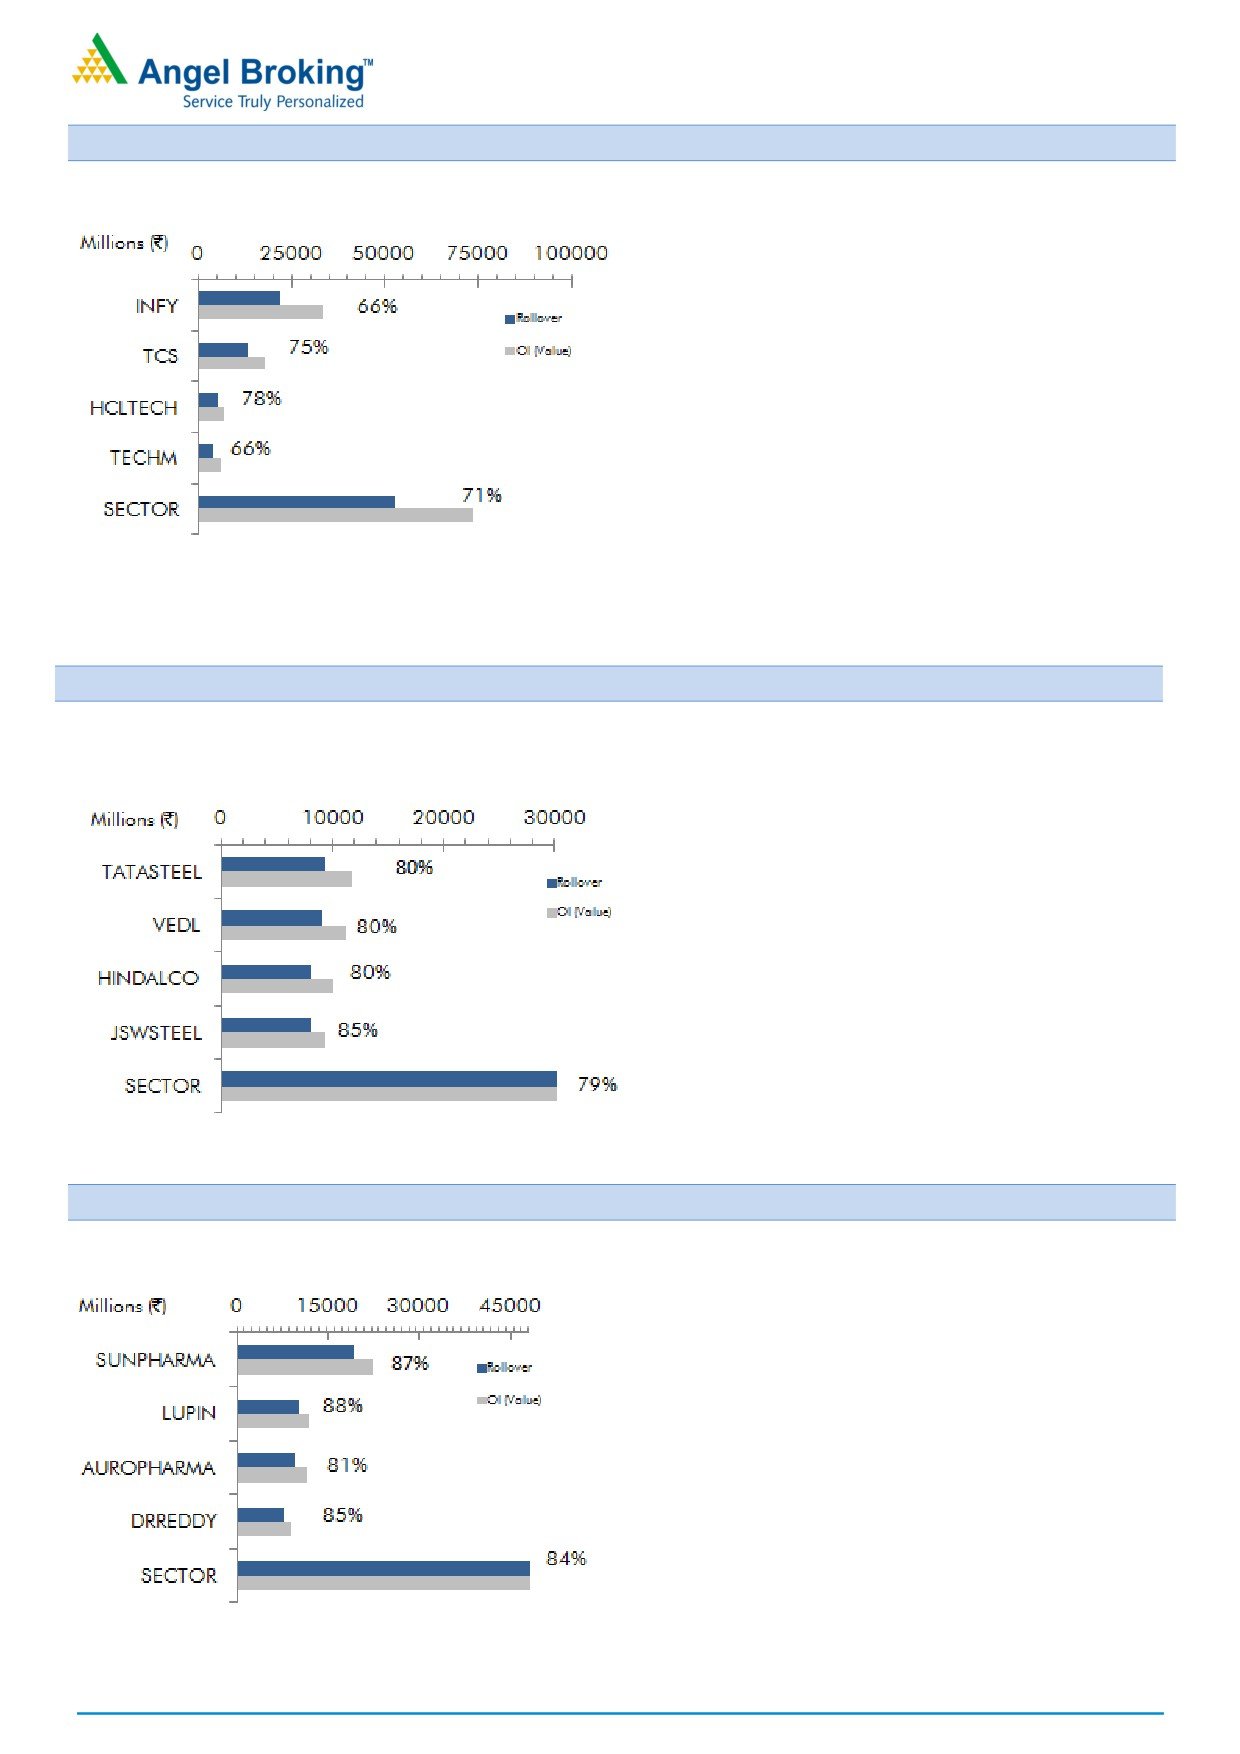
Auto & Auto Ancillaries
TATAMOTORS (74.98%) underperformed this space
as it plunged more than 15% series on series. Huge
amount of short positions formed are still intact. Thus,
traders are suggested to avoid forming fresh longs
and the traders who are stuck with their longs should
look to exit around `475 - `480 levels.
BHARATFORG (78.58%) is the top gainer in this
space. Surprisingly, this rally wasn’t supported by any
relevant long formation. Thus, traders are suggested
to stay light unless we see any meaningful
development.
Stocks that showed high rollovers in this sector are
MRF
(93.19%),
EXIDEIND
(92.51%),
ASHOKLEY (91.16%), CASTROLIND (89.49%) and
APOLLOTYRES (88.81%).
Oil & Gas
Last series, we suggested buying RELIANCE (79.90%)
for the targets of `1080 - `1082 levels. This counter
surpassed these levels and has also given a break-out
after 8 years. We believe, this counter may continue
it’s up move in near term. Thus, trades are suggested
to remain with trend and avoid forming any shorts.
ONGC (79.98%) underperformed its peer group. We
are witnessing more than 40% rise in open interest; in
which, majority of the positions formed are on short
side. This counter has an immediate support around
`193 - `195 levels. One can expect some short
covering bounce in near term, trade accordingly.
GAIL (72.15%) has lowest rollover in this space.
However, if open interest is taken into consideration,
rollovers are on the higher side. We believe, good
amount of longs were formed as it rallied from `460
to `524 levels and these positions are still intact. Thus,
this counter may continue its momentum in near term.
For Private Circulation Only
SEBI Registration No: INB 010996539
2
Derivatives Rollover Report
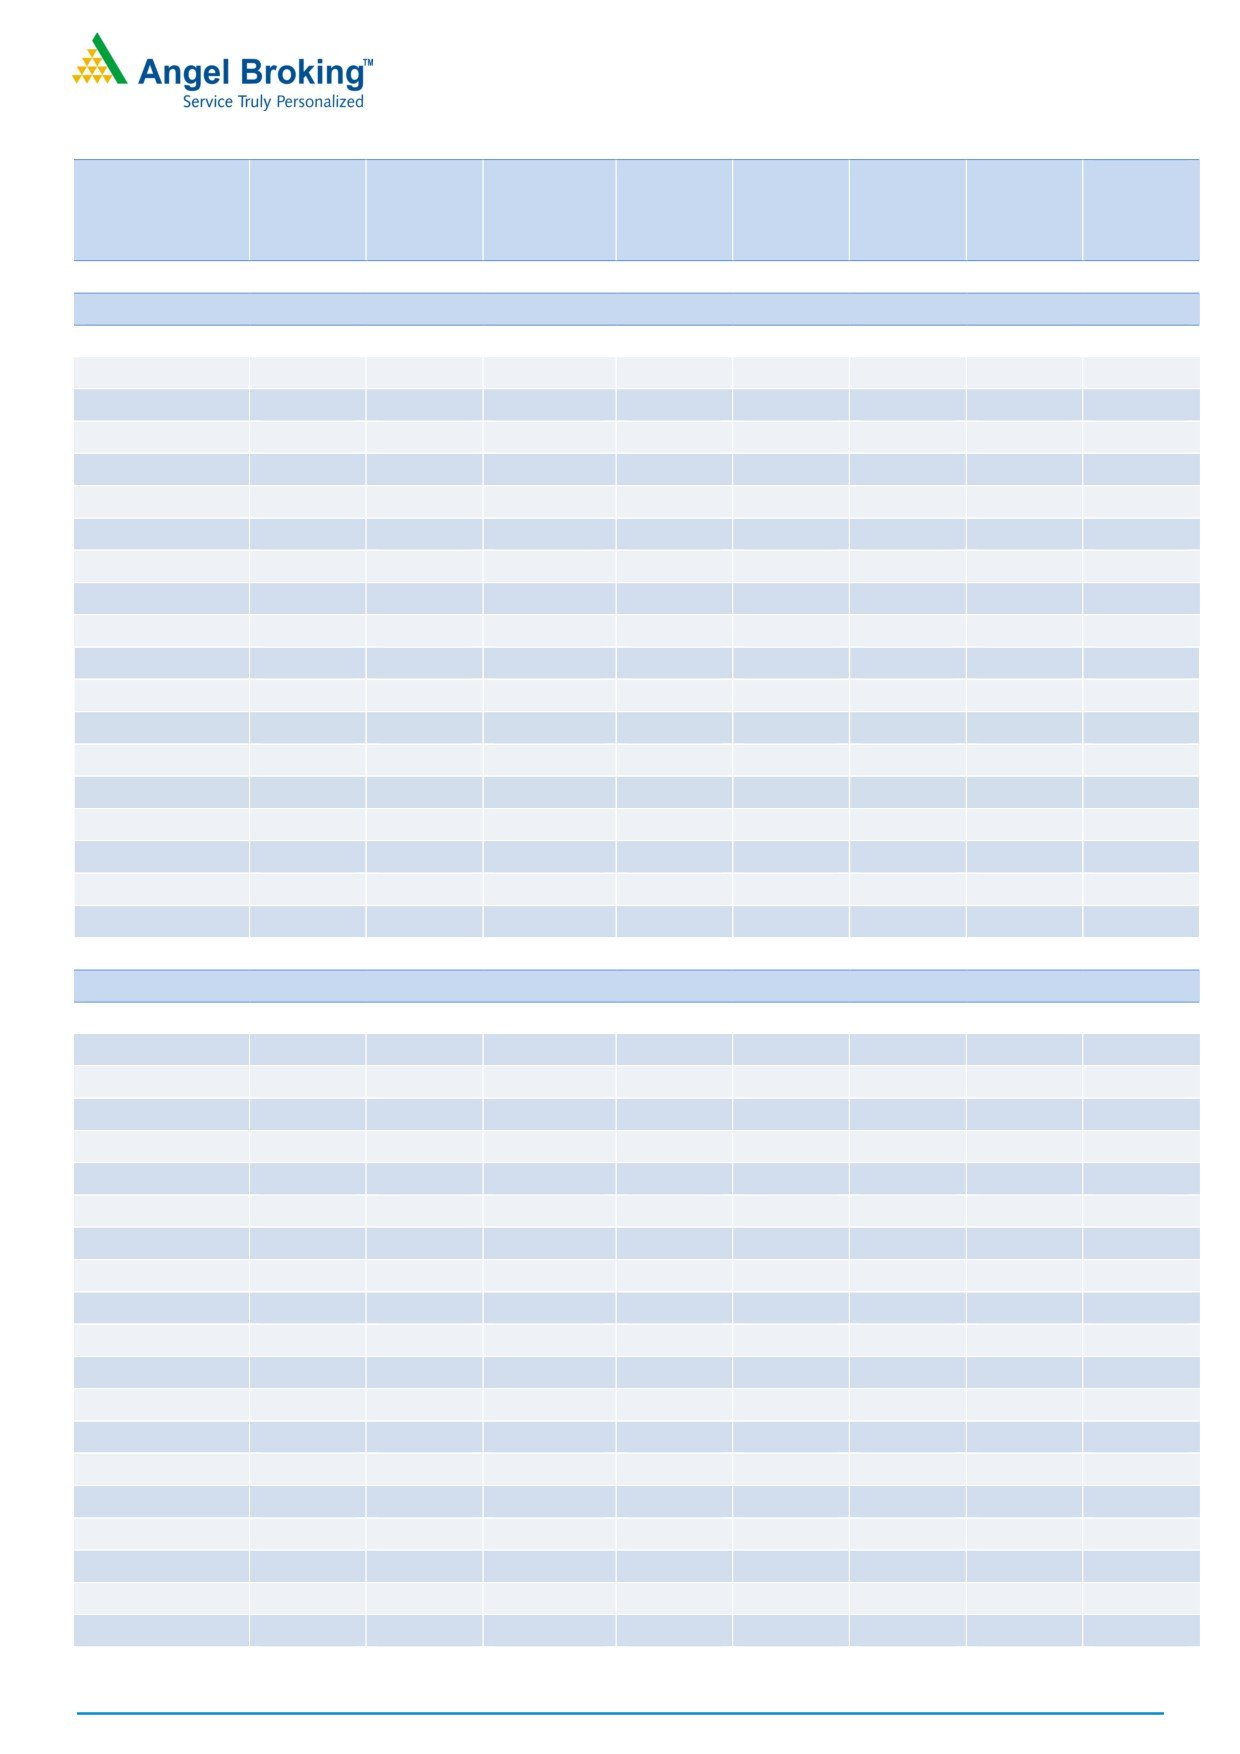
IT
Rollover in INFY (65.69%) is below its average in
percentage terms; while it’s on higher side in terms of
OI. The stock has added 26% OI in last series,
wherein, most of the positions are on long side. The
ongoing up move in the counter may continue
towards `1050 - `1055 levels.
TCS (74.89%) gained by around 5% in last series with
rise in open interest. On first look, it seems long
build-up; but, considering daily data, its mixed
positions. Rollovers are in line with its average. Stock
has good support at `2400 - `2420 zone and traders
are advised to trade this stock with positive bias.
WIPRO (80.78%) added decent amount of short
positions in beginning of Feb series. However, we
also witnessed long formation in last few trading
sessions. Both long and shorts are still intact in the
system. Since, the stock moves above its strong
resistance of `480 - `485 zone, we may see a rally
towards `515 - `520 in upcoming sessions.
Metal & Mining
TATASTEEL (80.01%) had seen positive momentum in
last series with formation of long positions. But, these
positions didn’t get rolled to march series. The stock
has a resistance at `495 and a sustainable move
above the same may pull the stock to `540 levels.
JSWSTEEL (85.35%) has seen some correction in last
series; but, we didn’t witness any meaningful activity
on open interest front. Rollovers are marginally below
its quarterly average. Stock has support at `174 and
resistance at `200 levels. Stock is expected to trade
within that range in upcoming sessions.
JINDALSTEL
(84.15%) was the biggest gainer in
‘metal & mining’ space in February series. The stock
remained in ‘Ban’ period for most of the session.
However, we witnessed long build-up on couple of
sessions. Stock has managed to sustain above its
resistance of `92 & `97 levels; and thus, any decline
would be a buying opportunity in the counter.
Pharmaceutical
AUROPHARMA (81.42%) added huge amount of
fresh positions in last series. Most of the positions are
on short side and are still intact in the system. The
stock is expected to trade within a range of
`635 - `715 in coming weeks. Traders can take
positions accordingly.
DRREDDY (84.53%) has seen highest OI build-up in
this space in last series. And these are short positions,
which got rolled too. The stock may correct upto its
next support zone of `2820 - `2800 in upcoming
weeks.
GRANULES (83.85%) rallied in last series with huge
open interest addition, indicating long build-up in the
stock. The stock manages to sustain above its
resistance of
`122
-
`125 zone and may rally
towards `139 - `142 levels.
For Private Circulation Only
SEBI Registration No: INB 010996539
3
Derivatives Rollover Report
Average
Price
OI
Rollover
Change
Change
Rollover
(3month)
Scrip
Price
(%)
OI Futures
(%)
COC (%)
PCR-OI
(%)
(%)
AUTO & AUTO ANCILLARIES
AMARAJABAT
850.80
(4.53)
1461600
148.32
6.29
1.10
82.33
77.85
APOLLOTYRE
185.55
(1.36)
15714000
54.97
6.22
0.44
88.81
87.68
ASHOKLEY
91.15
4.71
60816000
(2.46)
6.91
0.36
91.16
90.49
BAJAJ-AUTO
2814.90
(1.26)
1202000
(10.81)
0.30
0.93
70.36
78.53
BHARATFORG
1076.85
12.82
2905200
(27.64)
5.21
0.47
78.58
83.74
BOSCHLTD
22109.40
(3.68)
75000
2.53
5.62
0.00
80.19
80.67
CASTROLIND
418.05
3.97
8762600
(9.11)
2.38
0.57
89.49
91.91
CEATLTD
1166.30
(2.25)
1681400
2.47
8.75
0.58
74.81
78.45
EICHERMOT
24939.30
7.88
144550
(29.12)
2.58
0.39
65.36
77.54
EXIDEIND
213.90
8.74
16048000
58.70
6.62
0.17
92.51
90.31
HEROMOTOCO
3187.20
(1.93)
1395200
(21.70)
3.43
0.35
68.81
77.43
M&M
1308.05
4.75
3124500
(42.15)
2.56
0.58
61.11
77.86
MARUTI
6064.55
4.06
2263650
15.35
5.80
1.01
84.27
80.09
MOTHERSUMI
350.95
5.28
9235000
(13.08)
4.93
0.56
77.49
84.58
MRF
51770.30
(3.03)
46365
55.95
5.49
0.00
93.19
88.03
TATAMOTORS
463.90
(15.66)
35520000
32.29
3.50
0.53
74.98
72.68
TATAMTRDVR
282.50
(17.79)
18597600
19.59
5.75
0.47
83.37
87.52
TVSMOTOR
427.70
9.16
6112000
(26.31)
-12.76
0.37
80.19
82.34
BANKING & FINANCIALS
ALBK
73.55
10.60
13480000
12.80
-4.24
0.52
58.66
74.43
ANDHRABANK
55.70
11.07
17760000
(6.67)
-12.94
0.72
57.44
70.82
AXISBANK
529.25
13.87
26302800
7.05
2.17
0.73
75.40
78.48
BAJFINANCE
1074.95
7.06
4182000
(30.01)
6.59
0.61
81.05
80.24
BANKBARODA
168.90
4.19
40533500
20.69
4.65
0.78
74.98
71.57
BANKINDIA
127.70
10.56
21828000
2.25
1.64
0.48
83.88
83.72
BHARATFIN
875.50
16.33
9940000
(1.05)
6.11
0.60
88.09
86.18
CANBK
287.85
4.05
13563432
(3.31)
-13.06
0.52
86.97
85.65
DCBBANK
154.40
29.64
3870000
6.44
7.48
0.29
80.37
81.76
DHFL
333.00
16.13
17469000
(2.89)
5.98
0.64
91.33
90.56
FEDERALBNK
84.60
6.82
60918000
20.29
6.20
0.39
86.99
83.07
HDFC
1391.35
3.74
10686500
0.02
4.25
0.54
70.45
75.83
HDFCBANK
1388.80
7.36
33302000
3.92
-4.11
0.61
75.54
78.95
IBULHSGFIN
865.20
15.05
14396000
(0.70)
0.84
0.22
76.24
81.92
ICICIBANK
285.15
9.34
64450000
22.67
2.38
0.47
72.55
74.06
IDBI
82.15
2.24
24264000
19.50
6.39
0.50
84.13
86.32
IDFCBANK
63.10
(4.18)
55648000
14.48
5.82
0.55
91.48
88.45
IDFC
53.25
(10.73)
80084400
31.29
7.89
0.81
90.76
86.15
IFCI
29.85
6.23
57288000
(1.92)
7.03
0.39
85.94
81.39
For Private Circulation Only
SEBI Registration No: INB 010996539
4
Derivatives Rollover Report
Average
Price
OI
Rollover
Change
Change
Rollover
(3month)
Scrip
Price
(%)
OI Futures
(%)
COC (%)
PCR-OI
(%)
(%)
INDUSINDBK
1346.60
5.93
5858400
30.43
4.55
0.39
71.97
71.93
KOTAKBANK
810.60
1.81
9871200
17.07
-0.45
0.41
69.66
74.28
KTKBANK
130.75
13.79
28607625
64.78
6.82
0.53
91.51
86.35
L&TFH
116.85
14.90
16803000
(27.33)
4.48
0.41
74.41
82.32
LICHSGFIN
568.90
3.79
8666900
(5.10)
5.90
0.29
79.15
81.67
M&MFIN
292.90
2.04
12667500
15.37
6.09
0.51
80.93
73.90
ORIENTBANK
125.40
7.32
13326000
(6.29)
6.70
0.35
85.65
85.53
PFC
134.25
(1.36)
27198000
107.18
-4.64
0.47
84.29
74.85
PNB
140.50
6.72
46543000
19.14
2.60
0.63
84.73
80.64
RECLTD
151.45
7.03
30612000
24.83
-45.44
0.56
78.64
74.71
RELCAPITAL
522.30
13.00
10390500
(10.86)
5.72
0.50
89.80
89.24
SBIN
271.75
4.66
80202000
19.65
5.01
0.50
79.38
78.41
SOUTHBANK
20.80
(3.03)
58560147
46.66
10.12
0.40
87.91
88.41
SRTRANSFIN
938.45
(1.94)
3592200
3.78
5.42
0.31
83.03
85.60
SYNDIBANK
70.15
2.78
14103000
(10.92)
8.24
0.31
81.49
79.52
UNIONBANK
142.95
4.30
22092000
28.00
-9.40
0.35
82.78
84.79
YESBANK
1451.90
3.00
7574000
(6.61)
3.71
0.67
75.11
78.22
CAPITAL GOODS & INFRASTRUCTURE
ADANIPORTS
298.70
(2.13)
12877500
(15.40)
5.09
0.50
68.16
80.94
BEML
1331.05
6.75
2025600
30.35
7.02
0.68
90.92
86.99
BHEL
154.20
16.38
22900000
(29.84)
5.10
0.71
71.05
78.18
CROMPGREAV
68.10
4.61
19176000
13.41
7.71
0.37
84.64
82.68
ENGINERSIN
148.15
(2.88)
22120000
54.00
4.24
0.72
86.50
75.27
GMRINFRA
15.05
17.12
176985000
13.31
10.50
0.54
95.35
86.97
HAVELLS
411.60
(2.43)
4772000
1.62
6.12
0.43
77.62
81.39
IRB
232.50
1.93
9860000
7.82
6.54
0.39
88.47
87.39
JPASSOCIAT
14.90
37.33
149804000
23.28
10.61
0.11
87.84
87.48
LT
1493.65
2.76
7662500
(6.02)
4.95
0.41
84.87
80.88
RELINFRA
559.80
6.79
6370000
12.72
6.28
0.47
89.79
90.00
SIEMENS
1209.15
2.45
891000
13.79
6.77
1.03
78.06
78.28
VOLTAS
355.85
8.84
4490000
2.65
-2.78
0.50
70.82
74.86
CEMENT
ACC
1439.15
2.85
1080400
(16.79)
0.76
2.13
76.49
81.79
AMBUJACEM
231.45
1.40
9852500
(26.31)
-2.47
0.28
76.21
76.74
GRASIM
1026.90
10.40
5013750
(34.68)
2.04
2.02
66.01
75.65
INDIACEM
167.50
16.44
18196500
(19.22)
6.26
0.84
86.95
88.31
ULTRACEMCO
3796.30
3.05
2042600
(18.47)
2.81
1.33
81.44
79.52
For Private Circulation Only
SEBI Registration No: INB 010996539
5
Derivatives Rollover Report
Average
Price
OI
Rollover
Change
Change
Rollover
(3month)
Scrip
Price
(%)
OI Futures
(%)
COC (%)
PCR-OI
(%)
(%)
CHEMICAL & FERTILIZERS
PIDILITIND
692.30
1.76
1459000
26.98
6.29
0.30
84.43
83.05
TATACHEM
579.60
7.42
3181500
(29.79)
6.24
0.48
77.69
83.46
UPL
721.30
(3.16)
5688000
0.74
4.65
0.59
86.21
90.04
CONSUMER GOODS & FMCG
ASIANPAINT
1013.05
3.34
4666200
(5.17)
4.19
0.46
83.61
83.19
BRITANNIA
3243.50
3.06
1185800
6.54
5.33
1.09
89.28
85.22
COLPAL
899.15
(0.44)
1383200
99.19
6.95
0.26
84.48
85.65
DABUR
270.80
(4.09)
12732500
16.97
4.84
0.57
88.76
90.13
GODREJCP
1673.95
8.38
415200
(8.87)
4.16
0.50
74.52
72.55
HINDUNILVR
862.85
(0.98)
6802200
27.84
5.59
0.48
81.04
81.98
ITC
267.10
0.30
46192800
18.80
5.69
0.35
75.30
78.04
JUBLFOOD
1006.20
17.28
2109500
7.96
0.21
0.12
74.23
77.15
MARICO
269.95
5.31
4651400
(12.13)
4.07
0.39
76.03
81.47
TATAGLOBAL
140.15
8.43
29016000
8.01
6.74
0.40
93.13
94.59
TITAN
435.10
16.65
6525000
(2.75)
5.18
0.21
75.09
78.72
UBL
789.85
(4.47)
1118600
12.54
5.04
1.11
75.95
78.84
INFORMATION TECHNOLOGY
HCLTECH
845.75
0.81
6451900
1.67
3.59
0.30
78.09
79.17
HEXAWARE
220.90
11.99
4302000
(7.96)
-0.71
0.56
84.35
81.39
INFY
1012.50
7.68
21585000
26.46
3.77
0.94
65.69
75.27
KPIT
139.35
3.11
3784000
16.93
9.06
0.44
86.63
82.35
MINDTREE
472.85
1.90
3003600
16.58
6.55
0.84
90.82
85.13
NIITTECH
424.30
(3.18)
726000
40.70
3.45
0.77
79.87
78.56
OFSS
3716.60
10.40
250200
34.41
4.00
0.00
75.48
82.43
TATAELXSI
1480.70
0.63
1020400
(18.13)
6.34
0.93
87.69
82.90
TCS
2486.90
5.45
5314500
14.54
2.14
0.68
74.89
74.93
TECHM
504.90
7.77
7975000
(7.98)
2.59
0.78
65.66
77.66
WIPRO
487.50
3.28
5049600
22.01
3.00
0.48
80.78
75.13
MEDIA
DISHTV
93.85
7.32
27685000
(22.63)
5.59
0.47
80.06
87.94
SUNTV
709.10
31.50
7226000
(21.63)
5.99
0.32
83.93
84.20
TV18BRDCST
40.20
8.94
86921000
1.25
9.16
3.16
89.91
92.47
ZEEL
521.20
4.21
7133100
(16.94)
5.33
0.67
84.20
81.62
For Private Circulation Only
SEBI Registration No: INB 010996539
6
Derivatives Rollover Report
Average
Price
OI
Rollover
Change
Change
Rollover
(3month)
Scrip
Price
(%)
OI Futures
(%)
COC (%)
PCR-OI
(%)
(%)
METALS & MINING
COALINDIA
311.40
0.37
10176200
(24.86)
-51.87
0.45
59.95
68.53
HINDALCO
182.90
(4.34)
44107000
5.75
4.58
0.55
79.62
86.40
HINDZINC
302.85
0.45
7910400
8.04
2.94
0.51
73.73
81.48
JINDALSTEL
117.20
41.20
37044000
(24.68)
5.37
0.27
84.15
90.45
JSWSTEEL
187.35
(4.80)
42861000
(16.23)
2.23
0.56
85.35
88.40
NMDC
142.15
(2.37)
18084000
(7.06)
1.10
0.49
76.77
79.45
SAIL
60.45
(2.50)
48504000
10.74
6.07
0.69
82.86
85.61
TATASTEEL
486.60
3.17
19264000
(5.63)
1.82
0.74
80.01
83.92
VEDL
262.90
1.74
34510000
(12.76)
0.20
0.68
80.60
81.26
MISCELLANIOUS
ABIRLANUVO
1498.65
8.98
2619600
(13.86)
1.95
0.50
90.64
92.97
ADANIENT
97.25
20.88
21160000
52.10
7.02
0.35
84.42
88.01
BATAINDIA
498.80
4.19
2623500
(7.20)
3.88
0.22
80.71
79.96
BEL
1513.70
(0.47)
3560400
73.55
5.71
0.67
90.34
86.80
CONCOR
1183.55
0.14
1279000
15.43
-2.59
0.98
80.44
81.37
CUMMINSIND
887.65
5.69
625800
25.81
6.38
1.40
72.18
83.54
GODREJIND
508.45
17.96
922500
(9.02)
7.44
1.54
74.10
76.98
JETAIRWAYS
425.15
1.43
5455000
31.07
7.04
0.30
82.23
82.11
JISLJALEQS
94.30
(0.79)
37926000
(1.22)
7.80
0.63
84.72
88.11
JUSTDIAL
520.05
44.00
2628000
(14.29)
-28.38
0.45
70.21
75.56
KSCL
458.05
(7.36)
2895000
27.39
7.91
1.14
83.05
85.30
MCDOWELL-N
2345.95
6.26
2686500
10.19
6.53
0.31
92.37
92.56
PCJEWELLER
379.00
(2.11)
907500
(5.62)
5.53
0.67
71.77
65.07
SINTEX
93.95
9.56
33679875
28.21
7.83
0.46
91.59
91.30
OIL & GAS
BPCL
699.95
0.53
10257600
(18.85)
-25.72
0.51
82.10
78.50
CAIRN
287.60
1.88
25501000
13.70
4.92
0.21
84.10
87.01
GAIL
510.25
8.30
10716000
19.52
-14.71
0.50
72.15
70.92
HINDPETRO
548.80
5.10
17033100
(20.90)
-40.55
0.56
80.20
81.14
IGL
1041.35
10.85
1543300
11.17
6.30
0.84
79.00
78.68
IOC
387.30
5.42
15018000
(5.81)
5.96
0.47
72.41
74.30
OIL
328.15
(2.23)
2340778
(1.15)
3.99
0.36
83.31
76.11
ONGC
196.40
(3.32)
38212500
40.49
2.13
0.49
80.33
75.23
PETRONET
401.40
6.53
5889000
21.17
4.44
0.25
74.84
82.00
RELIANCE
1188.70
16.07
19116500
(9.42)
5.25
0.79
79.90
84.18
For Private Circulation Only
SEBI Registration No: INB 010996539
7
Derivatives Rollover Report
Average
Price
OI
Rollover
Change
Change
Rollover
(3month)
Scrip
Price
(%)
OI Futures
(%)
COC (%)
PCR-OI
(%)
(%)
PHARMACEUTICAL
AJANTPHARM
1716.30
(0.23)
488800
(26.16)
6.08
1.55
82.85
84.98
APOLLOHOSP
1327.75
8.29
635200
(5.14)
3.27
0.18
82.19
84.05
AUROPHARMA
670.45
(5.46)
14002100
51.65
6.57
0.46
81.42
85.82
BIOCON
1116.05
8.35
2329800
(22.06)
4.03
0.69
90.92
88.58
CADILAHC
431.55
20.14
3043200
3.48
2.06
0.62
77.57
84.32
CIPLA
594.60
1.61
6669000
17.45
3.87
0.20
80.35
83.86
DIVISLAB
752.30
10.97
5051400
(27.19)
3.83
0.30
73.01
81.70
DRREDDY
2904.95
(3.45)
2648600
67.80
6.34
0.43
84.53
80.05
GLENMARK
936.35
6.47
2270100
(9.46)
3.24
0.55
78.77
85.73
GRANULES
129.30
11.27
13680000
46.78
5.68
0.43
83.85
89.29
LUPIN
1458.70
(4.38)
7093600
59.32
6.26
1.05
88.05
81.09
STAR
1177.35
3.32
1358000
(25.71)
8.12
0.35
65.97
80.79
SUNPHARMA
677.05
5.86
28598500
2.18
3.87
0.49
86.51
85.57
TORNTPHARM
1298.20
(0.65)
294000
46.41
1.29
0.61
78.53
73.61
WOCKPHARMA
709.05
6.55
3201000
2.03
6.59
0.54
90.06
88.26
POWER
ADANIPOWER
38.45
7.85
128720000
2.45
4.08
0.47
90.81
91.59
CESC
861.15
16.38
3235100
(11.71)
6.15
0.59
86.65
84.90
JSWENERGY
63.15
4.04
41720000
5.72
7.48
0.80
91.43
90.36
NHPC
30.45
8.17
24489000
(22.01)
10.38
0.19
70.47
69.90
NTPC
166.30
(3.09)
21664000
25.54
5.04
0.46
81.90
75.63
POWERGRID
200.35
(1.52)
19236000
69.51
6.28
0.64
84.83
75.78
PTC
90.00
6.45
16664000
9.80
6.41
0.55
88.68
88.72
RPOWER
46.35
4.63
54408000
5.84
7.93
0.43
90.79
91.53
TATAPOWER
84.00
4.22
28008000
18.82
6.87
0.34
85.75
85.90
TORNTPOWER
201.95
2.85
3294000
2.33
8.33
1.78
86.59
88.37
REAL ESTATE
DLF
149.35
8.34
28975000
3.37
3.50
0.67
81.62
78.39
HDIL
68.75
7.93
26312000
(5.08)
7.64
0.35
79.01
82.11
IBREALEST
78.15
(4.87)
31810000
(10.22)
8.07
1.63
89.00
87.89
NCC
82.10
0.06
28424000
13.30
6.39
0.41
83.58
85.34
TELECOM
BHARTIARTL
367.10
19.21
39202000
14.61
2.42
0.48
88.53
78.47
IDEA
119.50
60.40
71155000
(34.66)
-0.87
0.61
62.39
75.81
INFRATEL
299.40
(15.33)
7667200
35.10
5.25
0.68
77.14
81.54
RCOM
37.25
19.97
100764000
(1.64)
9.89
0.36
88.48
87.83
TATACOMM
746.60
3.87
5633600
12.12
6.61
0.76
87.19
90.16
For Private Circulation Only
SEBI Registration No: INB 010996539
8
Derivatives Rollover Report
TEXTILES
ARVIND
373.85
(0.29)
6812000
13.53
7.16
0.63
85.38
83.09
CENTURYTEX
951.35
12.49
8028900
7.67
5.90
0.27
92.87
92.59
ICIL
160.85
(11.18)
3983000
19.16
8.50
0.88
89.05
89.32
PAGEIND
14102.05
(2.17)
32300
6.95
7.13
0
76.45
73.53
SRF
1563.35
(9.05)
731500
73.75
7.49
1.00
80.78
79.35
Research Team Tel: 022 - 39357800
DISCLAIMER
Angel Broking Private Limited (hereinafter referred to as “Angel”) is a registered Member of National Stock Exchange of India Limited, Bombay Stock
Exchange Limited and MCX Stock Exchange Limited. It is also registered as a Depository Participant with CDSL and Portfolio Manager with SEBI. It
also has registration with AMFI as a Mutual Fund Distributor. Angel Broking Private Limited is a registered entity with SEBI for Research Analyst in
terms of SEBI (Research Analyst) Regulations, 2014 vide registration number INH000000164. Angel or its associates has not been debarred/
suspended by SEBI or any other regulatory authority for accessing /dealing in securities Market. Angel or its associates including its relatives/analyst
do not hold any financial interest/beneficial ownership of more than 1% in the company covered by Analyst. Angel or its associates/analyst has not
received any compensation / managed or co-managed public offering of securities of the company covered by Analyst during the past twelve
months. Angel/analyst has not served as an officer, director or employee of company covered by Analyst and has not been engaged in market
making activity of the company covered by Analyst.
This document is solely for the personal information of the recipient, and must not be singularly used as the basis of any investment decision.
Nothing in this document should be construed as investment or financial advice. Each recipient of this document should make such investigations as
they deem necessary to arrive at an independent evaluation of an investment in the securities of the companies referred to in this document
(including the merits and risks involved), and should consult their own advisors to determine the merits and risks of such an investment.
Reports based on technical and derivative analysis center on studying charts of a stock's price movement, outstanding positions and trading volume,
as opposed to focusing on a company's fundamentals and, as such, may not match with a report on a company's fundamentals.
The information in this document has been printed on the basis of publicly available information, internal data and other reliable sources believed to
be true, but we do not represent that it is accurate or complete and it should not be relied on as such, as this document is for general guidance only.
Angel Broking Pvt. Limited or any of its affiliates/ group companies shall not be in any way responsible for any loss or damage that may arise to any
person from any inadvertent error in the information contained in this report. Angel Broking Pvt. Limited has not independently verified all the
information contained within this document. Accordingly, we cannot testify, nor make any representation or warranty, express or implied, to the
accuracy, contents or data contained within this document. While Angel Broking Pvt. Limited endeavors to update on a reasonable basis the
information discussed in this material, there may be regulatory, compliance, or other reasons that prevent us from doing so.
This document is being supplied to you solely for your information, and its contents, information or data may not be reproduced, redistributed or
passed on, directly or indirectly.
Neither Angel Broking Pvt. Limited, nor its directors, employees or affiliates shall be liable for any loss or damage that may arise from or in
connection with the use of this information.
Note: Please refer to the important ‘Stock Holding Disclosure' report on the Angel website (Research Section). Also, please refer to the latest update
on respective stocks for the disclosure status in respect of those stocks. Angel Broking Pvt. Limited and its affiliates may have investment positions in
the stocks recommended in this report.
Derivative Research Team
For Private Circulation Only
SEBI Registration No: INB 010996539
9