Derivatives Rollover Report | December 29, 2017
This calendar year has been the historical one for our market as the benchmark index rallied 28% and surpassed yet
another milestone of 10500 in the concluding series of the year. As far as intra-series activity is concerned, it has
been a roller coaster ride during the first half, mainly due to key events on the domestic as well as global front.
During the early part, the index extended its losses but emergence of smart buying in the vicinity of 10000-10050
pulled index back post the BJP’s victory in Gujarat assembly election.
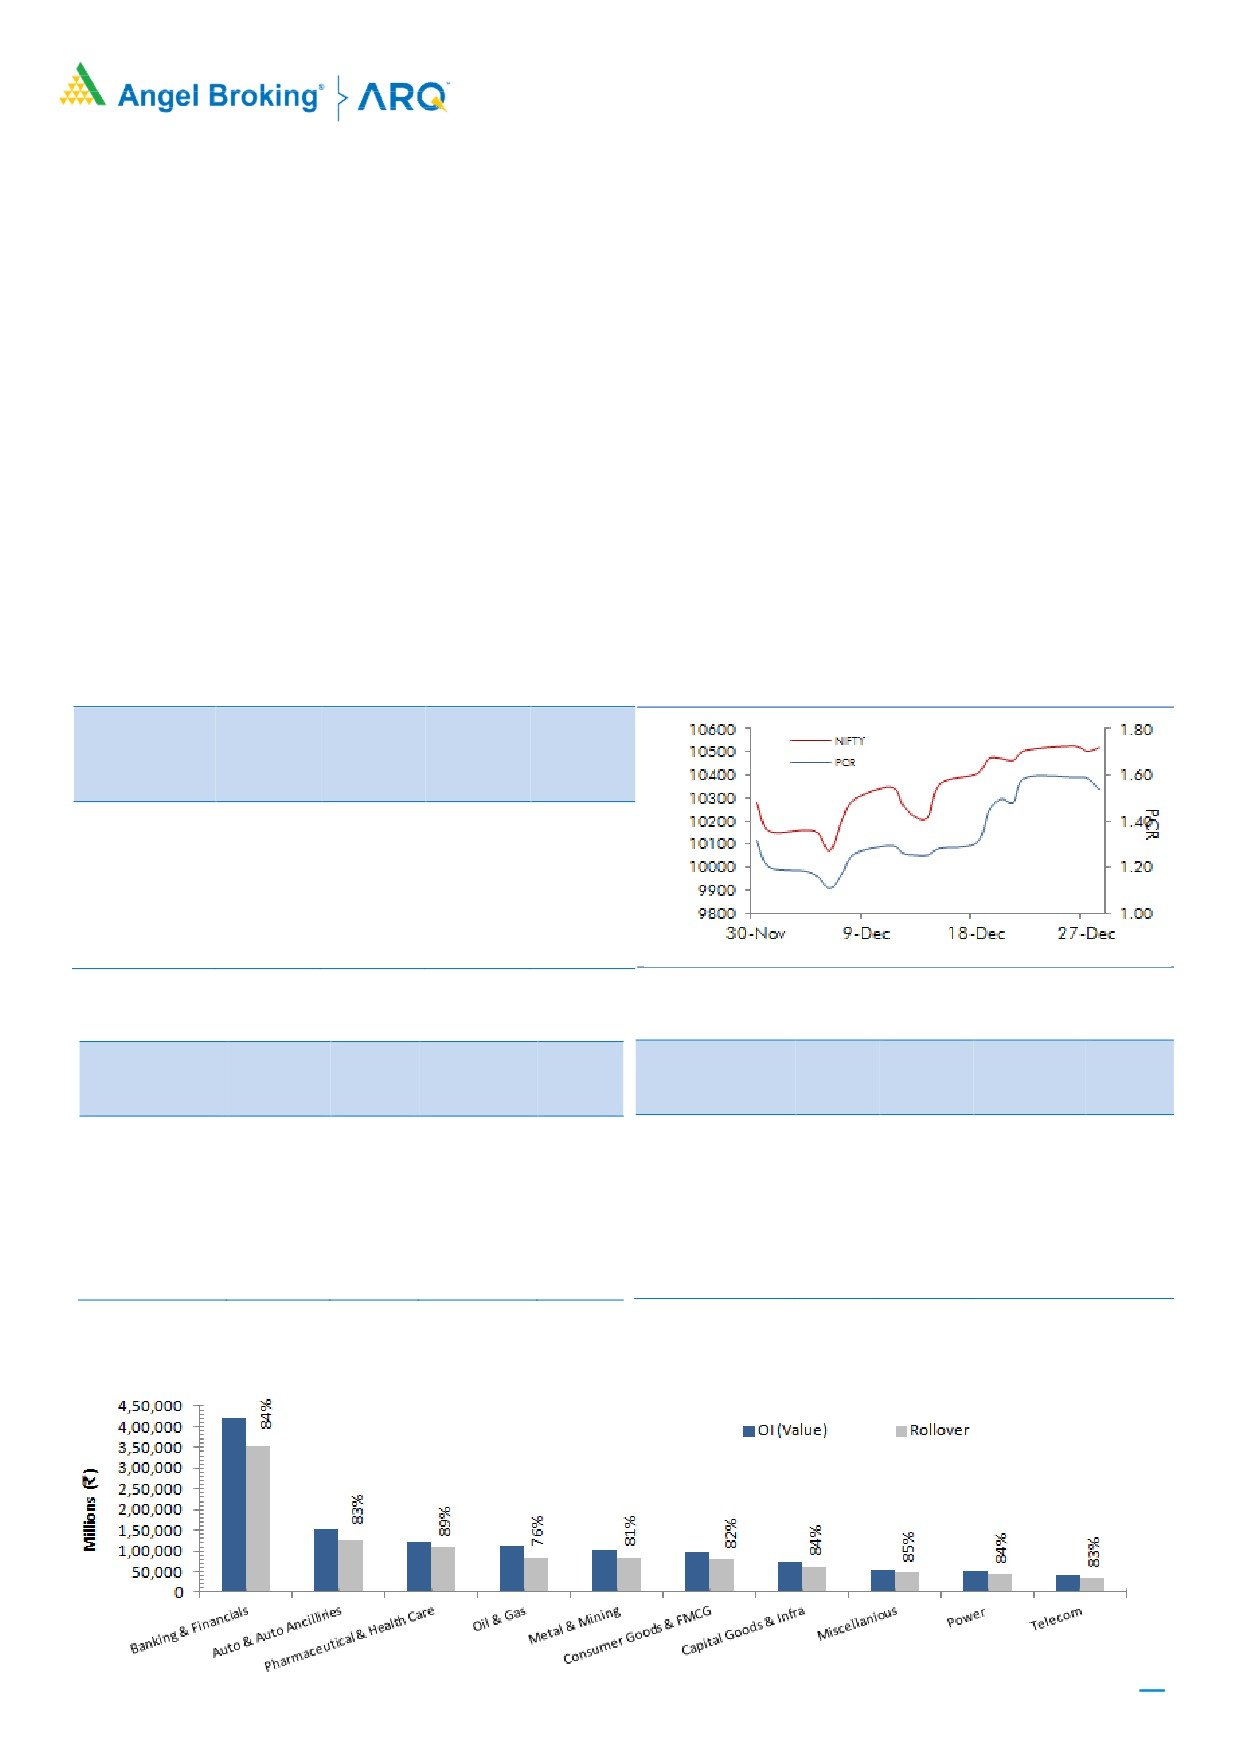
During the series, we witnessed good amount of OI addition in index futures; which was a blend of both long and
short positions. Rollover in Nifty is at 73.19% which is above its three month averages of 69.72%. In terms of open
interest as well, the rollovers are on the higher side. Once again, FIIs exited all of their short positions formed in last
series; as a result the index futures ‘Long Short Ratio’ has now surged back to 70%. As far as options activity for
January series is concerned, the build-up is quite scattered between 10500-11000 call and 10000-10500 put options,
we believe this is mainly due to upcoming union budget. The volatility index (INDIAVIX) is around 12% and considering
upcoming event, it’s expected to scale up going ahead. At this point in time, 10350-10400 seems to be a strong
support and thus, as long as index remains above these levels, traders should avoid forming any bearish bets and
focus on individual stocks to fetch higher returns.
BANKNIFTY (74.40%) rollover percentage is on the higher side, mainly due to the low base. We saw further reduction
of open interest for this rate sensitive index in December series as well; resulting into a lowest open interest in past
three years. During the series, we witnessed sheer underperformance from this space which we believe was mainly due
to decent amount of short additions in PSU banks.
Indices Change
NIFTY & PCR Graph
Price
Change
3 month
INDEX
Price
(%)
Rollover
avg.
NIFTY
10517.90
2.33
73.19
69.72
BANKNIFTY
25545.05
0.38
74.70
66.32
NIFTYIT
11509.00
3.08
73.35
74.05
NIFTYMID50
5526.40
16.78
99.96
-
NIFTYINFRA
3622.20
11.06
-
-
Monthly Gainers
Monthly Losers
Price
Ol
Price
Ol
Change Open
Change
Change Open
Change
Scrip
Price
(%)
Interest
(%)
Scrip
Price
(%)
Interest
(%)
RCOM
30.75
143.08
73780000
(19.17)
BALRAMCHIN
131.65
(17.90)
15267000
(7.64)
RELCAPITAL
571.40
31.09
12252000
0.44
SYNDIBANK
79.35
(15.00)
25884000
39.07
JPASSOCIAT
23.35
27.60
193800000
13.16
BANKINDIA
171.15
(12.83)
17058000
31.32
WOCKPHARM
920.20
26.67
2884500
(1.80)
UNIONBANK
147.00
(10.48)
20356000
49.28
RELINFRA
559.40
26.48
10801700
16.11
SOUTHBANK
31.05
(6.05)
172101213
(4.26)
Note: Stocks which have more than 1000 contract in Futures OI.
Note: Stocks which have more than 1000 contract in Futures OI.
For Private Circulation Only
1
Derivatives Rollover Report
Banking and Financials
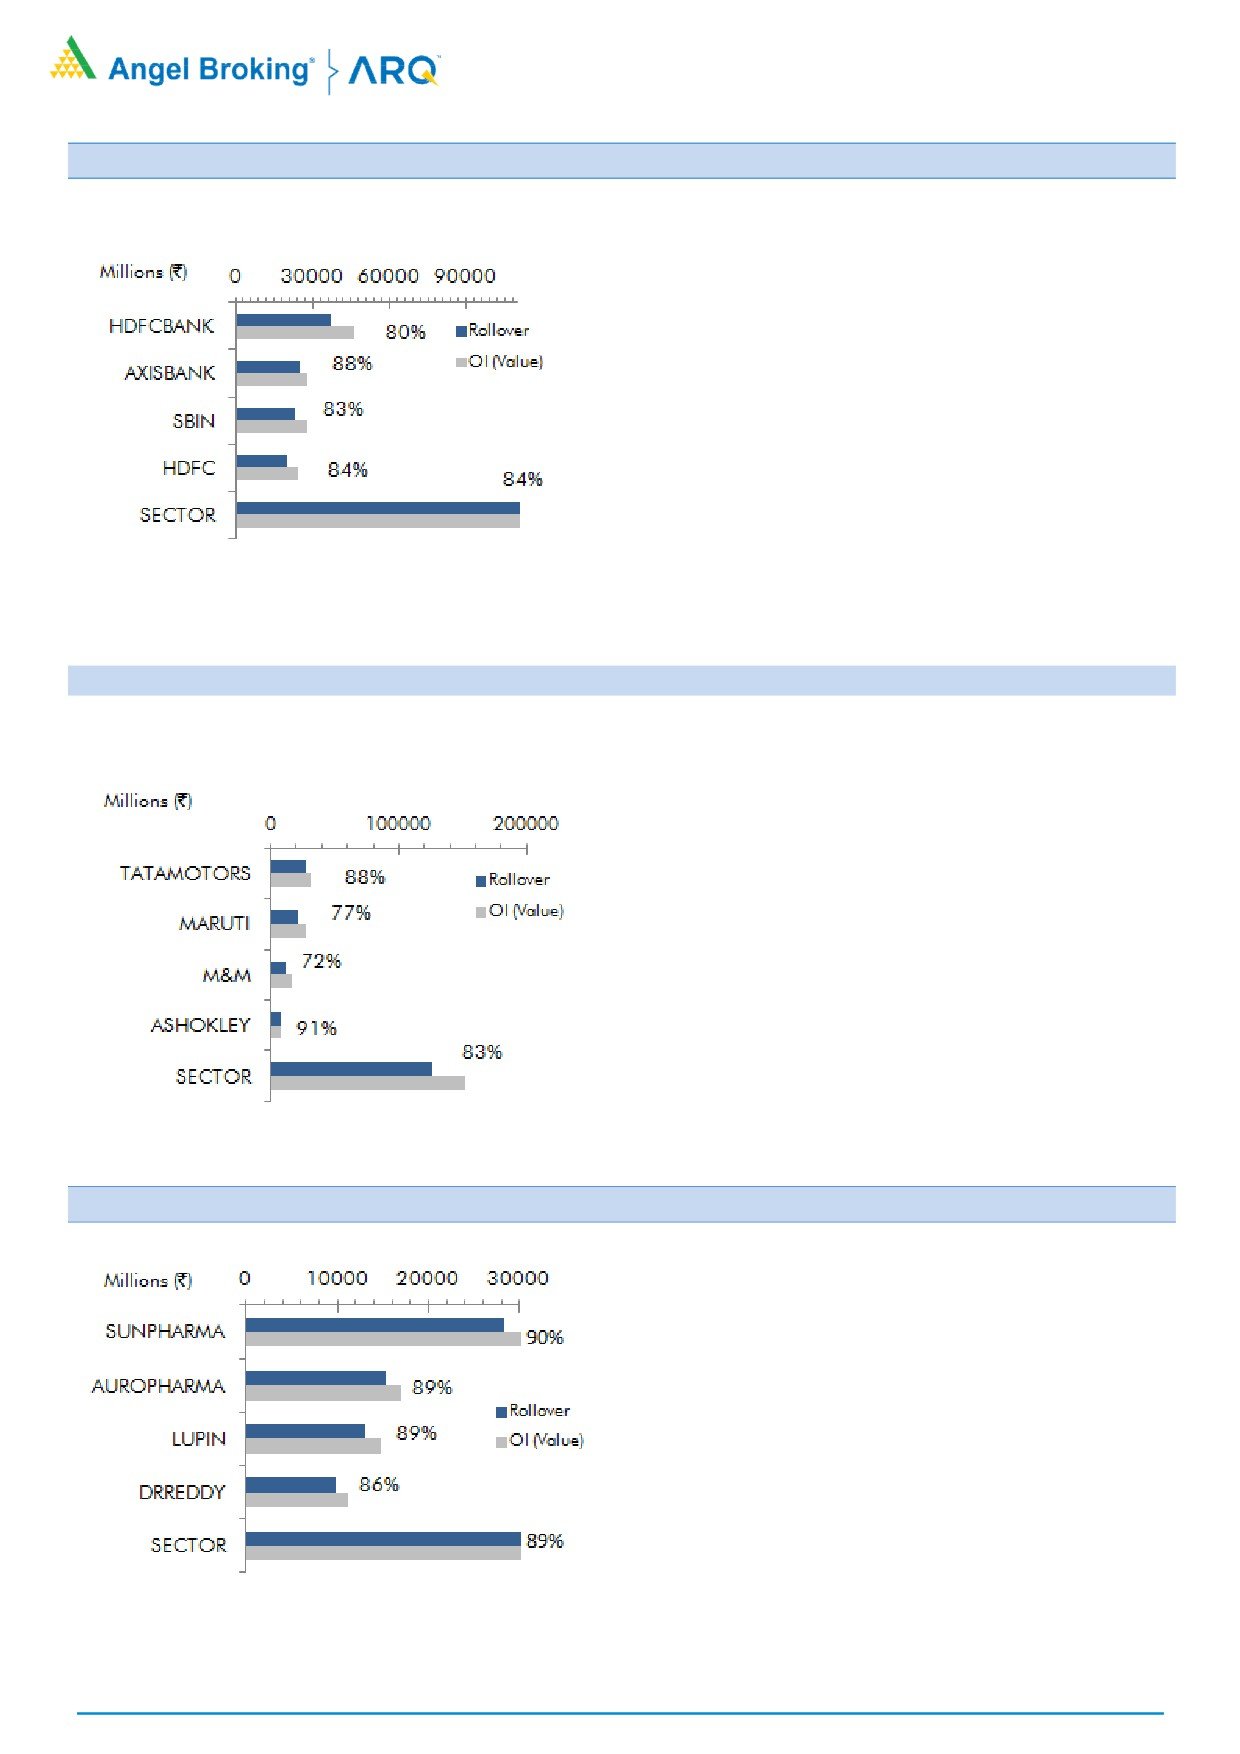
SBIN (82.93%) corrected nearly 3.50% with decent
amount of short formation which has been rolled
over too. This counter has an immediate support
around Rs. 300-305 levels and looking at the data,
we believe one may see short covering bounce from
these levels.
AXISBANK (88.39%) has been trading in a range of
Rs. 530-565 since quite some time. At the same time,
open interest activity has also been muted. We
believe any move beyond these levels may attract
decent momentum; thus, keep a watch.
In December series, we saw majority of the PSU
banks underperforming the overall market. Stocks
like UNIONBANK (87.41%), SYNDIBANK (86.08%)
and BANKINDIA (84.82%) corrected 10%-15% with
huge short rollovers. Avoid buying until we see any
signs of short covering.
Auto & Auto Ancillaries
TATMTRDVR (91.32%) rallied in the midst of last
series mainly due to short covering. We believe
majority of the shorts are now out of the system. Any
up move above Rs. 244 may attract fresh buying.
Thus, traders should look to add fresh longs above
these levels.
Last series, CEATLTD (86.58%) surpassed the hurdle
of Rs. 1850-1860 with meaningful long formation.
Rollovers are also above averages; suggesting these
positions are still intact. Thus, any dips near
Rs. 1850-1870 zone shall be any opportunity to add
fresh longs.
ASHOKLEY (90.55%) closed flat series on series and
OI activity also remained muted. Now, Rs. 113-114
has become a strong base for this counter; whereas,
immediate hurdle for this counter is around
Rs. 120-121 levels.
Pharmaceutical
CADILAHC (89.23%) has been consistently adding
huge positions and looking at the price action, it seem
majority of them are on short side. Any move above
the resistance zone of Rs. 435-437 may attract decent
short covering rally; hence, keep it on watch list.
Post massive correction, LUPIN (88.55%) recovered
nearly 8% series on series along with decent long
formation. Rollovers are also above average;
suggesting momentum to continue going ahead. Now,
immediate support for this counter is around
Rs. 860-865 levels; whereas, Rs. 930-940 zone is a
strong hurdle.
Last series, SUNPHARMA
(90%) surpassed its
resistance of Rs. 554-557 and also added some long
positions. Looking at OI, we believe these positions
are still in system and further buying may bring this
counter towards Rs. 610-620 levels; buy on dips.
For Private Circulation Only
2
Derivatives Rollover Report
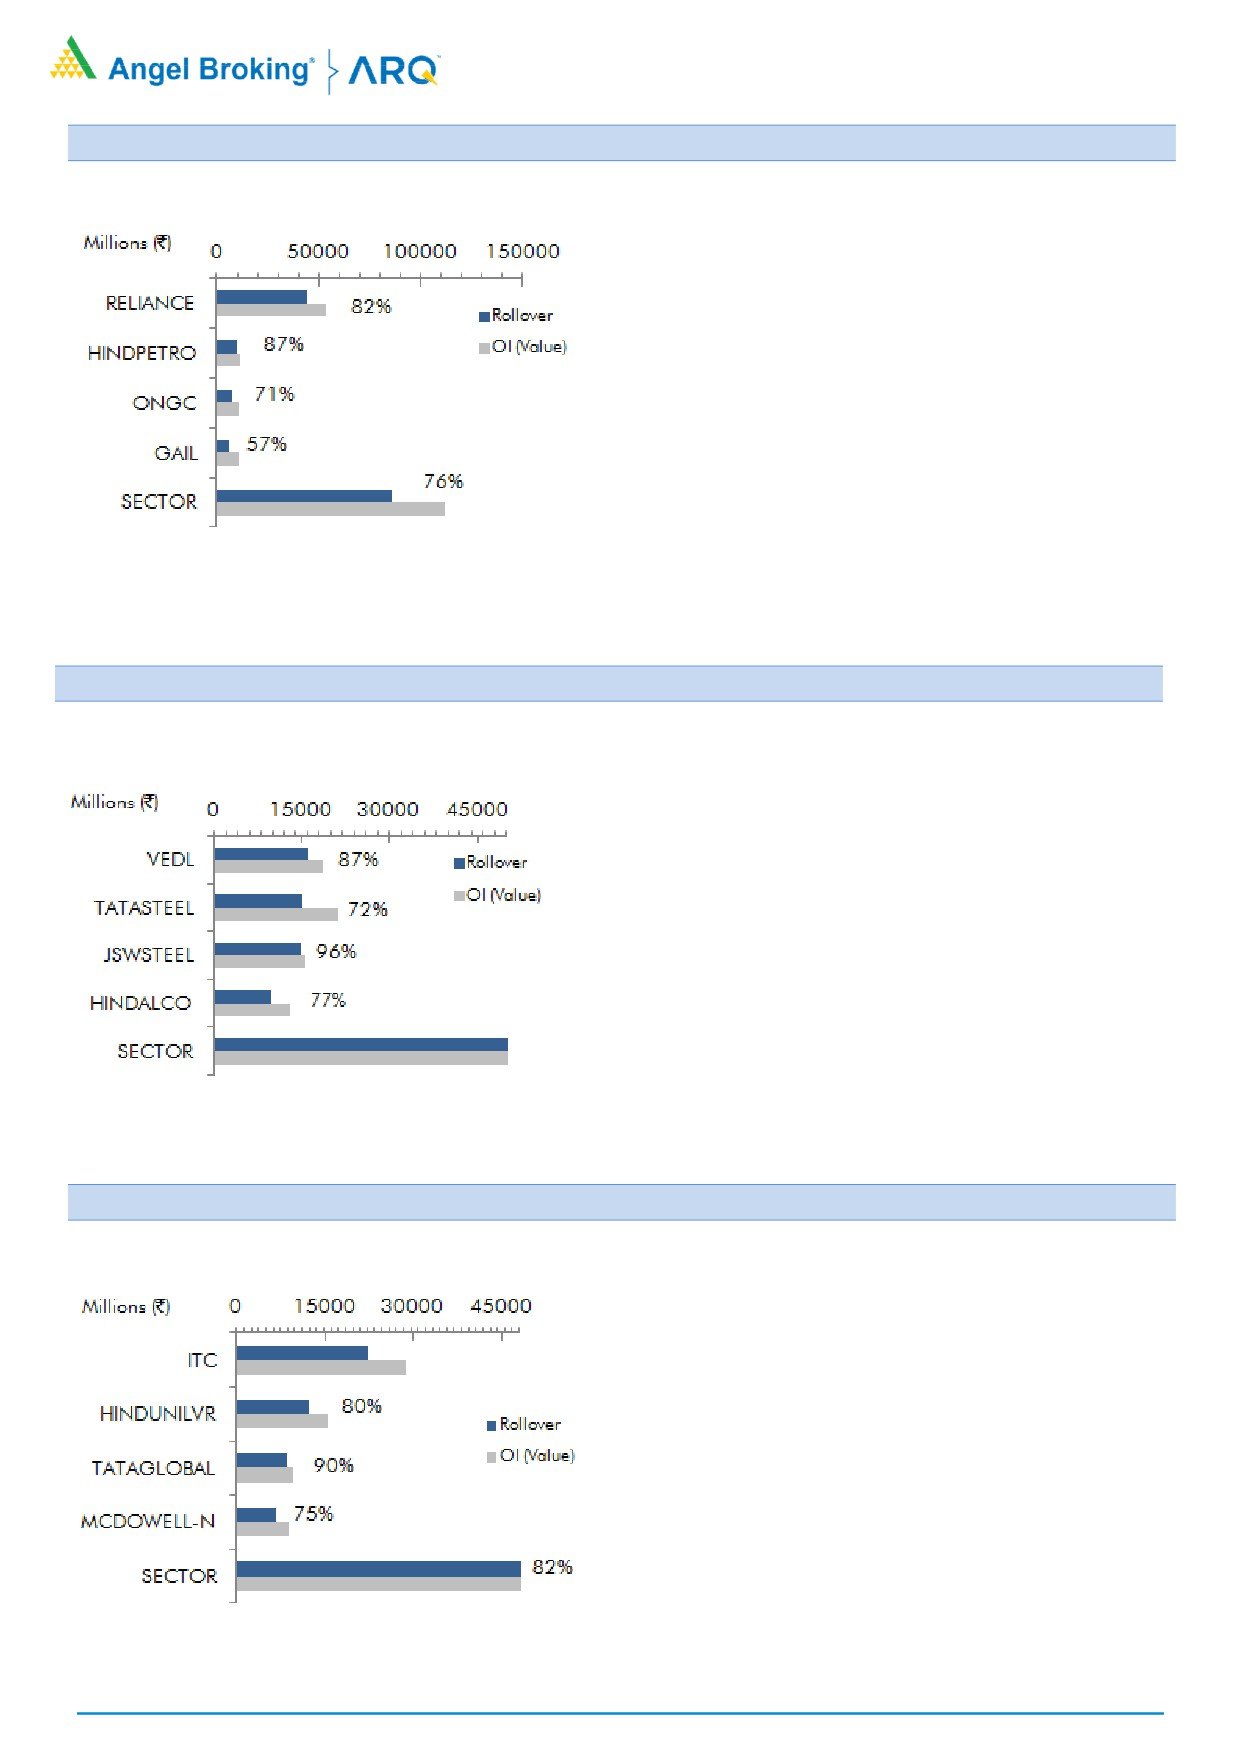
Oil & Gas
ET
(87.41%) traded in a narrow range
PETRON
throughout December series and closed on a flat
note. However, daily stats indicate majority of the
positions formed are on short side and are still intact.
Now, Rs. 249-250 is an immediate support for this
counter, while, any move above Rs. 257 may lead to
short covering rally.
GAIL (57.32%) is the top price gainer in this space
and also has lowest rollover. The recent rally in this
counter was mainly due to short covering. At present,
Rs. 480-482 is a strong support for index. Any dips
towards these levels shall be an opportunity to re-
enter.
Other stocks wherein we saw high rollovers are MRPL
(88.56%), HINDPETRO
(87.14%), CHENNPETRO
(83.58%) and IGL (82.43%).
Metal & Mining
HINDALCO (76.87%) rallied nearly 15% last series;
but this move was mainly due to short covering. At
present this counter is light in terms of open interest;
thus, unless we don’t see any relevant buying interest;
traders should avoid forming aggressive longs.
JSWSTEEL (94.40%) has highest rollover in this space.
We witnessed decent long formation in the recent up
move from Rs. 244-246 levels and these positions
have been rolled over too. Thus, it is a buy on dip
candidate for us.
TATASTEEL
(71.52%) has lowest rollover in this
segment. We saw some long formation last series;
but, majority of the positions formed have been
lightened up. This counter has lowest OI in last 4
months; hence, traders are advised to wait and watch
before initiating any directional positions.
Consumer Goods & FMCG
ASIANPAINT (77.84%) has been under pressure since
quite some time. Last series, this counter closed more
or less on a flat note; meanwhile, also added huge
positions out of which major portion is on short side.
77.45%
At present, this counter is short heavy and may lead
to decent short covering move.
TITAN
(89.42%) extended its gains in December
series as well and hits a fresh record high. We
witnessed decent long formations which are still in
system. Thus, avoid shorting this counter
Other stocks wherein we saw high rollovers are
DABUR (94.80%), JUBLFOOD (92.14%), GODREJCP
(91.96%) and TATAGLOBAL (90.30%).
For Private Circulation Only
3
Derivatives Rollover Report
Average
Price
OI
Rollover
Change
Change
Rollover
(3month)
Scrip
Price
(%)
OI Futures
(%)
COC (%)
PCR-OI
(%)
(%)
AUTO & AUTO ANCILLARIES
AMARAJABAT
852.25
6.11
1633100
(12.09)
9.71
0.29
85.33
84.29
APOLLOTYRE
269.20
7.36
9351000
3.66
1.94
0.41
76.42
76.26
ASHOKLEY
118.35
(0.42)
63462000
(0.42)
7.20
0.51
90.55
89.47
BAJAJ-AUTO
3314.85
(0.16)
1826250
0.76
7.79
0.95
84.68
86.69
BALKRISIND
1200.10
11.29
1264000
55.82
6.17
0.44
84.76
76.88
BHARATFORG
734.35
5.34
5713200
(13.78)
4.18
0.35
87.57
87.50
BOSCHLTD
20124.55
(1.36)
123100
2.37
3.37
1.44
80.50
85.64
CASTROLIND
194.60
(2.66)
17214400
(25.22)
10.13
0.80
92.40
89.74
CEATLTD
1961.60
9.32
1043700
(22.36)
10.15
0.27
86.56
82.86
EICHERMOT
30027.65
(0.36)
162800
(7.18)
8.53
1.46
82.02
84.23
ESCORTS
777.70
7.81
3971000
(6.69)
9.37
0.25
91.53
86.86
EXIDEIND
220.25
6.87
13412000
(17.94)
7.44
0.51
88.17
83.73
HEROMOTOCO
3741.80
2.52
1393400
8.23
8.82
0.75
79.58
77.82
M&M
753.70
6.46
15249000
79.00
6.52
0.35
72.48
79.07
MARUTI
9700.40
12.45
2209650
51.10
9.64
0.34
77.39
81.13
MOTHERSUMI
374.20
2.09
14350400
15.42
10.00
0.40
82.92
85.48
MRF
73813.35
6.80
61890
(11.50)
5.59
0.00
93.05
92.20
TATAMOTORS
420.45
3.37
65448000
(6.16)
5.76
0.74
87.60
85.97
TATAMTRDVR
239.25
2.79
24730000
(2.35)
9.05
0.60
91.32
91.27
TVSMOTOR
766.25
6.18
3941000
(16.59)
6.33
0.52
77.55
78.20
BANKING & FINANCIALS
ALBK
74.55
(3.18)
14580000
8.00
7.92
0.64
86.07
81.93
ANDHRABANK
59.30
(5.87)
21200000
2.76
8.85
0.72
84.06
82.41
AXISBANK
549.60
1.97
45052800
(0.19)
6.56
0.66
88.39
85.62
BAJAJFINSV
5324.90
1.79
624000
(18.24)
4.70
0.40
76.97
85.90
BAJFINANCE
1766.55
1.56
5284500
(6.21)
8.47
0.88
85.57
84.34
BANKBARODA
164.00
(3.61)
57984000
10.13
10.01
0.85
89.00
86.11
BANKINDIA
171.15
(12.83)
17058000
31.32
10.75
1.11
84.82
81.28
BHARATFIN
1001.75
1.72
9114000
(19.93)
9.37
0.86
90.77
89.94
CANBK
362.85
(3.32)
11342400
(2.51)
7.77
0.83
81.12
78.83
CANFINHOME
478.20
(1.68)
5676250
28.06
9.33
0.44
87.55
87.20
CAPF
694.15
(1.57)
4315200
13.89
9.08
0.93
89.78
88.22
CHOLAFIN
1295.80
0.62
526000
17.41
8.45
0.00
83.36
83.83
DCBBANK
195.10
4.95
6210000
14.24
10.10
0.59
86.14
84.51
DHFL
590.40
(4.80)
27285000
(4.74)
10.46
1.33
92.76
91.77
EQUITAS
149.90
1.04
18796800
10.29
10.96
0.39
92.45
89.00
FEDERALBNK
109.60
(1.44)
71863000
(7.86)
7.18
0.61
88.09
84.76
HDFC
1706.60
1.24
11854500
3.90
8.03
0.79
83.62
81.35
HDFCBANK
1872.10
0.79
19787500
12.22
-4.13
0.64
80.23
81.86
For Private Circulation Only
4
Derivatives Rollover Report
Average
Price
OI
Rollover
Change
Change
Rollover
(3month)
Scrip
Price
(%)
OI Futures
(%)
COC (%)
PCR-OI
(%)
(%)
IBULHSGFIN
1207.45
(0.39)
11773200
15.47
10.39
0.69
83.68
84.44
ICICIBANK
316.50
2.20
55602250
(26.15)
4.96
0.37
64.33
77.14
ICICIPRULI
391.95
3.61
4795700
(32.29)
6.52
0.59
80.06
85.67
IDBI
60.85
(0.16)
22680000
7.97
10.80
0.77
91.54
86.91
IDFC
63.20
1.12
151008000
7.18
8.30
0.63
93.56
88.70
IDFCBANK
54.55
(1.36)
135999000
1.96
10.84
0.75
90.67
91.51
IFCI
28.95
16.03
78628000
(3.82)
6.79
0.37
86.14
87.49
INDIANB
383.05
(3.14)
4024000
(5.72)
9.60
0.69
84.15
84.02
INDUSINDBK
1652.55
(0.39)
5527500
7.37
1.66
0.45
81.83
81.71
KOTAKBANK
1011.55
0.49
7621600
1.13
8.82
0.83
73.68
74.92
KTKBANK
150.45
(3.53)
22477000
(2.04)
9.16
0.73
88.55
87.67
L&TFH
174.50
0.35
45940500
(16.02)
7.89
0.89
85.32
87.05
LICHSGFIN
564.00
(3.75)
15266900
(0.80)
6.85
0.93
87.10
87.90
M&MFIN
472.30
7.12
4881250
(19.28)
10.29
0.39
67.60
80.52
MANAPPURAM
122.30
15.43
38904000
0.51
10.75
0.53
91.59
89.21
MFSL
604.10
9.78
2384000
(37.03)
9.13
0.09
78.94
82.80
MUTHOOTFIN
477.80
7.30
1573500
(36.39)
10.87
0.64
80.20
78.21
ORIENTBANK
122.25
(4.00)
15438000
17.27
10.75
1.25
86.52
83.38
PFC
120.50
(1.11)
65970000
11.85
7.07
0.90
85.80
83.73
PNB
171.70
(3.19)
54196000
22.92
6.87
0.74
82.82
78.29
RBLBANK
510.25
(1.88)
6099000
3.55
7.32
0.61
89.47
88.87
RECLTD
155.55
0.29
45684000
4.02
8.86
1.36
87.10
83.18
RELCAPITAL
571.40
31.09
12252000
0.44
3.32
0.64
88.97
89.08
REPCOHOME
687.15
8.67
742500
(19.95)
11.68
4.50
74.45
82.50
SBIN
310.70
(3.57)
74844000
16.95
9.72
0.70
82.98
77.86
SOUTHBANK
31.05
(6.05)
172101213
(4.26)
8.45
0.86
87.07
90.15
SREINFRA
99.50
(3.12)
15435000
11.40
9.24
0.90
86.01
87.28
SRTRANSFIN
1465.40
9.75
1815600
(25.78)
10.36
0.41
69.93
80.13
SYNDIBANK
79.35
(15.00)
25884000
39.07
11.60
0.94
86.08
85.53
UJJIVAN
395.30
1.22
7312000
(3.19)
10.97
0.49
89.67
87.40
UNIONBANK
147.00
(10.48)
20356000
49.28
9.83
0.93
87.41
79.37
YESBANK
315.15
2.27
53772250
(3.12)
6.86
0.70
87.15
86.69
CAPITAL GOODS & INFRASTRUCTURE
ADANIPORTS
401.35
0.19
10772500
1.63
8.66
1.19
79.89
82.27
BEML
1601.80
(4.51)
2152500
3.18
11.12
0.61
89.97
87.94
BHEL
92.65
0.16
57142500
13.92
7.07
0.63
86.17
86.99
CGPOWER
93.00
6.65
31164000
15.22
7.76
0.77
88.00
88.26
ENGINERSIN
200.45
6.23
11802000
(18.23)
9.50
0.24
82.06
81.02
GMRINFRA
20.45
10.54
308565000
9.89
12.87
0.52
90.09
90.67
HAVELLS
554.05
8.04
3340000
(16.46)
8.41
0.51
86.13
83.00
HCC
41.00
5.81
46770000
50.24
11.22
0.40
90.86
88.68
IRB
235.15
1.73
14292500
(9.97)
10.06
0.67
88.24
84.87
JPASSOCIAT
For Private Circulation Only
5
Derivatives Rollover Report
Average
Price
OI
Rollover
Change
Change
Rollover
(3month)
Scrip
Price
(%)
OI Futures
(%)
COC (%)
PCR-OI
(%)
(%)
JPASSOCIAT
23.35
27.60
193800000
13.16
8.43
0.65
86.60
88.69
LT
1261.00
3.10
11911500
(5.06)
8.58
0.41
77.72
80.53
NBCC
249.05
(5.95)
11103000
65.08
8.69
1.12
86.39
86.21
RELINFRA
559.40
26.48
10801700
16.11
10.22
0.32
84.85
87.51
SIEMENS
1241.25
3.08
895000
(6.87)
7.13
0.15
79.27
83.79
VOLTAS
656.15
2.83
2507000
4.02
0.00
0.27
78.49
79.71
CEMENT
ACC
1755.00
4.70
1177600
(29.57)
4.73
0.65
85.81
85.17
AMBUJACEM
272.20
3.22
9300000
2.03
2.88
0.18
80.29
82.78
DALMIABHA
3249.50
2.40
570600
(14.09)
10.60
1.38
86.53
87.23
GRASIM
1136.20
(3.41)
4125750
15.74
8.08
1.32
88.27
88.96
INDIACEM
180.80
3.55
24839500
(10.71)
9.08
0.62
90.53
90.62
RAMCOCEM
796.15
12.91
464000
(18.31)
-0.49
1.75
52.92
73.04
SHREECEM
18016.15
4.33
38600
(2.65)
2.89
0.00
85.40
84.41
ULTRACEMCO
4297.90
1.70
1342800
11.03
6.54
0.63
85.65
85.50
CHEMICALS & FERTILIZERS
PIDILITIND
907.85
7.08
1223000
29.42
9.18
0.32
82.14
81.05
TATACHEM
736.65
0.62
7932000
14.63
10.70
0.59
92.66
90.07
UPL
767.95
4.68
12762000
8.28
7.94
0.61
89.02
87.13
CONSUMER GOODS & FMCG
ASIANPAINT
1148.60
(0.50)
3260400
14.42
4.78
1.03
77.84
78.46
BERGEPAINT
262.80
1.94
1843600
30.53
11.26
0.64
84.65
79.71
BRITANNIA
4701.60
(2.02)
1059800
(14.09)
9.93
0.06
88.60
84.38
COLPAL
1085.05
4.53
991900
(13.91)
-0.78
0.08
69.16
77.15
DABUR
347.55
0.36
11040000
4.89
10.40
0.37
94.80
91.08
GODFRYPHLP
995.00
(1.48)
665000
14.95
9.70
3.00
79.40
80.22
GODREJCP
992.95
2.67
1949600
16.05
11.26
0.46
91.96
87.05
HINDUNILVR
1364.55
6.73
8972400
4.75
9.67
0.48
79.68
85.55
ITC
263.20
2.09
84386400
8.64
6.72
0.54
77.45
81.06
JUBLFOOD
1723.50
(3.60)
2362000
33.56
10.48
0.13
92.14
85.70
MARICO
319.30
3.65
4851600
(6.98)
7.60
1.00
86.43
79.40
MCDOWELL-N
3654.25
10.50
1808500
(14.24)
10.77
0.21
75.05
86.01
NESTLEIND
7760.40
0.93
122500
(22.07)
4.62
0.00
82.05
83.23
TATAGLOBAL
309.10
7.03
27850500
10.89
10.63
0.31
90.30
89.19
TITAN
856.40
3.98
6513000
24.23
7.19
0.30
89.42
84.44
UBL
1080.00
(0.79)
1654100
12.74
8.50
1.12
88.30
83.33
For Private Circulation Only
6
Derivatives Rollover Report
Average
Price
OI
Rollover
Change
Change
Rollover
(3month)
Scrip
Price
(%)
OI Futures
(%)
COC (%)
PCR-OI
(%)
(%)
METALS & MINING
COALINDIA
263.75
(3.78)
21654600
5.49
2.97
0.37
80.85
76.31
HINDALCO
277.10
14.67
35588000
(20.46)
8.76
0.89
76.87
82.12
HINDZINC
313.80
4.13
6595200
7.40
9.84
0.56
91.07
85.54
JINDALSTEL
204.15
17.87
35815500
10.79
10.95
0.60
85.13
83.37
JSWSTEEL
273.40
6.61
54585000
5.88
10.09
0.39
95.52
94.75
NATIONALUM
87.05
5.77
43496000
16.67
10.57
0.56
83.27
86.68
NMDC
139.55
8.81
28968000
(2.11)
9.41
0.37
88.80
86.72
SAIL
93.50
20.88
86916000
9.02
10.54
0.58
86.93
87.52
TATASTEEL
738.75
5.85
20479000
(17.03)
4.43
0.67
71.53
81.56
VEDL
334.75
12.58
48261500
5.05
8.03
0.63
86.79
82.26
INFORMATION TECHNOLOGY
HCLTECH
882.15
3.54
8739500
3.86
5.71
0.54
81.68
84.90
HEXAWARE
336.05
(0.88)
3723000
14.17
-10.20
0.27
73.87
74.26
INFY
1038.80
6.25
27546000
(16.98)
7.00
0.41
81.18
79.52
KPIT
175.00
1.63
10858500
12.87
11.65
0.30
86.30
88.73
MINDTREE
616.90
13.77
1870800
(7.75)
8.29
0.06
76.84
81.78
NIITTECH
654.20
1.59
865500
0.70
9.33
0.32
81.38
80.53
OFSS
4094.30
10.04
77850
39.52
10.51
0.00
70.42
75.13
TATAELXSI
950.25
0.12
2076800
1.41
9.12
0.75
83.85
84.75
TCS
2631.30
(0.74)
5810000
(6.73)
2.16
0.79
82.35
83.87
TECHM
498.20
1.11
12236400
6.46
3.02
0.66
84.48
86.50
WIPRO
299.20
3.07
39093600
14.45
-37.24
0.31
83.46
85.83
MISCELLANIOUS
ADANIENT
166.10
12.53
23560000
(11.53)
6.71
0.36
88.07
89.02
APOLLOHOSP
1236.20
11.14
908000
(52.44)
4.18
0.41
75.42
70.37
BALRAMCHIN
131.65
(17.90)
15267000
(7.64)
8.97
0.98
82.82
85.88
BATAINDIA
747.65
1.09
1677500
(11.49)
9.13
0.50
83.75
74.29
BEL
182.90
(2.30)
18612000
(4.28)
9.69
0.64
79.31
84.00
CONCOR
1380.00
4.88
1024375
(17.93)
4.17
0.43
91.00
87.63
CUMMINSIND
918.70
5.23
571800
(15.81)
8.07
0.42
61.21
74.70
GODREJIND
605.85
4.22
2137500
(34.21)
7.03
0.73
87.53
83.62
INDIGO
1212.30
7.30
2424600
8.89
5.40
0.59
91.67
90.57
INFIBEAM
164.90
(3.60)
36412000
(10.32)
8.75
0.38
80.24
83.47
JETAIRWAYS
824.25
20.47
5428800
(10.10)
11.73
0.56
83.41
85.67
JISLJALEQS
129.40
7.25
44784000
(7.46)
13.74
0.64
93.87
91.97
JUSTDIAL
527.80
(1.03)
3589600
58.41
10.71
0.23
83.27
78.08
KAJARIACER
711.75
(2.20)
1408800
(9.41)
2.02
0.06
77.61
79.43
KSCL
549.65
0.48
3879000
1.25
9.92
0.47
83.93
86.97
For Private Circulation Only
7
Derivatives Rollover Report
Average
Price
OI
Rollover
Change
Change
Rollover
(3month)
Scrip
Price
(%)
OI Futures
(%)
COC (%)
PCR-OI
(%)
(%)
MCX
945.50
(2.01)
3462500
37.51
9.51
1.57
92.69
90.29
PCJEWELLER
460.50
15.72
7369500
(41.91)
7.97
0.32
87.14
85.14
RNAVAL
49.00
24.84
15993000
14.35
12.08
0.61
80.23
84.17
VGUARD
238.20
3.27
3012000
5.02
7.98
0.11
79.94
76.79
OIL & GAS
BPCL
520.60
2.88
8166600
(21.92)
-13.87
0.60
62.03
68.65
CHENNPETRO
430.95
0.75
2275500
14.58
9.91
0.28
83.58
80.93
GAIL
505.60
8.37
12080000
(19.95)
-14.28
0.56
57.32
68.07
HINDPETRO
423.95
1.37
24132150
(8.39)
4.01
0.74
87.14
86.34
IGL
330.20
0.43
5288250
(5.69)
7.34
1.25
82.43
83.65
IOC
393.65
(0.03)
9561000
(23.43)
5.49
0.84
65.53
66.28
MGL
1096.35
(1.31)
1101000
(2.70)
10.37
0.33
81.96
80.77
MRPL
129.75
5.57
9265500
(19.06)
5.55
0.39
88.56
81.07
OIL
373.05
3.63
2560580
4.53
-10.06
0.55
70.32
71.87
ONGC
194.30
6.79
38220000
(9.69)
8.78
0.28
70.87
77.72
PETRONET
252.15
(0.14)
17559000
3.15
8.06
0.59
87.41
80.22
RELIANCE
929.00
0.13
47441000
18.88
6.77
0.42
81.77
85.45
PHARMACEUTICAL
AJANTPHARM
1482.50
7.94
738500
(6.04)
10.55
0.26
86.42
85.37
AUROPHARMA
688.40
(1.35)
22136000
2.79
9.54
0.66
89.45
90.27
BIOCON
541.30
24.18
8033400
(15.60)
2.53
0.46
84.53
84.97
CADILAHC
427.50
(0.96)
6617600
29.45
11.23
1.42
89.23
84.09
CIPLA
608.55
0.56
7377000
1.26
5.38
0.59
84.47
86.34
DIVISLAB
1123.10
7.37
2887200
(17.11)
10.35
0.35
84.54
84.27
DRREDDY
2447.55
6.45
3999000
(2.60)
9.41
0.62
87.57
86.86
FORTIS
163.40
12.26
48300000
(4.32)
11.67
0.22
94.01
95.09
GLENMARK
594.35
4.82
7643700
(4.53)
5.73
0.51
89.38
88.29
GRANULES
138.05
6.89
16920000
(3.81)
12.39
0.29
87.62
86.68
LUPIN
886.25
7.65
14728200
19.15
8.44
0.48
88.55
85.47
PEL
2861.55
2.69
1593900
2.89
7.33
0.41
90.39
90.06
STAR
834.35
3.65
4327200
(0.03)
9.13
0.62
91.64
90.23
SUNPHARMA
571.45
5.10
49516500
9.15
6.99
0.37
90.02
92.60
TORNTPHARM
1405.15
8.77
415500
(19.29)
8.45
0.69
83.38
85.67
WOCKPHARMA
920.20
26.67
2884500
(1.80)
12.08
1.48
83.01
86.07
REAL ESTATE
DLF
265.70
13.21
37260000
(10.67)
9.39
0.89
84.79
87.53
HDIL
59.45
(5.78)
33417000
(3.80)
7.72
0.59
84.54
86.27
NCC
134.90
8.97
26240000
15.90
11.70
0.32
83.00
83.25
TEXTILES
For Private Circulation Only
8
Derivatives Rollover Report
POWER
ADANIPOWER
41.10
14.97
111940000
1.27
12.81
0.24
93.80
93.08
CESC
1052.15
3.60
4765200
(2.18)
10.11
0.54
84.52
86.32
JSWENERGY
89.70
6.15
56652500
(1.48)
11.73
0.73
88.45
90.53
NHPC
32.00
12.48
45036000
(1.94)
8.20
0.33
75.37
80.28
NTPC
176.75
(2.96)
25588000
(21.27)
4.44
0.40
65.77
71.27
POWERGRID
200.70
(3.16)
24968000
23.36
10.15
1.05
81.05
73.69
PTC
116.25
(0.56)
19560000
(3.55)
7.90
1.04
85.13
85.99
RPOWER
45.20
18.02
67587000
14.31
10.17
0.37
90.66
90.92
SUZLON
15.25
8.54
416080000
(3.35)
17.32
0.32
87.58
88.32
TATAPOWER
92.60
(2.88)
61281000
24.34
7.79
0.37
88.59
85.66
TORNTPOWER
273.70
(4.15)
5604000
9.95
10.56
1.91
85.37
80.16
TELECOM
BHARTIARTL
535.45
7.37
35473900
(1.38)
10.06
0.66
85.34
84.17
IDEA
102.80
8.21
40418000
(9.98)
5.09
0.56
79.31
75.27
INFRATEL
369.65
(4.15)
8576500
(11.43)
5.31
0.94
77.31
76.20
RCOM
30.75
143.08
73780000
(19.17)
-6.33
0.87
70.75
82.20
TATACOMM
684.75
(1.23)
8516800
15.00
10.36
0.52
88.54
89.23
TEXTILES
ARVIND
451.65
2.79
7102000
32.90
11.80
0.51
86.76
85.44
CENTURYTEX
1433.70
8.61
7161000
(3.97)
9.85
0.45
95.03
92.41
ICIL
126.55
5.15
11095000
6.15
8.81
0.90
90.73
87.52
PAGEIND
25249.05
12.94
34100
44.80
4.63
0.00
79.21
78.35
RAYMOND
1055.35
8.66
4207200
1.17
10.02
0.25
95.22
91.65
SRF
1961.15
6.54
647500
(24.09)
7.62
0.48
88.28
82.98
MEDIA
DISHTV
82.20
0.00
37548000
49.46
10.39
0.59
90.08
87.56
PVR
1416.60
7.67
448400
(11.17)
7.45
0.27
77.74
76.65
SUNTV
1007.20
15.20
4871000
(18.01)
9.91
0.69
84.13
87.28
TV18BRDCST
60.75
7.05
77061000
9.12
10.82
0.51
92.53
92.46
ZEEL
588.70
2.92
5015400
(5.19)
6.34
0.31
75.23
80.91
For Private Circulation Only
9
Derivatives Rollover Report
Research Team Tel: 022 - 39357800
DISCLAIMER
Angel Broking Private Limited (hereinafter referred to as “Angel”) is a registered Member of National Stock Exchange of India
Limited, Bombay Stock Exchange Limited and Metropolitan Stock Exchange Limited. It is also registered as a Depository Participant
with CDSL and Portfolio Manager and Investment Adviser with SEBI. It also has registration with AMFI as a Mutual Fund Distributor.
Angel Broking Private Limited is a registered entity with SEBI for Research Analyst in terms of SEBI (Research Analyst) Regulations,
2014 vide registration number INH000000164. Angel or its associates has not been debarred/ suspended by SEBI or any other
regulatory authority for accessing /dealing in securities Market. Angel or its associates/analyst has not received any compensation /
managed or co-managed public offering of securities of the company covered by Analyst during the past twelve months.
This document is solely for the personal information of the recipient, and must not be singularly used as the basis of any investment
decision. Nothing in this document should be construed as investment or financial advice. Each recipient of this document should
make such investigations as they deem necessary to arrive at an independent evaluation of an investment in the securities of the
companies referred to in this document (including the merits and risks involved), and should consult their own advisors to determine
the merits and risks of such an investment.
Reports based on technical and derivative analysis center on studying charts of a stock's price movement, outstanding positions and
trading volume, as opposed to focusing on a company's fundamentals and, as such, may not match with a report on a company's
fundamentals. Investors are advised to refer the Fundamental and Technical Research Reports available on our website to evaluate
the contrary view, if any.
The information in this document has been printed on the basis of publicly available information, internal data and other reliable
sources believed to be true, but we do not represent that it is accurate or complete and it should not be relied on as such, as this
document is for general guidance only. Angel Broking Pvt. Limited or any of its affiliates/ group companies shall not be in any way
responsible for any loss or damage that may arise to any person from any inadvertent error in the information contained in this
report. Angel Broking Pvt. Limited has not independently verified all the information contained within this document. Accordingly, we
cannot testify, nor make any representation or warranty, express or implied, to the accuracy, contents or data contained within this
document. While Angel Broking Pvt. Limited endeavors to update on a reasonable basis the information discussed in this material,
there may be regulatory, compliance, or other reasons that prevent us from doing so.
This document is being supplied to you solely for your information, and its contents, information or data may not be reproduced,
redistributed or passed on, directly or indirectly.
Neither Angel Broking Pvt. Limited, nor its directors, employees or affiliates shall be liable for any loss or damage that may arise
from or in connection with the use of this information.
Derivative Research Team
For Private Circulation Only
10