Derivatives
Rollover Report
April 28, 2017
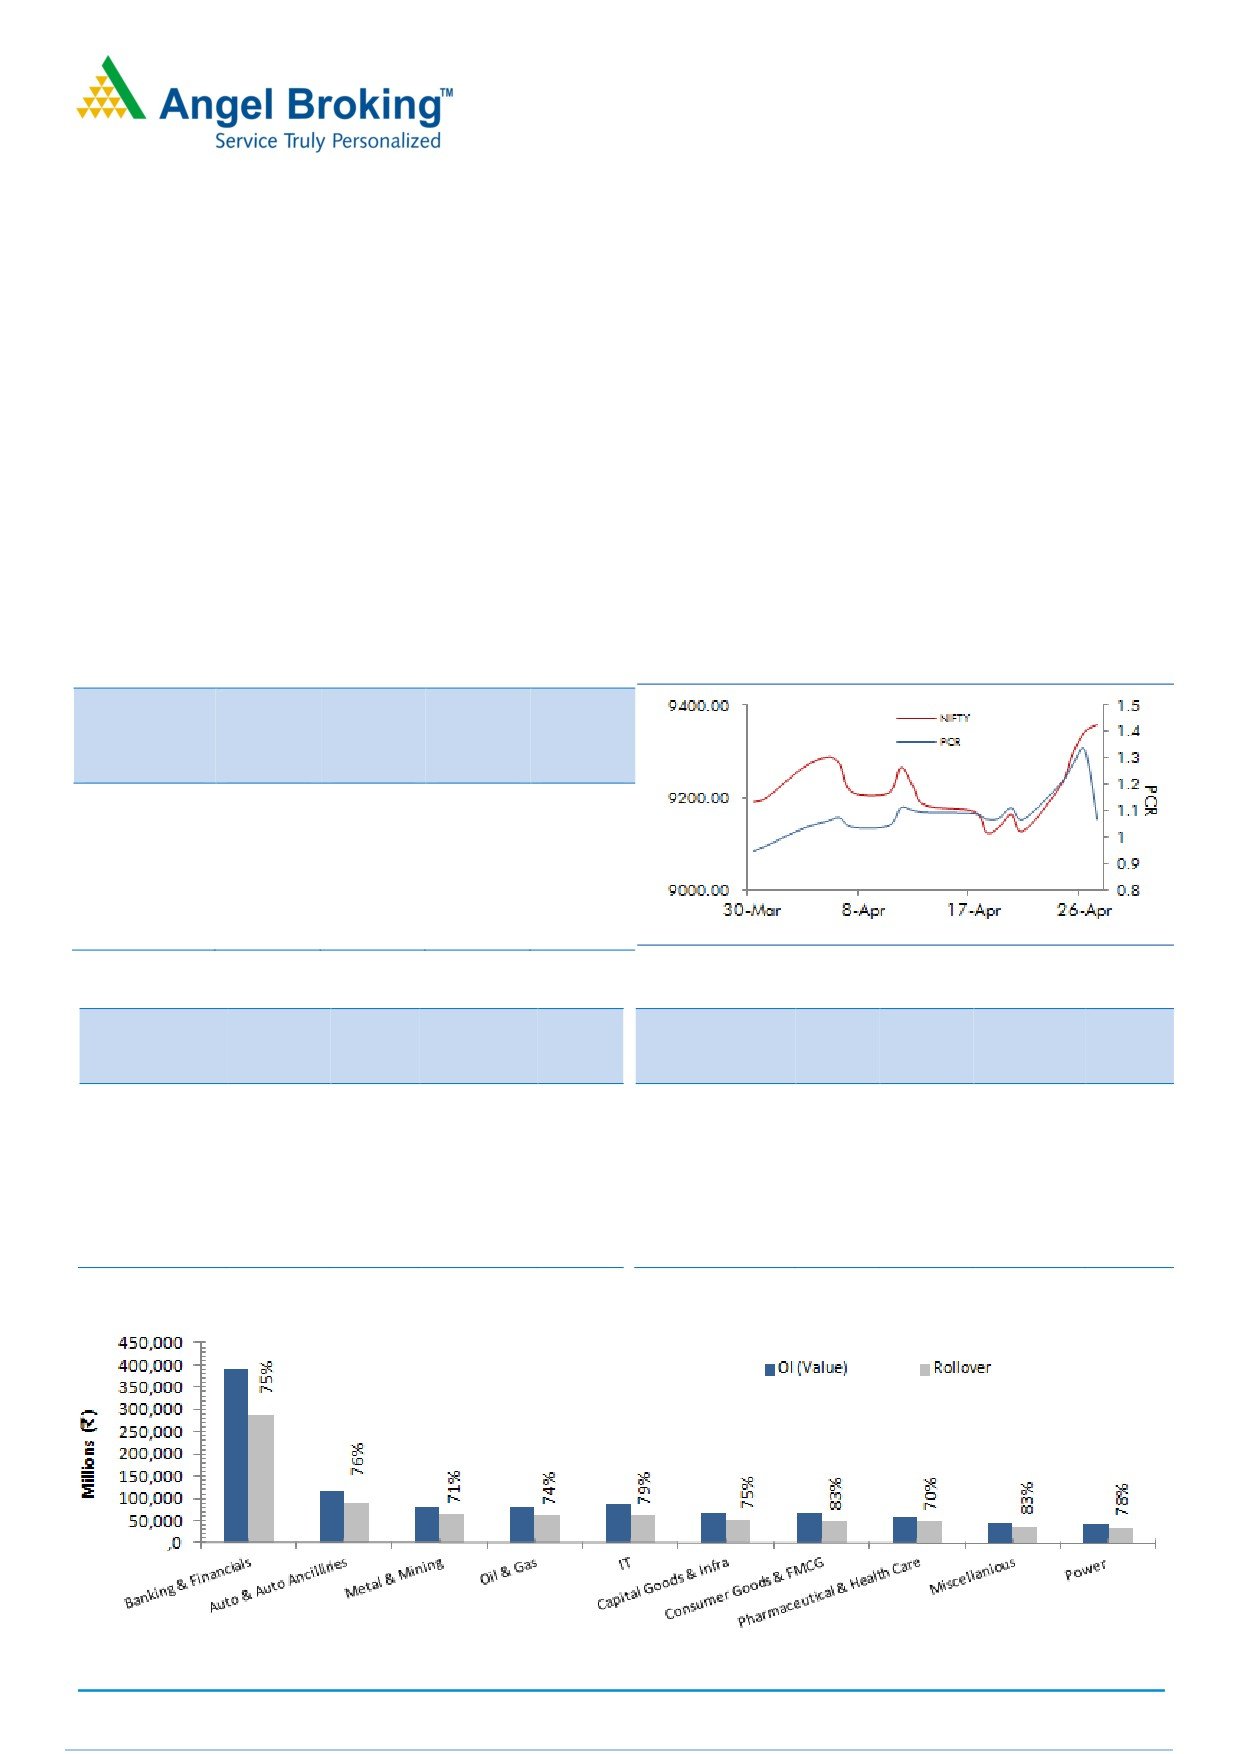
Market inaugurated April series on a flat note and remained in a sideways direction for the major part of the series.
However, we witnessed a sharp rally in the concluding week, resulting into the benchmark indices registering a new
record high. Rollover in Nifty is on lower side in both percentage terms as well as in terms of open interest. We
witnessed some profit-booking in Nifty during the consolidation phase; however, significant buying interest was seen in
last week of April series. This is the fifth consecutive month, when Nifty ended the series on a positive note (Month on
Month basis) and FIIs too participated by rolling 70% of their longs in index futures. As a result, their ‘Long/Short
Ratio’ has jumped from 76.70% to 85.30% series on series, indicating continuation of their optimistic view near term.
However, FIIs curbed liquidity in cash market segment, they sold equities worth Rs. 5,477 crores. As per options data,
9500 followed by 9400 are seeking bull’s attention and the major support is firmly placed at 9000-9100. Overall
derivatives data hints, continuation of up move towards 9450-9500, but one should avoid being hastened to form
longs at these levels as market has run up sharply.
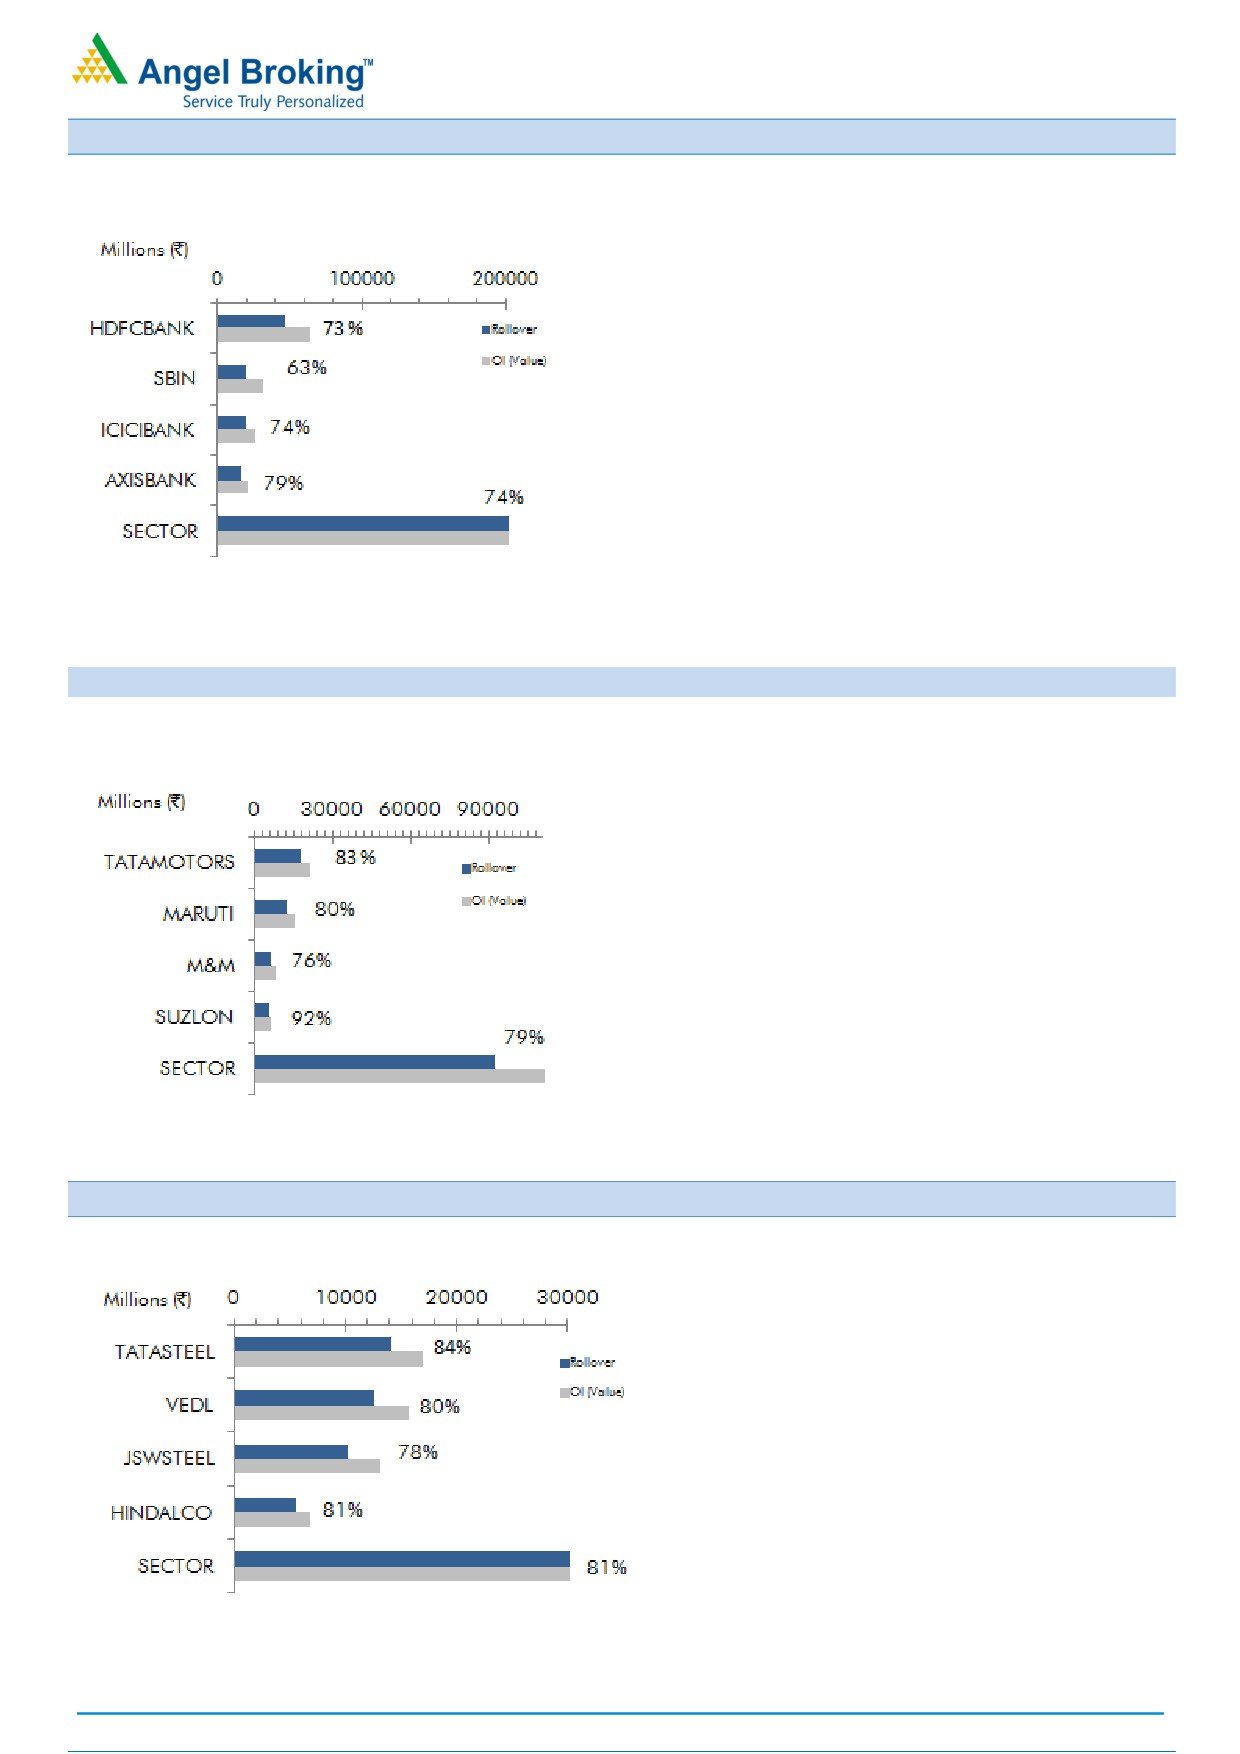
Rollover in BankNifty is much above its quarterly average; hinting nearly huge long formed last series are still intact.
HDFCBANK (72.64%) and KOTAKBANK (71.98%) was the major contributor in the strength seen in the benchmark
index. While, mid-cap banking and financial stocks like SOUTHBANK (89.88%), BANKINDIA (54.67%), DHFL (84.38)
and ORIENTBANK (63.17%) rallied 21%-14% series on series. On the flip side, heavy weight banking counters like
ICICIBANK (73.92%), SBIN (63.31%) and AXISBANK (78.63%) under-performed the overall banking pack.
Indices Change
NIFTY & PCR Graph
Price
Change
3 month
INDEX
Price
(%)
Rollover
avg.
NIFTY
9356.65
1.82
66.33
71.36
BANKNIFTY
22293.65
3.47
77.04
62.78
NIFTYIT
10013.00
(6.70)
71.76
82.16
NIFTYMID50
4216.95
5.91
-
-
NIFTYINFRA
3061.40
4.10
-
-
Monthly Gainers
Monthly Losers
Price
Ol
Price
Ol
Change Open
Change
Change Open
Change
Scrip
Price
(%)
Interest
(%)
Scrip
Price
(%)
Interest
(%)
IBREALEST
157.55
79.24
15590000
(50.46)
ADANIPOWER
33.05
(17.79)
112900000
(10.35)
INDIACEM
213.30
31.91
20167000
(11.73)
MCDOWELL-N
1859.90
(15.69)
3703750
4.27
DLF
190.75
26.74
29875000
(4.00)
DISHTV
95.20
(12.46)
25571000
(0.05)
SOUTHBANK
24.80
21.57
103333638
27.84
INFY
928.15
(9.64)
29408000
(13.05)
JISLJALEQS
113.95
21.55
35001000
(6.09)
AUROPHARMA
610.75
(9.55)
15036000
4.05
Note: Stocks which have more than 1000 contract in Futures OI.
Note: Stocks which have more than 1000 contract in Futures OI.
SEBI Registration No: INB 010996539
1
Derivatives Rollover Report
Banking and Financials
We witnessed good amount of short covering
followed by huge long formation in HDFCBANK
(72.64%), which resulted this counter registering a
new high. Rollovers are on the higher side hinting
longs formed are still in system. Thus, traders are
suggested to hold on their longs.
ICICIBANK
(73.92%) underperformed the overall
banking space. Since, January series this counter has
been under pressure and has also added huge
shorts, which are still intact. Thus, even though this
counter is near its support zone of Rs. 265-Rs. 270,
we would suggest avoiding any bottom fishing unless
we see any signs of short covering.
IDFCBANK (76.24%) corrected from Rs. 62 levels with
good amount of short formation which are still intact
in system. However, fresh buying in this stock,
resulting stock surpassing the resistance zone of Rs.
61-Rs. 62 levels. Thus, we expect short covering to
led continuation of the ongoing momentum in this
stock.
Auto & Auto Ancillaries
TVSMOTORS (76.95%) rallied
12.79% with huge
amount of long formation. Rollover in this counter is
also above averages suggesting these positions have
been rolled too. Thus, we expect continuation of the
ongoing rally.
TATAMOTORS (83.16%) has been under pressure
from quite some time. We witnessed good amount of
short
formation
during
correction
from
Rs. 475 - Rs. 480 levels and these positions are still
intact as rollovers are above averages. However, this
counter has shown some strength from its support
zone of 435-440 levels and we expect further short
covering move in near term. Thus, this counter is a
buy on dip for us.
APOLLOTYRE (82.70%), CEATLTD (73.79%) and MRF
(80.67%) rallied 14% - 19% last series; however,
rollovers of all these counters are below averages.
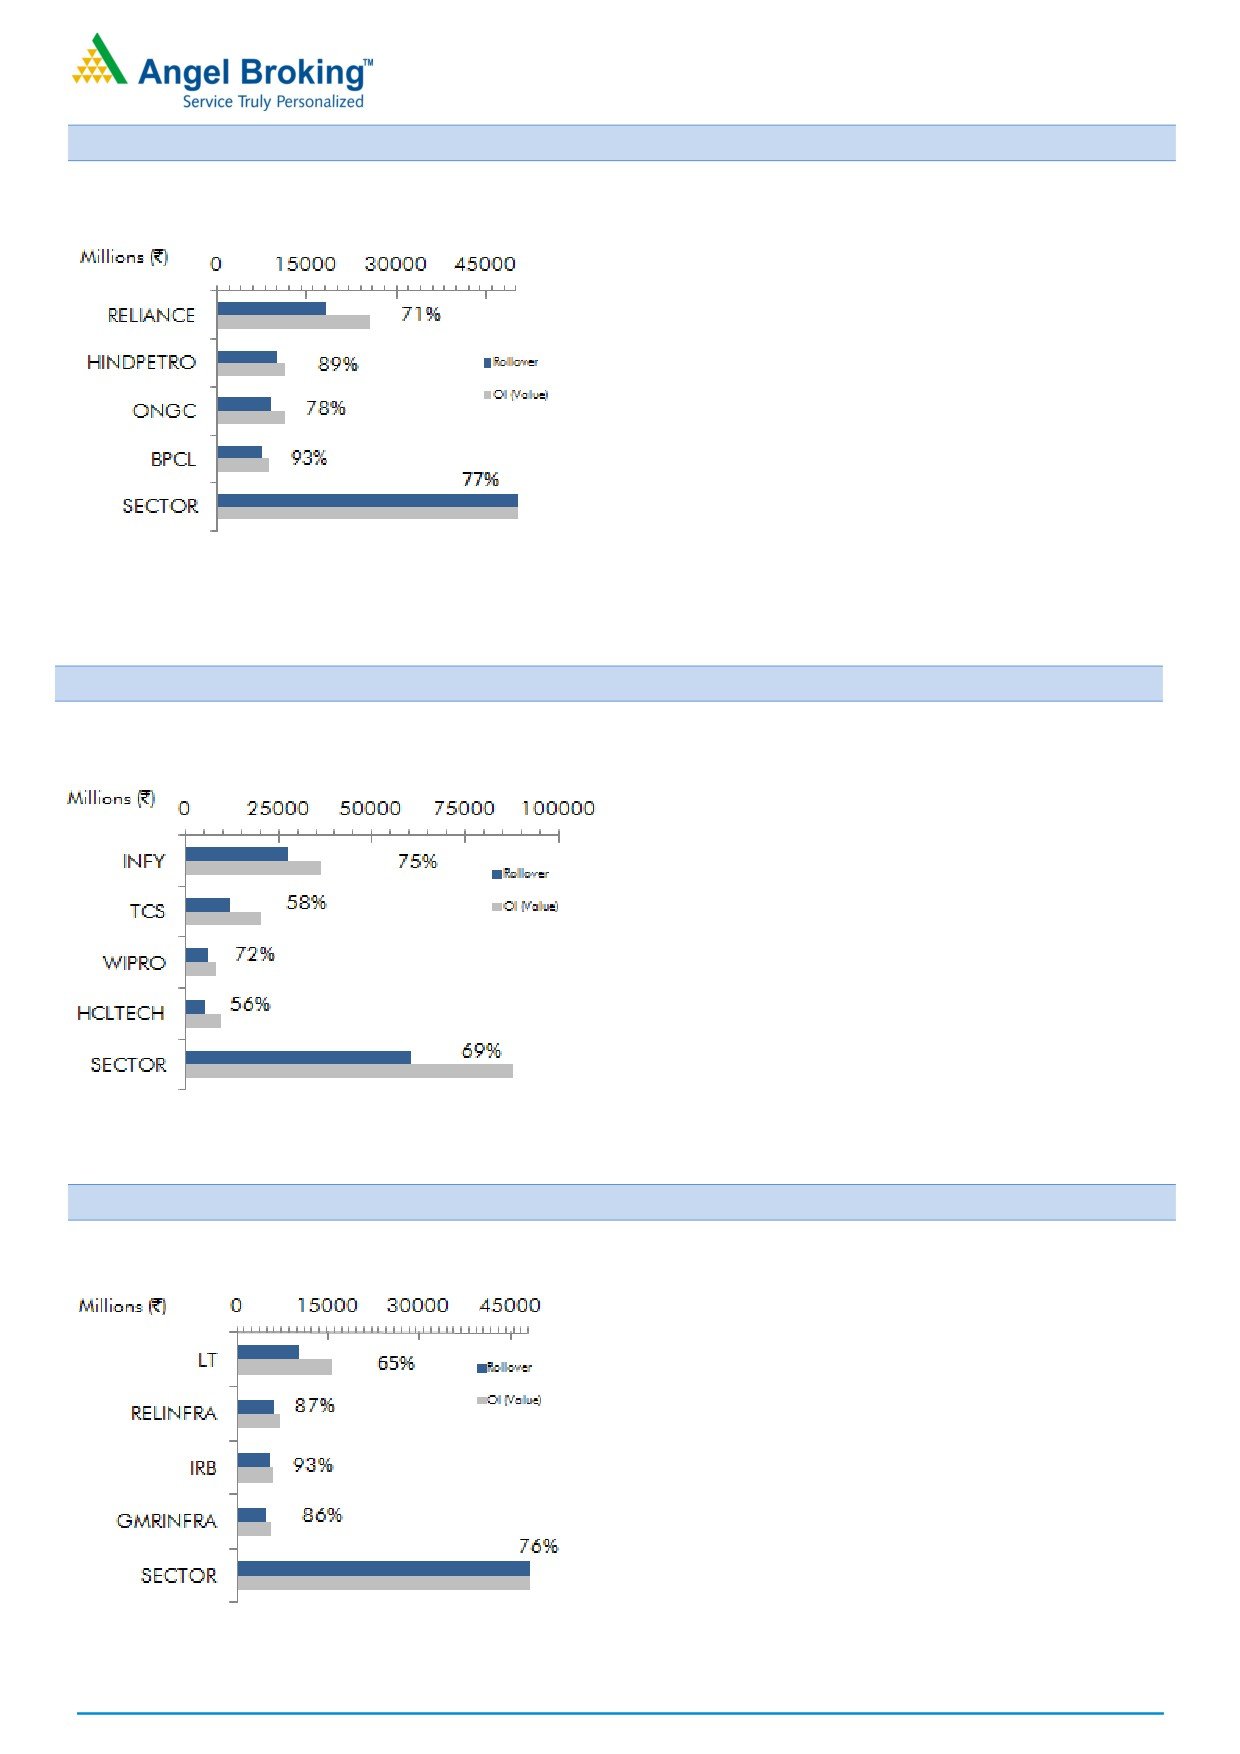
Metal & Mining
TATASTEEL (83.61%) corrected from Rs. 502 levels
with huge short formation and the same has been
rolled to May series. This counter has strong support
near Rs. 440-Rs. 445 levels. We expect some short
covering bounce going ahead
JSWSTEEL (77.53%) out performed its peer group. Post
short formation in mid of April series, this counter
added good amount of fresh longs. We believe, shorts
formed have been lightened. Thus, we expect further
additions of longs which may lead continuation of
upside move.
HINDALCO (80.98%) rallied from Rs. 182 levels but
this move was mainly because of short covering. At
current juncture, this counter is light in terms of open
interest. Thus traders are suggested to wait for any
relevant development in either side before forming
any direction positions.
For Private Circulation Only
SEBI Registration No: INB 010996539
2
Derivatives Rollover Report
Oil & Gas
ONGC (78.43%) have been consistently attracting
shorts since last couple of months. Rollovers and
open interest data suggests that these position have
been rolled to May series as well. Thus, we would
suggest traders to avoid forming any longs.
RELIANCE (71.45%) is one of the major contributors
in index up move, but surprisingly we hardly saw any
relevant long formation in this rally. At current
juncture, this counter is light in terms of open interest.
Thus, one should wait for formation of fresh position
before forming any directional positions.
PETRONET (89.37%) rallied 7.60% series on series
and added huge positions. However, daily statistic
suggests these are mixed positions and the same got
rolled too. Thus, traders are suggested to stay light.
IT
WIPRO (71.97%) corrected 4.69% series on series
and has added 74% of open interest. However, these
are mixed positions; but majority on short side. This
counter is now heavy in terms of open interest and we
expect a strong move in either direction. Thus, traders
are suggested to adopt ‘long strangle‘ strategy to
trade for near term.
INFY
(75.25%)
underperformed the overall
benchmark index last series. This counter is under
pressure from January series and has been attracting
huge shorts. It has an immediate support around
900-920 levels but looking at the quantum of shorts,
one shall wait for relevant short covering before
initiating longs.
TECHM (83.03%) corrected nearly 8% last series and
has attracted huge shorts in last two series. These
positions are still intact. Thus, one should avoid
bottom fishing unless we see some signs of reversal
Capital Goods & Infra
LT (65.08%) was the major gainer in this space and it
rallied more than 13%, but no major longs were seen
in this up move. In fact, this counter is hovering near
its resistance zone of Rs. 1765-Rs. 1775 levels and is
also light in terms of open interest. Thus, one should
avoid forming any longs unless we see meaningful
long formation.
IRB (93.29%) rallied nearly 8% with good amount of
long formation. Also, the stock has highest rollover in
this space, suggesting stock to remain optimistic in
near term.
Liquid counters like ENGINERSIN (65.08%), BHEL
(64.57%) and SIEMENS
(71.05%) witnessed a
massive rally in last series. However, these moves
were backed by short covering. While, rollovers of all
these counters are on the lower side.
For Private Circulation Only
SEBI Registration No: INB 010996539
3
Derivatives Rollover Report
Average
Price
OI
Rollover
Change
Change
Rollover
(3month)
Scrip
Price
(%)
OI Futures
(%)
COC (%)
PCR-OI
(%)
(%)
AUTO & AUTO ANCILLARIES
AMARAJABAT
887.60
1.27
2131800
16.15
6.87
0.96
74.85
74.70
APOLLOTYRE
249.35
19.19
13251000
(5.56)
6.57
0.40
82.70
89.39
ASHOKLEY
87.25
4.37
65464000
(21.36)
8.27
0.61
80.16
86.28
BAJAJ-AUTO
2880.70
1.57
943250
(40.50)
6.66
1.59
65.93
76.02
BHARATFORG
1141.35
10.39
3390600
(19.78)
7.52
0.55
63.28
79.95
BOSCHLTD
22595.05
(0.63)
96000
6.31
4.14
0.00
76.97
77.32
CASTROLIND
435.75
0.89
8694000
1.06
-4.92
0.40
91.34
90.65
CEATLTD
1514.25
14.52
1796900
(2.28)
-24.08
0.88
73.79
81.36
EICHERMOT
26102.60
1.31
135550
(26.14)
6.46
0.69
75.98
73.35
ESCORTS
550.30
-
1041700
-
9.54
0.24
83.51
-
EXIDEIND
229.00
3.50
15676000
(5.45)
8.02
0.50
88.07
89.95
HEROMOTOCO
3309.60
1.88
1064400
(29.19)
3.48
1.09
71.49
75.33
M&M
1342.45
4.27
4513500
(0.06)
5.12
0.45
75.84
70.97
MARUTI
6393.85
6.95
1878000
(21.76)
4.05
0.55
79.80
78.62
MOTHERSUMI
389.95
2.58
8215000
3.01
3.86
0.33
75.14
76.55
MRF
68517.00
14.23
52890
0.48
0.41
0.00
80.67
87.80
SUZLON
20.45
-
279810000
-
-3.18
0.40
92.44
-
TATAMOTORS
458.45
(2.31)
38115000
(5.20)
8.87
0.72
83.16
70.31
TATAMTRDVR
278.30
(1.85)
20094900
1.51
9.44
1.20
82.05
82.99
TVSMOTOR
489.15
12.79
6730000
60.16
-35.39
0.52
76.95
77.78
BANKING & FINANCIALS
ALBK
78.35
6.74
13900000
3.96
10.91
0.42
74.65
72.78
ANDHRABANK
66.15
13.86
19730000
(2.13)
11.93
0.33
76.06
63.08
AXISBANK
509.00
1.68
33024000
4.18
6.18
0.63
78.63
76.25
BAJFINANCE
1293.85
9.45
4128500
(3.27)
8.26
1.83
66.54
79.24
BANKBARODA
182.40
4.53
37730000
(29.66)
7.19
0.89
70.90
77.01
BANKINDIA
166.40
19.41
19734000
(19.45)
-88.37
0.88
54.67
82.92
BHARATFIN
798.15
(1.84)
20170000
12.81
9.87
0.44
92.21
84.96
CANBK
327.05
7.64
13671372
(8.92)
-8.71
0.72
69.19
86.86
CAPF
768.55
-
832800
-
8.28
0.05
81.52
-
DCBBANK
183.05
8.19
4248000
(3.97)
9.32
0.09
74.98
77.18
DHFL
426.15
16.15
22065000
13.40
9.86
1.05
84.36
88.75
EQUITAS
170.25
-
8636800
-
8.48
0.67
77.94
-
FEDERALBNK
94.95
4.17
53075000
(1.61)
8.29
0.49
90.27
83.37
HDFC
1574.80
3.33
6660000
(33.29)
6.91
0.36
59.46
66.49
HDFCBANK
1556.15
7.49
30150000
(4.34)
-10.35
0.55
72.64
73.25
IBULHSGFIN
1000.40
0.83
14631200
(24.76)
-5.19
0.85
82.85
85.13
ICICIBANK
274.95
(2.48)
71752500
5.20
3.80
0.87
73.92
70.78
For Private Circulation Only
SEBI Registration No: INB 010996539
4
Derivatives Rollover Report
Average
Price
OI
Rollover
Change
Change
Rollover
(3month)
Scrip
Price
(%)
OI Futures
(%)
COC (%)
PCR-OI
(%)
(%)
IDBI
75.15
0.13
40384000
5.25
6.10
0.72
74.49
83.13
IDFC
61.45
11.93
91014000
(8.29)
5.33
0.59
76.76
88.96
IDFCBANK
65.55
9.16
97232000
26.46
7.00
0.53
76.24
90.29
IFCI
29.40
(2.65)
78540000
31.01
13.44
0.50
85.14
82.22
INDIANB
316.45
-
1974000
-
9.13
0.47
79.92
-
INDUSINDBK
1476.15
3.57
6253200
(20.11)
4.88
0.45
68.18
69.76
KOTAKBANK
918.15
5.97
11188000
15.34
2.13
0.42
71.98
70.70
KTKBANK
155.95
10.49
28084000
0.47
8.84
0.52
79.87
83.56
L&TFH
128.40
3.42
21519000
2.44
8.69
0.48
80.59
79.67
LICHSGFIN
675.20
8.08
4643100
(8.08)
9.63
0.52
82.75
77.98
M&MFIN
333.90
5.53
13127500
(5.25)
7.46
0.31
68.89
75.63
MFSL
659.15
-
7164000
-
8.96
1.62
83.90
-
MUTHOOTFIN
402.85
-
1555500
-
7.98
0.39
78.92
-
ORIENTBANK
158.45
14.40
12348000
0.24
-34.44
0.61
63.17
84.98
PFC
158.90
10.73
29064000
(8.38)
7.43
0.68
80.61
74.07
PNB
160.65
7.53
46669000
(10.01)
-32.06
0.93
57.43
80.71
RECLTD
205.15
13.85
27528000
2.75
8.31
0.88
75.42
74.69
RELCAPITAL
674.55
10.18
13041000
16.11
9.15
0.72
87.07
87.10
SBIN
283.50
(2.76)
69837000
(4.23)
6.70
0.75
63.31
76.05
SOUTHBANK
24.80
21.57
103333638
27.84
10.60
0.34
89.88
90.01
SRTRANSFIN
1047.90
(0.76)
2307000
15.95
9.27
0.76
70.04
75.89
SYNDIBANK
76.65
7.65
16443000
25.05
11.15
0.34
78.45
77.21
UJJIVAN
391.60
-
4726800
-
-39.07
1.40
80.13
-
UNIONBANK
159.55
2.47
17528000
0.57
-1.22
0.66
73.29
79.22
CAPITAL GOODS & INFRASTRUCTURE
ADANIPORTS
324.65
(4.57)
14022500
9.06
8.69
0.66
74.41
77.44
BEML
1418.20
7.51
2628600
23.37
9.58
0.47
77.21
81.35
BHEL
177.20
7.00
24885000
(16.93)
7.40
0.35
64.57
74.51
ENGINERSIN
167.80
15.84
21616000
(17.43)
5.85
0.61
76.00
79.23
GMRINFRA
17.70
6.95
273240000
31.89
11.14
0.40
86.35
87.12
HAVELLS
479.50
2.21
4032000
(4.27)
5.46
0.40
68.02
77.42
IRB
256.65
7.75
21260000
31.80
11.27
0.37
93.29
88.59
JPASSOCIAT
13.70
(3.18)
160480000
6.31
14.43
0.63
89.70
88.33
LT
1772.50
13.39
5743000
(31.19)
4.24
1.02
65.08
73.37
RELINFRA
586.35
3.27
10650900
10.67
8.62
0.50
86.62
88.80
SIEMENS
1338.15
6.35
772000
(15.58)
7.59
0.51
71.05
79.24
VOLTAS
411.90
(1.02)
7278000
29.18
7.80
0.44
79.42
76.22
CEMENT
ACC
1644.75
15.28
1612800
(11.64)
6.97
1.59
72.56
79.82
AMBUJACEM
251.00
7.17
15125000
38.60
7.84
0.26
74.30
75.28
For Private Circulation Only
SEBI Registration No: INB 010996539
5
Derivatives Rollover Report
Average
Price
Rollover
Change
OI Change
Rollover
(3month)
Scrip
Price
(%)
OI Futures
(%)
COC (%)
PCR-OI
(%)
(%)
INDIACEM
213.30
31.91
20167000
(11.73)
8.61
0.72
79.43
85.46
SHREECEM
19457.30
-
22600
-
7.06
-
73.26
-
ULTRACEMCO
4249.00
6.31
1578400
(33.85)
3.66
0.75
66.34
76.84
CHEMICAL & FERTILIZERS
PIDILITIND
727.00
4.66
1860000
13.97
7.85
0.18
82.08
80.95
TATACHEM
658.45
10.32
3367500
(11.93)
9.47
0.42
84.75
83.88
UPL
821.40
14.62
8925600
77.43
4.62
0.74
58.65
81.81
CONSUMER GOODS & FMCG
ASIANPAINT
1110.30
3.31
3549000
(15.94)
5.84
0.87
76.98
80.73
BRITANNIA
3564.50
4.63
301200
(10.78)
3.47
0.89
85.62
68.89
COLPAL
1041.50
3.40
729400
(16.84)
7.68
0.08
76.06
77.72
DABUR
291.15
5.72
11012500
(7.61)
8.56
0.22
86.00
86.53
GODREJCP
1753.00
5.04
299200
(14.12)
3.28
0.33
67.75
64.30
HINDUNILVR
950.30
3.18
7094400
(0.31)
4.13
0.37
72.54
79.06
ITC
286.90
1.02
47066400
(7.63)
5.02
0.31
61.88
73.59
JUBLFOOD
1026.55
(7.87)
1659500
(9.83)
-3.92
0.88
59.55
69.83
MARICO
318.75
7.40
4994600
10.34
3.07
1.63
85.72
76.57
MCDOWELL-N
1859.90
(15.69)
3703750
4.27
6.27
0.29
73.04
91.10
TATAGLOBAL
153.05
1.39
31455000
(1.12)
8.14
0.38
91.43
92.66
TITAN
480.70
4.59
5464500
18.36
6.54
0.70
81.23
71.35
UBL
778.40
(0.80)
805000
(20.91)
0.75
0.22
67.41
74.41
INFORMATION TECHNOLOGY
HCLTECH
807.05
(7.38)
6541500
(21.88)
-4.27
0.93
55.84
79.71
HEXAWARE
231.20
5.23
3216000
(10.74)
2.83
0.49
75.18
81.57
INFY
928.15
(9.64)
29408000
(13.05)
4.09
0.48
75.25
73.11
KPIT
129.45
(1.45)
5104000
1.84
9.64
1.30
78.14
80.03
MINDTREE
492.40
8.59
2846400
(1.41)
5.45
0.44
76.47
83.54
OFSS
3577.75
(1.31)
207900
(13.32)
2.99
0.00
72.41
75.87
TATAELXSI
1536.40
3.45
1065600
(12.66)
9.10
0.27
77.78
80.83
TCS
2297.70
(6.25)
5144000
(19.63)
-2.80
0.67
57.67
71.54
TECHM
427.80
(7.59)
11704000
2.49
8.74
1.57
78.03
74.01
WIPRO
492.90
(4.69)
12172800
74.09
-8.28
0.47
71.97
75.93
MEDIA
DISHTV
95.20
(12.46)
25571000
(0.05)
6.19
0.45
74.90
83.78
PVR
1624.15
-
448000
-
10.07
0.07
88.12
-
SUNTV
930.25
17.42
7230000
5.12
9.03
0.42
85.70
85.30
TV18BRDCST
40.65
(4.13)
86275000
(4.14)
6.45
0.84
86.71
91.91
ZEEL
533.15
(0.36)
8088600
6.20
5.89
0.56
78.85
78.63
For Private Circulation Only
SEBI Registration No: INB 010996539
6
Derivatives Rollover Report
Average
Price
OI
Rollover
Change
Change
Rollover
(3month)
Scrip
Price
(%)
OI Futures
(%)
COC (%)
PCR-OI
(%)
(%)
METALS & MINING
COALINDIA
275.45
(5.46)
19696200
(3.29)
6.18
0.61
75.47
71.03
HINDALCO
195.85
2.27
28378000
(26.58)
6.69
0.65
80.98
82.10
HINDZINC
268.30
(6.78)
17126400
69.37
8.80
0.66
83.30
76.78
JINDALSTEL
114.40
(4.71)
36306000
12.81
7.45
0.46
88.89
84.53
JSWSTEEL
199.10
6.99
51357000
12.54
5.26
0.67
77.53
85.04
NMDC
127.00
(4.44)
31560000
14.42
7.74
0.92
80.51
80.08
SAIL
60.25
(1.87)
74688000
42.04
8.71
0.87
79.55
84.80
TATASTEEL
448.60
(6.62)
31610000
44.10
8.04
0.54
83.61
80.69
VEDL
235.00
(7.37)
53445000
41.08
6.41
0.42
80.06
77.22
MISCELLANIOUS
ABIRLANUVO
1667.65
8.25
3481200
7.10
11.71
0.64
82.00
90.29
ADANIENT
115.15
8.02
29544000
50.43
11.42
0.30
82.93
84.79
APOLLOHOSP
1253.70
7.72
2312800
52.84
8.69
0.59
84.45
83.47
BATAINDIA
587.45
2.82
4291100
2.52
6.47
0.14
79.05
84.27
BEL
180.70
16.92
22693500
(28.65)
8.35
0.45
80.44
86.24
CONCOR
1219.75
(3.90)
1047500
8.61
8.61
0.50
76.42
78.85
CUMMINSIND
1024.60
8.18
636000
2.32
9.74
0.56
77.09
77.91
GODREJIND
536.90
6.13
2353500
21.25
9.54
0.59
73.28
74.35
INDIGO
1125.95
-
1152000
-
7.45
0.15
85.52
-
INFIBEAM
1047.15
-
648400
-
-63.31
4.86
51.82
-
JETAIRWAYS
516.00
(3.64)
5080000
(10.96)
7.88
0.52
80.39
77.75
JISLJALEQS
113.95
21.55
35001000
(6.09)
10.96
0.25
88.01
86.22
JUSTDIAL
504.45
(7.41)
2923200
17.00
-3.48
0.31
68.74
74.31
KSCL
570.95
4.59
2449500
(15.04)
8.27
0.16
78.51
80.82
NIITTECH
464.65
10.28
489000
(17.47)
4.36
1.17
61.28
73.62
PCJEWELLER
426.60
1.75
1150500
33.62
9.85
1.40
75.42
70.57
RDEL
65.55
-
12402000
-
10.02
0.58
81.01
-
SINTEX
113.50
6.87
37627125
(0.71)
8.09
0.36
89.10
89.09
OIL & GAS
BPCL
739.35
14.65
9927600
(9.42)
5.93
0.65
82.79
77.91
GAIL
419.00
10.86
11536000
(26.94)
1.87
0.43
76.41
68.99
HINDPETRO
544.10
4.80
18711000
0.87
3.84
0.48
89.06
78.04
IGL
1057.55
4.68
2212100
(5.98)
1.30
0.88
64.25
78.77
IOC
442.40
17.89
15159000
(7.32)
-2.65
0.39
72.69
72.65
OIL
325.00
(1.05)
1636052
(15.26)
7.87
0.50
68.24
74.73
ONGC
179.85
(2.84)
49950000
3.95
5.46
0.56
78.43
75.80
PETRONET
433.30
7.60
5689500
44.39
9.55
0.50
89.37
81.13
RELIANCE
1406.00
10.34
13003000
(25.17)
-3.24
0.43
71.45
77.53
For Private Circulation Only
SEBI Registration No: INB 010996539
7
Derivatives Rollover Report
Average
Price
OI
Rollover
Change
Change
Rollover
(3month)
Scrip
Price
(%)
OI Futures
(%)
COC (%)
PCR-OI
(%)
(%)
PHARMACEUTICAL
AJANTPHARM
1653.35
(6.44)
532800
(7.88)
6.58
1.50
65.62
80.00
AUROPHARMA
610.75
(9.55)
15036000
4.05
7.95
0.70
77.63
83.21
BIOCON
1126.15
(1.70)
3171600
9.49
6.46
0.59
67.13
86.01
CADILAHC
445.95
(1.26)
2595200
(13.95)
6.61
0.80
72.06
81.12
CIPLA
563.65
(6.14)
7266000
14.30
4.53
0.77
72.70
80.54
DIVISLAB
633.10
1.01
9284400
(8.49)
7.14
0.58
75.24
83.57
DRREDDY
2606.35
(0.86)
2998600
(12.45)
4.92
0.76
73.56
78.23
GLENMARK
888.80
2.41
2718100
(24.59)
7.00
0.37
70.61
85.55
GRANULES
151.80
8.39
14220000
9.76
10.82
0.65
89.52
86.77
LUPIN
1345.55
(7.38)
7578800
(12.80)
9.12
1.04
62.84
77.90
STAR
1082.35
(2.62)
2217000
11.04
7.27
0.90
70.46
77.50
SUNPHARMA
639.45
(7.42)
27147400
(5.00)
5.01
1.04
76.82
81.73
TORNTPHARM
1419.90
(4.58)
202800
13.17
9.39
0.50
61.68
76.06
WOCKPHARMA
719.60
(1.65)
3154800
(0.23)
6.65
0.83
77.20
86.97
POWER
ADANIPOWER
33.05
(17.79)
112900000
(10.35)
13.95
0.78
82.35
90.73
CESC
935.80
10.61
7199500
65.57
8.91
0.59
87.34
86.40
CGPOWER
78.95
2.33
14268000
(18.73)
10.82
0.11
72.10
82.89
JSWENERGY
67.50
6.80
68792000
19.41
11.69
0.63
89.58
88.82
NHPC
31.55
(1.10)
18711000
(12.06)
12.51
0.43
73.80
72.17
NTPC
165.05
0.61
20052000
(16.04)
7.55
0.59
74.06
74.76
POWERGRID
208.70
6.15
28396000
(9.98)
5.96
0.33
67.62
77.50
PTC
94.35
2.22
14800000
(3.14)
9.04
0.97
81.32
83.91
RPOWER
49.15
2.08
63408000
13.93
9.35
0.60
89.15
89.97
TATAPOWER
84.85
(5.98)
30861000
8.89
3.08
0.91
79.12
83.89
TORNTPOWER
228.70
(1.10)
3717000
1.72
7.74
1.11
85.27
88.77
REAL ESTATE
DLF
190.75
26.74
29875000
(4.00)
6.52
0.80
80.06
79.56
HDIL
92.80
12.83
21536000
5.90
9.91
0.36
73.39
79.17
IBREALEST
157.55
79.24
15590000
(50.46)
10.43
0.86
75.02
88.15
NCC
95.35
17.35
25808000
(15.59)
8.25
0.19
81.34
82.82
PEL
2490.90
-
307500
-
8.11
0.29
71.03
-
TEXTILES
ARVIND
404.50
2.91
6670000
(1.94)
7.62
0.81
73.93
82.14
CENTURYTEX
1148.75
8.86
7923300
(0.85)
8.91
0.37
89.01
90.88
ICIL
204.30
3.60
10759000
15.22
6.73
0.20
89.39
86.93
PAGEIND
14329.20
(3.34)
26450
(16.43)
7.46
-
64.04
76.04
SRF
1807.40
11.93
714000
(11.03)
9.77
0.81
71.44
77.79
For Private Circulation Only
SEBI Registration No: INB 010996539
8
Derivatives Rollover Report
Research Team Tel: 022 - 39357800
DISCLAIMER
Angel Broking Private Limited (hereinafter referred to as “Angel”) is a registered Member of National Stock Exchange of India Limited, Bombay Stock
Exchange Limited and MCX Stock Exchange Limited. It is also registered as a Depository Participant with CDSL and Portfolio Manager with SEBI. It
also has registration with AMFI as a Mutual Fund Distributor. Angel Broking Private Limited is a registered entity with SEBI for Research Analyst in
terms of SEBI (Research Analyst) Regulations, 2014 vide registration number INH000000164. Angel or its associates has not been debarred/
suspended by SEBI or any other regulatory authority for accessing /dealing in securities Market. Angel or its associates including its relatives/analyst
do not hold any financial interest/beneficial ownership of more than 1% in the company covered by Analyst. Angel or its associates/analyst has not
received any compensation / managed or co-managed public offering of securities of the company covered by Analyst during the past twelve
months. Angel/analyst has not served as an officer, director or employee of company covered by Analyst and has not been engaged in market
making activity of the company covered by Analyst.
This document is solely for the personal information of the recipient, and must not be singularly used as the basis of any investment decision.
Nothing in this document should be construed as investment or financial advice. Each recipient of this document should make such investigations as
they deem necessary to arrive at an independent evaluation of an investment in the securities of the companies referred to in this document
(including the merits and risks involved), and should consult their own advisors to determine the merits and risks of such an investment.
Reports based on technical and derivative analysis center on studying charts of a stock's price movement, outstanding positions and trading volume,
as opposed to focusing on a company's fundamentals and, as such, may not match with a report on a company's fundamentals.
The information in this document has been printed on the basis of publicly available information, internal data and other reliable sources believed to
be true, but we do not represent that it is accurate or complete and it should not be relied on as such, as this document is for general guidance only.
Angel Broking Pvt. Limited or any of its affiliates/ group companies shall not be in any way responsible for any loss or damage that may arise to any
person from any inadvertent error in the information contained in this report. Angel Broking Pvt. Limited has not independently verified all the
information contained within this document. Accordingly, we cannot testify, nor make any representation or warranty, express or implied, to the
accuracy, contents or data contained within this document. While Angel Broking Pvt. Limited endeavors to update on a reasonable basis the
information discussed in this material, there may be regulatory, compliance, or other reasons that prevent us from doing so.
This document is being supplied to you solely for your information, and its contents, information or data may not be reproduced, redistributed or
passed on, directly or indirectly.
Neither Angel Broking Pvt. Limited, nor its directors, employees or affiliates shall be liable for any loss or damage that may arise from or in
connection with the use of this information.
Note: Please refer to the important ‘Stock Holding Disclosure' report on the Angel website (Research Section). Also, please refer to the latest update
on respective stocks for the disclosure status in respect of those stocks. Angel Broking Pvt. Limited and its affiliates may have investment positions in
the stocks recommended in this report.
Derivative Research Team
For Private Circulation Only
SEBI Registration No: INB 010996539
9