Market Outlook
September 20, 2017
Market Cues
Domestic Indices
Chg (%)
(Pts)
(Close)
Indian markets are likely to open flat tracking global indices and SGX Nifty.
BSE Sensex
(0.1)
(21)
32,402
US markets moved modestly higher over the course of the trading session on
Nifty
(0.1)
(6)
10,148
Tuesday. With the upward move on the day, all three of the major averages ended
Mid Cap
0.1
21
16,111
the session at record closing highs. The Dow Jones index rose 0.2 percent to
22,371, while Nasdaq edged up 0.1% to 6,461 and the S&P 500 inched up 0.1
Small Cap
0.4
60
16,894
percent to 2,507. The buying interest was somewhat subdued as traders seemed
Bankex
0.1
37
28,213
reluctant to make significant moves ahead of the Federal Reserve's monetary policy
announcement on Wednesday.
Global Indices
Chg (%)
(Pts)
(Close)
The UK markets edged higher on Tuesday as the pound pulled back from a 15-
Dow Jones
0.2
39
22,371
month high against the dollar, helping spur bargain hunting in shares of
Nasdaq
0.1
7
6,461
multinational companies on the benchmark index. The FTSE 100 rose 0.3% to 7,275
FTSE
0.3
22
7,275
on Tuesday, thanks to a relatively quiet day across European markets.
Nikkei
2.0
390
20,299
The NSE benchmark Nifty ended flat in a volatile session with negative bias, down
Hang Seng
(0.4)
(108)
28,051
5.55 points on selling mainly in PSU bank, metal, pharma and financial service.
Shanghai Com
(0.2)
(6)
3,357
Investors turned cautious ahead of the two-day US Federal Reserve monetary policy.
BSE Sensex closed lower by 21 points, to 32,402, while the Nifty 50 edged down 6
points, to close at 10,148.
Advances / Declines
BSE
NSE
Advances
1,293
839
News Analysis
Declines
1,336
846
India Inc charges up on battery manufacturing
Unchanged
157
84
Detailed analysis is on Pg2
#Volumes (` Cr)
Investor’s Ready Reckoner
BSE
4,285
Key Domestic & Global Indicators
NSE
28,632
Stock Watch: Latest investment recommendations on 150+ stocks
Refer Pg7 onwards
#Net Inflows (` Cr)
Net
Mtd
Ytd
Top Picks
FII
(79)
(2,423)
44,86
CMP
Target
Upside
Company
Sector
Rating
MFs
117
5,866
74,75
(`)
(`)
(%)
Blue Star
Capital Goods
Accumulate
783
807
3.1
Dewan Housing FinanceFinancials
Accumulate
609
610
0.1
Top Gainers
Price (`)
Chg (%)
Asian Granito
Others
Accumulate
492
495
0.6
Trent
312
7.4
Navkar Corporation
Others
Buy
193
265
37.1
Strtech
235
5.9
KEI Industries
Capital Goods
Accumulate
349
371
6.2
More Top Picks on Pg5
Fsl
44
5.4
Prestige
281
5.4
Key Upcoming Events
Previous
Consensus
Bomdyeing
193
5.0
Date
Region
Event Description
Reading
Expectations
Sep 20, 2017 US
FOMC rate decision
1.25
1.25
Top Losers
Price (`)
Chg (%)
Sep 20, 2017 US
Existing home sales
5.44
5.46
Sep 21, 2017 US
Initial Jobless claims
284.00
300.00
Rtnpower
6
(5.5)
Sep 21, 2017 Germany PMI Manufacturing
59.30
59.00
Religare
45
(5.0)
Sep 22, 2017 Euro Zone Euro-Zone Consumer Confidence
(1.50)
(1.50)
Jpassociat
18
(4.8)
More Events on Pg7
Sreinfra
108
(4.3)
Hathway
31
(3.3)
#as on 19th Sep, 2017
Market Outlook
September 20, 2017
News Analysis
India Inc charges up on battery manufacturing
Indian companies like Reliance Industries, JSW, Hero Motocorp, and Adani are
likely to invest in battery manufacturing with billons of dollar in investments over
the next decade or so factordaily.com.
As per the report on factordaily.com, Reliance Industries has aggressive plans to
establish a factory that would produce Lithium-Ion (Li-Ion) batteries of 25 gigawatt-
hours (GWh) capacity. Reliance industries has been in the energy business for long
and now has a telecom business and also selling mobile phones powered by Li-
Ion battery. Others companies like JSW, Adani, and Mahindra are also looking at
the battery pack business.
India has ambitions of being an all electric car nation by 2030 and international
players such as Suzuki Motor Corp. and Toshiba Corp. have already unveiled their
Li-Ion battery plans for India. As per the website JSW Energy is planning to set up
a battery factory as it will be a forward integration of its existing business of power
generation to distribution.
Last week, Suzuki announced of its plan to invest `1,150cr together with Japanese
partners Toshiba and Denso Corp. to set up a Lithium-Ion battery facility in
Gujarat. Suzuki will own 50%, Toshiba 40%, and Denso 10% of the joint venture
that will make batteries and battery packs for Indian car maker Maruti Suzuki and
export to Suzuki.
Economic and Political News
GST a tectonic shift, takes India closer to 8% plus growth: World Bank
`300,000cr road sector loans saved from turning NPAs: Nitin Gadkari
Petrol, diesel prices set to fall? Rates may come down by Diwali, says
Dharmendra Pradhan
Corporate News
Two Adani Power cos secure over 1/3rd of CIL coali
Car sales rev up on festive spirit, despite cess bump
NPA-laden state-run banks crimp advance tax mop-up at 10.6%
Market Outlook
September 20, 2017
Top Picks
Market Cap
CMP
Target
Upside
Company
Rationale
(` Cr)
(`)
(`)
(%)
Strong growth in domestic business due to its leadership
in acute therapeutic segment. Alkem expects to launch
Alkem Laboratories
21,251
1,777
2,161
21.6
more products in USA, which bodes for its international
business.
We expect the company would report strong profitability
Asian Granito
1,480
492
495
0.6
owing to better product mix, higher B2C sales and
amalgamation synergy.
Favorable outlook for the AC industry to augur well for
Cooling products business which is out pacing the
Blue Star
7,495
783
807
3.1
market growth. EMPPAC division's profitability to improve
once operating environment turns around.
With a focus on the low and medium income (LMI)
consumer segment, the company has increased its
Dewan Housing Finance
19,108
609
610
0.1
presence in tier-II & III cities where the growth
opportunity is immense.
Loan growth is likely to pick up after a sluggish FY17.
Karur Vysya Bank
9,569
158
180
13.7
Lower credit cost will help in strong bottom-line growth.
Increasing share of CASA will help in NIM improvement.
High order book execution in EPC segment, rising B2C
KEI Industries
2,719
349
371
6.2
sales and higher exports to boost the revenues and
profitability
Expected to benefit from the lower capex requirement
Music Broadcast
2,249
394
434
10.1
and 15 year long radio broadcast licensing.
Massive capacity expansion along with rail advantage at
Navkar Corporation
2,757
193
265
37.1
ICD as well CFS augurs well for the company
Strong brands and distribution network would boost
Siyaram Silk Mills
2,166
2,311
2,500
8.2
growth going ahead. Stock currently trades at an
inexpensive valuation.
Market leadership in Hindi news genre and no.
2
viewership ranking in English news genre, exit from the
TV Today Network
1,962
329
345
4.9
radio business, and anticipated growth in ad spends by
corporates to benefit the stock.
After GST, the company is expected to see higher
volumes along with improving product mix. The Gujarat
Maruti Suzuki
2,46,144
8,148
8,658
6.3
plant will also enable higher operating leverage which
will be margin accretive.
We expect loan book to grow at 24.3% over next two
GIC Housing
2,917
542
655
20.9
year; change in borrowing mix will help in NIM
improvement..
Source: Company, Angel Research
Market Outlook
September 20, 2017
Key Upcoming Events
Global economic events release calendar
Bloomberg Data
Date
Time
Country
Event Description
Unit
Period
Last Reported
Estimated
Sep 20, 2017
11:30 PMUS
FOMC rate decision
%
Sep 20
1.25
1.25
7:30 PMUS
Existing home sales
Million
Aug
5.44
5.46
Sep 21, 2017
6:00 PMUS
Initial Jobless claims
Thousands
Sep 16
284.00
300.00
1:00 PMGermany
PMI Manufacturing
Value
Sep P
59.30
59.00
Sep 22, 2017
7:30 PMEuro Zone
Euro-Zone Consumer Confidence
Value
Sep A
(1.50)
(1.50)
1:00 PMGermany
PMI Services
Value
Sep P
53.50
53.70
Sep 26, 2017
7:30 PMUS
Consumer Confidence
S.A./ 1985=100
Sep
122.90
119.25
7:30 PMUS
New home sales
Thousands
Aug
571.00
600.00
Sep 28, 2017
6:00 PMUS
GDP Qoq (Annualised)
% Change
2Q T
3.00
3.20
Sep 29, 2017
1:25 PMGermany
Unemployment change (000's)
Thousands
Sep
(5.00)
2:00 PMUK
GDP (YoY)
% Change
2Q F
1.70
Sep 30, 2017
6:30 AMChina
PMI Manufacturing
Value
Sep
51.70
Oct 02, 2017
2:00 PMUK
PMI Manufacturing
Value
Sep
56.90
Oct 04, 2017
2:30 PMIndia
RBI Reverse Repo rate
%
Oct 4
5.75
2:30 PMIndia
RBI Repo rate
%
Oct 4
6.00
6:00 PMUS
Change in Nonfarm payrolls
Thousands
Sep
156.00
Oct 06, 2017
2:30 PMIndia
RBI Cash Reserve ratio
%
Oct 4
4.00
6:00 PMUS
Unnemployment rate
%
Sep
4.40
Oct 10, 2017
India
Imports YoY%
% Change
Sep
21.00
India
Exports YoY%
% Change
Sep
10.30
2:00 PMUK
Industrial Production (YoY)
% Change
Aug
0.40
Oct 12, 2017
US
Producer Price Index (mom)
% Change
Sep
0.50
5:30 PMIndia
Industrial Production YoY
% Change
Aug
1.20
Oct 13, 2017
6:00 PMUS
Consumer price index (mom)
% Change
Sep
0.40
Source: Bloomberg, Angel Research
Market Outlook
September 20, 2017
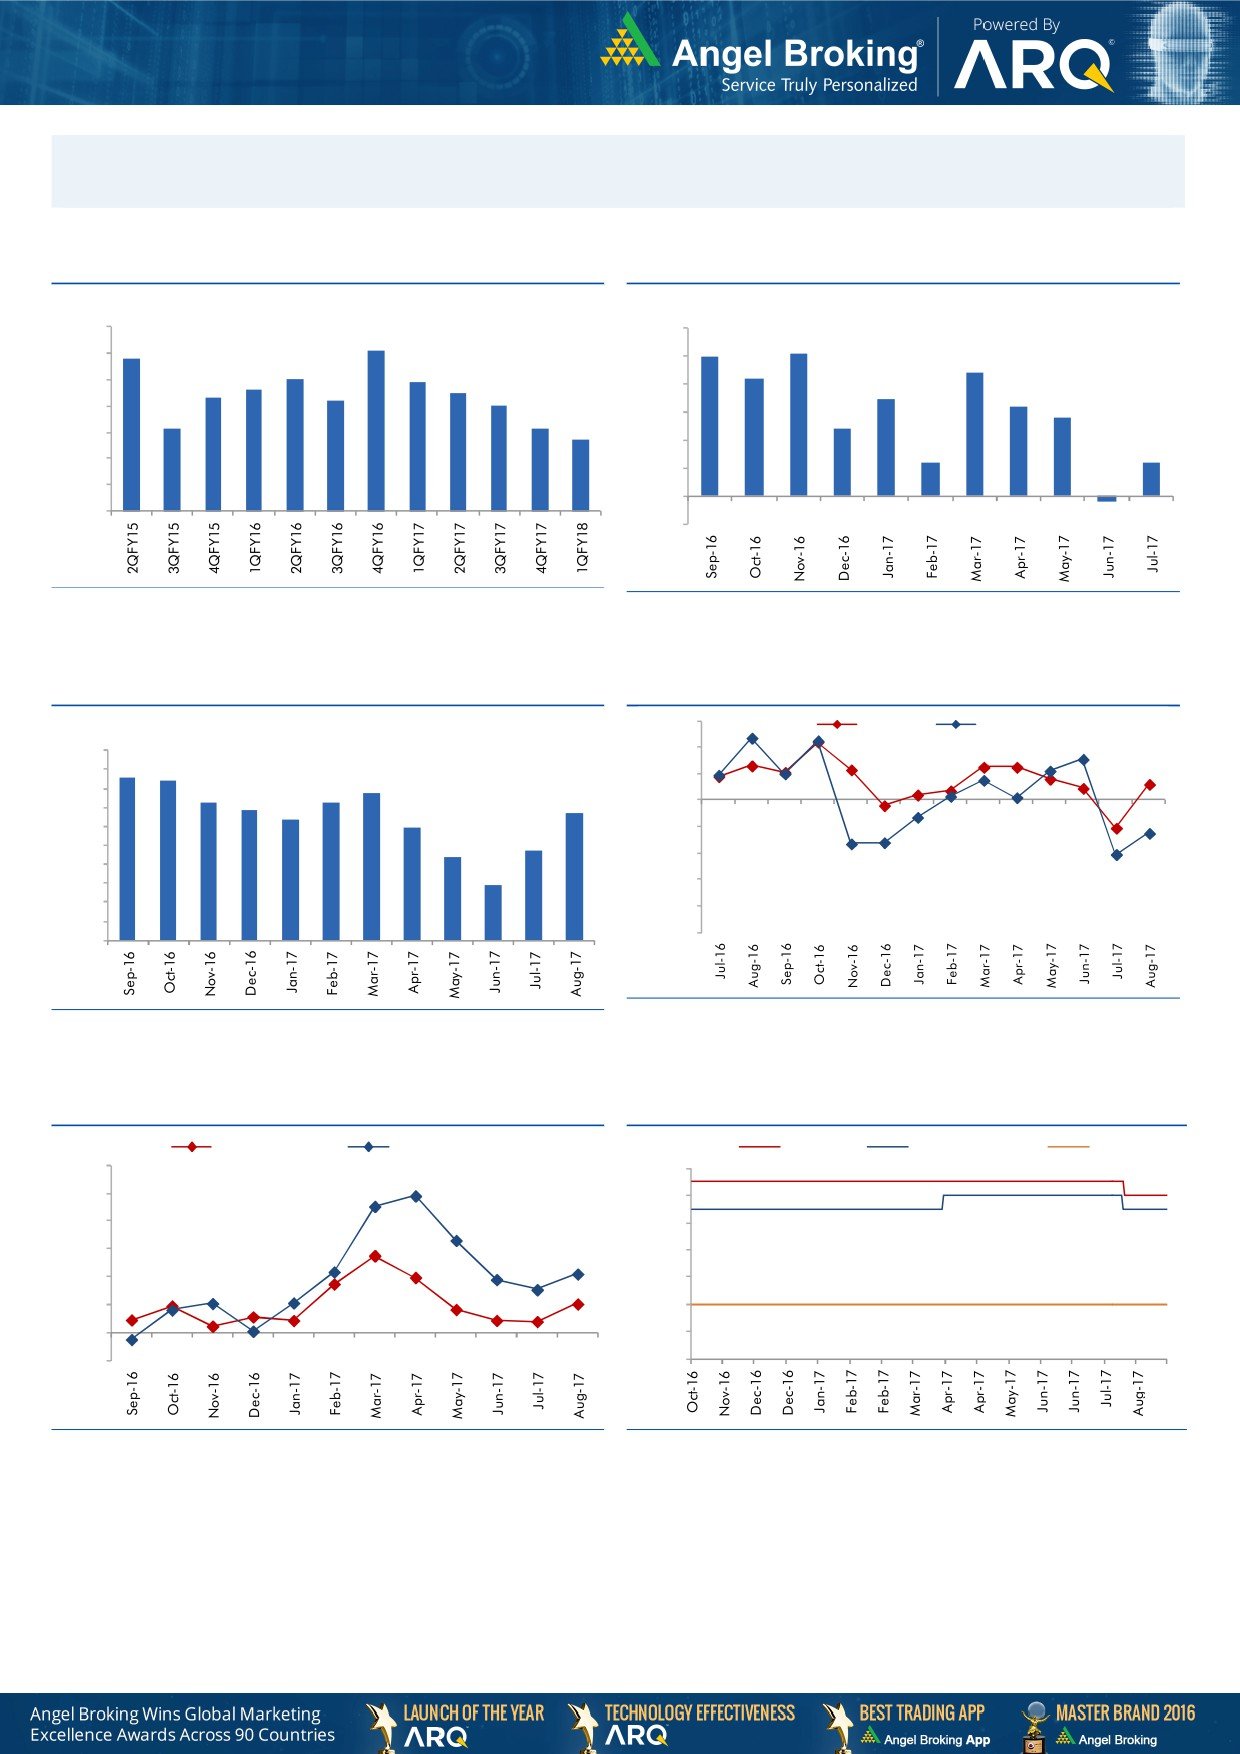
Macro watch
Exhibit 1: Quarterly GDP trends
Exhibit 2: IIP trends
(%)
(%)
10.0
6.0
9.1
5.1
8.8
5.0
9.0
5.0
4.4
8.0
7.9
4.2
7.6
7.5
8.0
7.3
3.5
7.2
7.0
4.0
3.2
2.8
7.0
6.1
6.1
3.0
2.4
5.7
6.0
2.0
1.2
1.2
5.0
1.0
4.0
-
3.0
(1.0)
(0.2)
Source: CSO, Angel Research
Source: MOSPI, Angel Research
Exhibit 3: Monthly CPI inflation trends
Exhibit 4: Manufacturing and services PMI
56.0
Mfg. PMI
Services PMI
(%)
5.0
54.0
4.3
4.2
4.5
3.9
52.0
4.0
3.6
3.7
3.4
3.4
3.2
50.0
3.5
3.0
3.0
48.0
2.4
2.2
2.5
46.0
2.0
1.5
1.5
44.0
1.0
42.0
0.5
40.0
-
Source: Market, Angel Research; Note: Level above 50 indicates expansion
Source: MOSPI, Angel Research
Exhibit 5: Exports and imports growth trends
Exhibit 6: Key policy rates
(%)
Exports yoy growth
Imports yoy growth
(%)
Repo rate
Reverse Repo rate
CRR
60.0
6.50
50.0
6.00
40.0
5.50
30.0
5.00
20.0
4.50
10.0
4.00
0.0
3.50
(10.0)
3.00
Source: Bloomberg, Angel Research
Source: RBI, Angel Research
Market Outlook
September 20, 2017
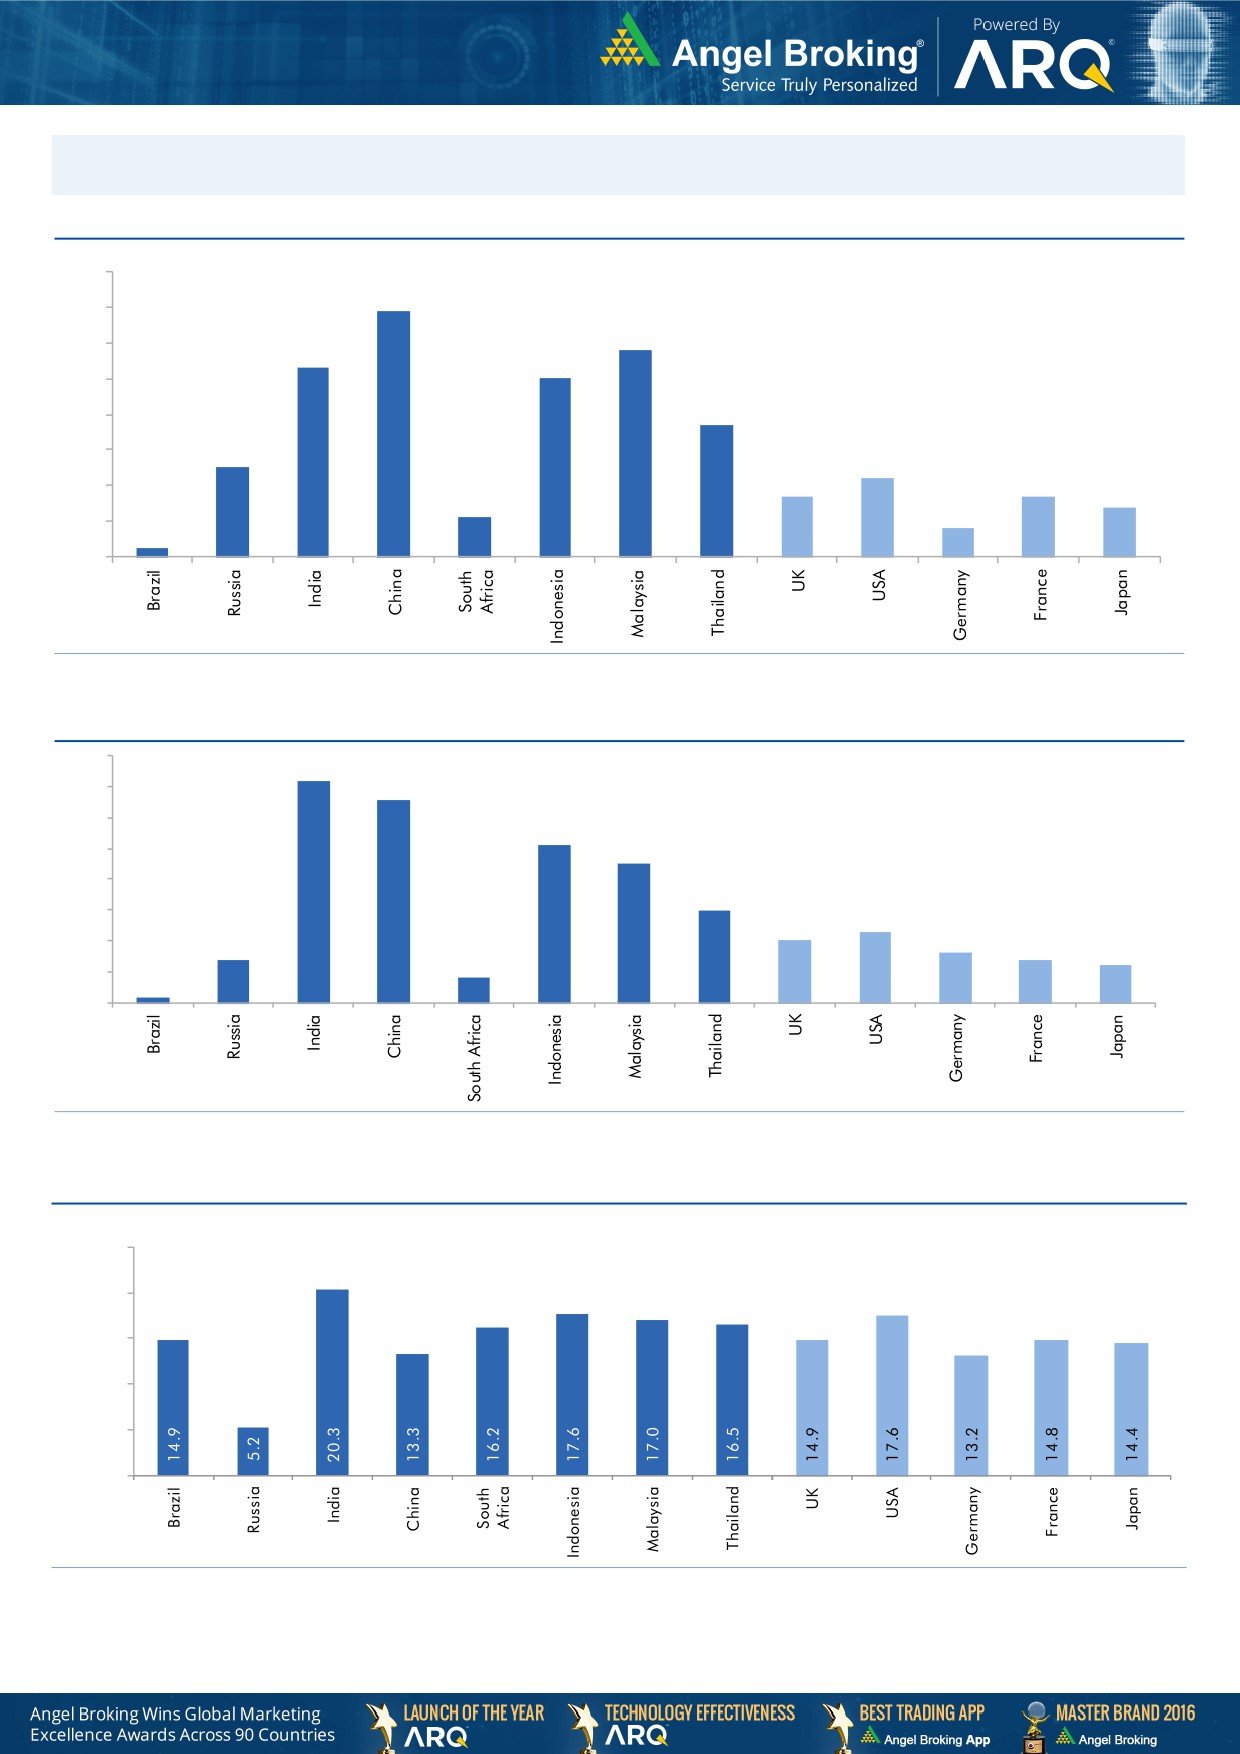
Global watch
Exhibit 1: Latest quarterly GDP Growth (%, yoy) across select developing and developed countries
(%)
8.0
6.9
7.0
5.8
6.0
5.3
5.0
5.0
1.1
3.7
4.0
2.5
3.0
2.2
1.7
1.7
2.0
1.4
0.8
1.0
0.3
-
Source: Bloomberg, Angel Research
Exhibit 2: 2017 GDP Growth projection by IMF (%, yoy) across select developing and developed countries
(%)
7.2
6.6
7.0
6.0
5.1
5.0
4.5
4.0
3.0
3.0
2.3
2.0
1.4
1.6
2.0
1.4
1.2
0.2
0.8
1.0
-
Source: IMF, Angel Research
Exhibit 3: One year forward P-E ratio across select developing and developed countries
(x)
25.0
20.0
15.0
10.0
5.0
-
Source: IMF, Angel Research, Data as on19th September 2017
Market Outlook
September 20, 2017
Exhibit 4: Relative performance of indices across globe
Returns (%)
Country
Name of index
Closing price
1M
3M
1YR
Brazil
Bovespa
75,990
10.8
22.5
33.2
Russia
Micex
2,059
6.3
10.9
2.7
India
Nifty
10,153
2.5
5.8
16.1
China
Shanghai Composite
3,363
2.7
6.4
8.6
South Africa
Top 40
49,737
1.5
10.4
9.3
Mexico
Mexbol
50,258
(1.4)
2.5
8.5
Indonesia
LQ45
980
0.0
3.4
6.9
Malaysia
KLCI
1,784
0.7
(0.0)
5.6
Thailand
SET 50
1,074
7.9
8.4
16.3
USA
Dow Jones
22,331
1.4
4.4
23.2
UK
FTSE
7,253
(2.4)
(3.6)
6.2
Japan
Nikkei
19,910
0.9
0.4
17.4
Germany
DAX
12,559
3.1
(1.8)
18.1
France
CAC
5,229
2.3
(0.8)
19.0
Source: Bloomberg, Angel Research, Data as on19th September 2017
Stock Watch
September 20, 2017
Company Name
Reco
CMP
Target
Mkt Cap
Sales ( Čcr )
OPM(%)
EPS (Č)
PER(x)
P/BV(x)
RoE(%)
EV/Sales(x)
(Č)
Price ( Č)
( Č cr )
FY18E FY19E
FY18E
FY19E
FY18E
FY19E
FY18E
FY19E
FY18E
FY19E
FY18E
FY19E
FY18E
FY19E
Agri / Agri Chemical
Rallis
Reduce
226
209
4,389
1,873
2,099
15.0
15.0
9.5
10.5
23.8
21.5
3.6
3.3
15.8
16.0
2.2
2.0
United Phosphorus
Neutral
835
-
42,436
18,922
21,949
18.0
18.5
36.2
45.6
23.1
18.3
4.8
4.0
22.7
23.8
2.4
2.0
Auto & Auto Ancillary
Ashok Leyland
Accumulate
118
127
34,577
23,339
27,240
10.1
10.8
4.7
6.2
25.4
19.0
5.1
4.5
20.0
23.6
1.4
1.2
Bajaj Auto
Neutral
3,116
-
90,155
23,936
27,955
19.5
20.1
142.7
167.3
21.8
18.6
4.8
4.3
21.8
22.8
3.4
2.8
Bharat Forge
Neutral
1,268
-
29,517
7,637
8,755
21.7
23.2
36.1
47.3
35.1
26.8
6.3
5.4
18.5
20.8
3.7
3.2
Eicher Motors
Neutral
32,404
-
88,212
19,043
22,837
19.5
19.9
835.4
1,019.0
38.8
31.8
14.5
11.2
40.9
37.8
4.5
3.7
Gabriel India
Neutral
212
-
3,047
1,782
2,033
9.7
10.2
7.1
8.9
29.9
24.0
6.0
5.1
21.0
22.2
1.7
1.4
Hero Motocorp
Neutral
3,949
-
78,852
32,239
36,878
16.0
15.6
184.4
206.5
21.4
19.1
6.7
5.9
31.3
30.7
2.2
1.9
Jamna Auto Industries Neutral
258
-
2,058
1,441
1,662
14.4
14.8
13.9
17.6
18.6
14.7
5.1
4.1
30.0
31.0
1.4
1.2
Mahindra and Mahindra Neutral
1,294
-
80,372
46,971
53,816
13.6
14.0
67.7
79.8
19.1
16.2
2.7
2.4
15.0
15.9
1.6
1.3
Maruti
Accumulate
8,148
8,658
246,144
81,825
101,245
15.0
15.0
283.5
356.0
28.7
22.9
6.3
5.1
21.9
22.4
2.7
2.1
Minda Industries
Neutral
863
-
7,458
4,328
5,084
11.0
11.9
27.3
36.4
31.7
23.7
6.7
5.3
23.1
25.6
1.8
1.5
Motherson Sumi
Neutral
342
-
71,891
55,937
64,445
10.8
11.4
16.9
21.1
20.2
16.2
4.5
4.6
25.2
25.4
1.3
1.1
Tata Motors
Neutral
424
-
122,395
303,167
343,649
11.8
13.8
33.1
54.7
12.8
7.8
2.1
1.7
16.9
23.0
0.5
0.4
TVS Motor
Neutral
659
-
31,325
13,992
16,216
9.0
9.4
17.1
20.3
38.7
32.5
10.3
7.9
29.7
27.7
2.2
1.8
Amara Raja Batteries
Accumulate
780
858
13,317
6,140
7,122
14.3
15.6
29.3
39.0
26.6
20.0
4.5
3.8
17.1
19.0
2.2
1.9
Exide Industries
Neutral
226
-
19,244
8,689
9,854
15.1
15.2
9.7
11.0
23.5
20.6
4.2
3.7
15.7
16.1
2.0
1.7
Apollo Tyres
Neutral
259
-
13,163
15,739
17,326
13.3
14.6
20.4
26.7
12.7
9.7
1.5
1.4
20.4
26.7
1.1
1.0
Ceat
Neutral
1,780
-
7,199
6,661
7,717
11.1
14.2
116.2
178.2
15.3
10.0
2.7
2.2
15.2
21.3
1.2
1.0
JK Tyres
Neutral
148
-
3,350
8,318
9,239
16.2
16.4
21.0
27.5
7.1
5.4
1.4
1.1
19.1
20.4
0.9
0.7
Swaraj Engines
Neutral
2,033
-
2,525
788
889
16.4
16.5
71.6
81.0
28.4
25.1
8.2
7.6
29.6
31.0
2.9
2.5
Subros
Neutral
253
-
1,520
1,855
2,135
11.6
11.8
10.3
14.7
24.7
17.3
3.8
3.2
15.8
19.1
1.0
0.9
Capital Goods
BEML
Neutral
1,933
-
8,050
4,286
5,194
7.1
8.2
42.9
58.1
45.1
33.3
3.7
3.4
7.6
8.7
1.9
1.6
Bharat Electronics
Neutral
191
-
42,629
10,258
12,470
19.6
19.5
7.3
8.6
26.1
22.2
0.5
0.5
20.4
21.9
3.6
3.0
Voltas
Neutral
548
-
18,131
6,778
8,004
9.6
11.0
17.1
22.4
32.0
24.5
7.6
6.7
17.7
19.8
2.4
2.0
BHEL
Neutral
135
-
32,945
33,200
39,167
6.8
9.5
6.2
11.2
21.7
12.0
1.0
1.0
4.6
8.0
0.6
0.4
Blue Star
Accumulate
783
850
7,495
5,101
5,997
6.0
7.0
17.9
26.6
43.7
29.4
9.3
8.5
21.9
29.0
1.5
1.3
CG Power and Industrial
Neutral
82
-
5,133
6,555
7,292
7.5
7.5
-
0.8
8,190.0
102.4
1.3
1.3
0.1
1.2
0.9
0.8
Solutions
Greaves Cotton
Neutral
141
-
3,446
1,778
1,993
14.7
15.1
8.1
9.1
17.4
15.5
3.9
3.7
21.8
23.6
1.7
1.5
Stock Watch
September 20, 2017
Company Name
Reco
CMP
Target
Mkt Cap
Sales ( Čcr )
OPM(%)
EPS (Č)
PER(x)
P/BV(x)
RoE(%)
EV/Sales(x)
(Č)
Price ( Č)
( Č cr )
FY18E FY19E
FY18E
FY19E
FY18E
FY19E
FY18E
FY19E
FY18E
FY19E
FY18E
FY19E
FY18E
FY19E
Capital Goods
KEC International
Accumulate
314
350
8,064
9,779
11,113
9.4
9.8
14.2
18.2
22.1
17.2
4.2
3.5
21.1
22.1
1.1
1.0
KEI Industries
Accumulate
349
371
2,719
3,001
3,391
10.0
10.0
13.0
16.1
26.9
21.7
4.9
4.1
18.2
18.7
1.1
1.0
Thermax
Neutral
935
-
11,142
4,125
4,747
10.3
10.8
26.7
31.5
35.0
29.7
3.9
3.6
11.2
12.0
2.4
2.1
VATech Wabag
Accumulate
641
681
3,502
3,867
4,126
9.6
10.0
34.9
39.8
18.4
16.1
3.0
2.6
17.7
17.5
0.9
0.8
Cement
ACC
Neutral
1,816
-
34,109
12,255
13,350
13.5
14.3
58.0
66.2
31.3
27.4
3.7
3.5
11.5
12.2
2.8
2.5
Ambuja Cements
Neutral
284
-
56,432
10,250
11,450
17.5
19.0
7.2
8.3
39.5
34.2
2.8
2.7
7.0
7.8
5.3
4.7
India Cements
Neutral
190
-
5,858
6,135
6,750
14.8
15.2
8.5
11.5
22.4
16.5
1.1
1.1
4.8
6.2
1.3
1.1
JK Cement
Neutral
1,022
-
7,147
4,150
4,775
19.2
20.0
49.0
63.5
20.9
16.1
3.3
2.8
17.0
18.5
2.2
1.8
J K Lakshmi Cement
Neutral
419
-
4,932
3,422
3,757
15.5
17.0
13.5
23.2
31.1
18.1
3.2
2.8
10.8
15.5
1.8
1.6
Orient Cement
Neutral
164
-
3,355
2,215
3,233
16.8
17.0
5.9
6.9
27.8
23.7
2.1
2.0
10.8
10.1
2.5
1.7
UltraTech Cement
Neutral
4,187
-
114,946
28,250
35,150
20.2
23.5
77.5
122.2
54.0
34.3
4.6
4.1
9.6
14.8
4.5
3.6
Construction
KNR Constructions
Neutral
207
-
2,905
1,846
2,203
14.5
14.5
12.1
13.7
17.1
15.1
0.9
0.8
17.5
16.7
1.6
1.3
Larsen & Toubro
Neutral
1,226
-
171,763
95,787
109,476
10.2
11.6
44.5
50.8
27.6
24.2
3.5
3.2
12.9
13.1
2.3
2.1
Gujarat Pipavav Port
Neutral
146
-
7,068
739
842
61.6
62.7
5.1
6.2
28.7
23.8
3.6
3.5
12.7
14.9
9.0
7.8
PNC Infratech
Accumulate
133
143
3,416
2,040
2,935
13.0
13.0
6.4
9.0
20.8
14.8
0.5
0.5
9.7
12.2
1.7
1.2
Simplex Infra
Neutral
485
-
2,402
6,012
6,619
11.6
11.7
21.1
31.0
23.1
15.7
1.6
1.5
6.5
8.6
0.9
0.8
Sadbhav Engineering
Neutral
290
-
4,971
3,823
4,426
10.7
10.8
10.3
11.8
28.1
24.6
3.4
3.0
10.1
10.5
1.6
1.4
NBCC
Neutral
215
-
19,350
9,099
12,706
6.4
6.4
7.3
9.6
29.5
22.5
1.3
1.0
27.5
30.5
2.0
1.4
MEP Infra
Neutral
117
-
1,901
2,403
2,910
18.3
16.8
2.4
6.1
49.7
19.3
18.9
12.7
35.2
55.8
1.9
1.6
SIPL
Neutral
98
-
3,445
2,060
2,390
46.8
47.7
(5.8)
(3.1)
3.7
4.2
(14.2)
(2.3)
6.4
6.0
Engineers India
Neutral
157
-
10,600
1,795
2,611
21.1
22.4
5.9
8.1
26.7
19.4
1.9
1.8
12.9
16.1
4.3
2.8
Financials
Axis Bank
Accumulate
521
580
124,879
32,558
35,843
3.5
3.2
27.8
41.0
18.7
12.7
2.0
1.8
11.4
14.9
-
-
Bank of Baroda
Neutral
144
-
33,249
22,533
26,079
2.4
2.4
12.0
20.9
12.0
6.9
0.8
0.7
6.6
11.0
-
-
Canara Bank
Neutral
343
-
20,469
17,925
20,235
2.0
2.1
18.5
36.5
18.5
9.4
0.7
0.7
3.4
6.2
-
-
Can Fin Homes
Neutral
2,879
-
7,665
586
741
3.5
3.5
107.8
141.0
26.7
20.4
5.9
4.7
24.1
25.6
-
-
Cholamandalam Inv. &
Accumulate
1,165
1,230
18,212
2,826
3,307
6.3
6.3
53.7
64.6
21.7
18.1
3.7
3.2
18.3
18.9
-
-
Fin. Co.
Dewan Housing Finance Neutral
609
-
19,108
2,676
3,383
2.4
2.7
37.4
49.7
16.3
12.3
2.1
1.9
13.8
16.2
-
-
Equitas Holdings
Buy
163
235
5,521
1,125
1,380
9.6
9.8
1.5
6.0
108.6
27.2
2.5
2.3
2.4
8.2
-
-
Federal Bank
Neutral
119
-
23,201
4,896
5,930
2.8
3.1
5.4
7.6
22.2
15.7
1.9
1.7
8.5
11.0
-
-
Stock Watch
September 20, 2017
Company Name
Reco
CMP
Target
Mkt Cap
Sales ( Čcr )
OPM(%)
EPS (Č)
PER(x)
P/BV(x)
RoE(%)
EV/Sales(x)
(Č)
Price ( Č)
( Č cr )
FY18E FY19E
FY18E
FY19E
FY18E
FY19E
FY18E
FY19E
FY18E
FY19E
FY18E
FY19E
FY18E
FY19E
Financials
GIC Housing
Buy
542
655
2,917
376
477
3.6
3.7
33.0
40.0
16.4
13.5
2.9
2.5
20.0
23.0
-
-
HDFC Bank
Neutral
1,852
-
477,958
55,236
63,253
4.5
4.4
68.9
82.4
26.9
22.5
4.7
3.9
18.7
18.5
-
-
ICICI Bank
Accumulate
294
315
188,859
42,361
51,378
3.6
3.9
18.4
25.7
16.0
11.4
1.7
1.7
11.3
15.0
-
-
Karur Vysya Bank
Accumulate
158
180
9,569
3,289
3,630
3.7
3.9
10.8
14.1
14.6
11.3
1.8
1.6
12.5
14.7
-
-
LIC Housing Finance
Neutral
650
-
32,803
4,895
6,332
3.4
3.7
50.7
66.8
12.8
9.7
2.6
2.1
21.7
23.8
-
-
Punjab Natl.Bank
Neutral
144
-
30,664
23,708
25,758
2.1
2.1
5.9
16.4
24.5
8.8
0.7
0.7
3.0
8.3
-
-
RBL Bank
Neutral
535
-
22,107
2,309
2,888
2.6
2.5
16.4
19.1
32.7
28.1
4.1
3.7
13.3
13.8
-
-
Repco Home Finance
Buy
648
825
4,052
496
597
4.4
4.2
38.5
48.7
16.8
13.3
3.0
2.5
19.6
20.6
-
-
South Ind.Bank
Neutral
29
-
5,251
3,195
3,567
3.0
3.1
3.0
3.8
9.6
7.6
1.0
0.9
10.5
11.9
-
-
St Bk of India
Neutral
268
-
231,166
105,827
121,056
2.4
2.5
16.1
25.6
16.6
10.5
1.3
1.2
6.6
9.9
-
-
Union Bank
Neutral
137
-
9,948
14,650
16,225
2.3
2.3
23.1
32.5
5.9
4.2
0.5
0.4
7.1
9.2
-
-
Yes Bank
Neutral
1,864
-
85,367
11,088
13,138
3.0
2.9
84.0
99.3
22.2
18.8
3.4
3.0
16.3
16.8
-
-
FMCG
Akzo Nobel India
Neutral
1,858
-
8,912
3,164
3,607
13.8
13.7
58.6
67.9
31.7
27.4
7.8
6.9
24.5
25.1
2.7
2.3
Asian Paints
Neutral
1,253
-
120,192
17,603
20,615
18.6
18.6
2,128.9
2,543.3
0.6
0.5
12.4
10.4
28.0
28.9
6.6
5.6
Britannia
Neutral
4,363
-
52,386
9,690
11,278
14.8
15.4
84.0
101.0
51.9
43.2
18.9
15.0
40.6
39.0
5.4
4.6
Colgate
Neutral
1,144
-
31,111
4,420
5,074
24.9
25.3
28.6
32.8
40.0
34.9
15.8
12.7
43.8
40.5
6.8
5.9
Dabur India
Neutral
315
-
55,417
8,346
9,344
19.6
19.9
7.8
9.0
40.3
35.0
8.1
7.4
25.2
24.8
6.2
5.5
GlaxoSmith Con*
Neutral
5,019
-
21,107
5,072
5,760
18.2
18.4
176.3
199.2
28.5
25.2
6.0
5.5
21.2
21.7
3.5
3.0
Godrej Consumer
Neutral
955
-
65,050
10,171
11,682
20.8
21.5
21.7
27.1
44.0
35.2
9.9
8.5
22.3
23.4
6.5
5.6
HUL
Neutral
1,280
-
277,032
37,077
41,508
20.3
21.8
5,189.9
6,318.5
0.3
0.2
39.0
33.3
74.8
82.0
7.3
6.5
ITC
Neutral
268
-
326,189
44,588
49,853
37.0
37.3
9.6
11.0
27.9
24.4
6.8
6.5
25.1
27.3
6.8
6.0
Marico
Neutral
332
-
42,792
6,788
7,766
18.5
19.2
7.1
8.5
46.7
39.0
16.3
14.0
36.9
38.0
6.1
5.4
Nestle*
Neutral
7,272
-
70,114
10,083
11,182
20.0
20.9
119.7
141.3
60.8
51.5
214.1
195.7
36.7
39.8
6.6
5.9
Tata Global
Neutral
216
-
13,645
7,121
7,641
11.9
12.3
6.9
8.0
31.3
27.0
2.1
2.0
6.8
7.2
1.7
1.6
Procter & Gamble
Neutral
8,400
-
27,267
3,034
3,579
27.1
27.7
167.7
198.8
50.1
42.3
13.4
11.6
28.8
29.5
8.4
7.0
Hygiene
IT
HCL Tech^
Accumulate
894
1,014
127,558
52,342
57,053
20.9
20.9
62.8
67.6
14.2
13.2
3.2
2.7
22.4
20.6
2.1
1.8
Infosys
Buy
911
1,179
209,323
73,963
80,619
26.0
26.0
64.4
69.3
14.2
13.2
2.8
2.6
19.7
19.6
2.3
2.0
TCS
Accumulate
2,498
2,651
492,272
127,403
138,870
27.6
27.6
144.5
156.0
17.3
16.0
5.1
4.8
29.7
29.8
3.5
3.2
Tech Mahindra
Buy
446
533
43,564
31,015
33,496
15.0
15.0
35.6
38.1
12.5
11.7
2.1
2.0
17.0
16.3
1.2
1.0
Stock Watch
September 20, 2017
Company Name
Reco
CMP
Target
Mkt Cap
Sales ( Čcr )
OPM(%)
EPS (Č)
PER(x)
P/BV(x)
RoE(%)
EV/Sales(x)
(Č)
Price ( Č)
( Č cr )
FY18E FY19E
FY18E
FY19E
FY18E
FY19E
FY18E
FY19E
FY18E
FY19E
FY18E
FY19E
FY18E
FY19E
IT
Wipro
Neutral
289
-
140,599
58,536
61,858
20.3
20.3
18.2
19.1
15.9
15.1
2.5
2.1
14.6
13.4
2.3
2.2
Media
D B Corp
Neutral
374
-
6,873
2,404
2,625
30.5
31.5
23.7
26.9
15.8
13.9
3.7
3.2
23.5
22.8
2.7
2.5
HT Media
Neutral
105
-
2,451
2,589
2,830
15.1
15.4
8.3
10.9
12.7
9.7
1.0
0.9
8.4
10.4
0.5
0.4
Jagran Prakashan
Buy
183
225
5,991
2,541
2,835
28.5
28.7
12.7
14.1
14.4
13.0
3.0
2.6
21.3
21.4
2.2
1.9
Sun TV Network
Neutral
851
-
33,539
3,238
3,789
51.9
55.1
30.9
38.0
27.5
22.4
7.9
6.9
30.0
31.0
9.9
8.3
Hindustan Media
Neutral
268
-
1,967
1,002
1,074
23.3
23.5
29.2
33.8
9.2
7.9
1.4
1.2
15.6
15.4
1.0
0.7
Ventures
TV Today Network
Neutral
329
-
1,962
667
727
27.7
27.7
18.6
20.1
17.7
16.4
2.8
2.8
15.6
17.3
2.5
2.3
Music Broadcast Limited Accumulate
394
434
2,249
271
317
91.0
109.0
6.0
10.0
65.7
39.4
4.1
3.7
6.5
9.3
7.9
6.5
Metals & Mining
Coal India
Neutral
258
-
160,275
82,301
91,235
17.0
18.0
17.1
20.5
15.1
12.6
2.8
2.7
45.0
55.0
1.6
1.4
Hind. Zinc
Neutral
308
-
130,182
22,108
24,555
57.0
58.0
22.1
26.3
13.9
11.7
4.5
3.7
32.0
35.0
4.9
4.1
Hindalco
Neutral
247
-
55,339
102,350
105,355
13.5
14.5
21.5
24.5
11.5
10.1
1.6
1.3
15.0
15.2
1.1
1.1
JSW Steel
Neutral
262
-
63,259
64,500
68,245
21.1
21.5
20.1
21.2
13.0
12.3
2.4
2.0
-
-
1.7
1.6
NMDC
Neutral
133
-
41,985
10,209
11,450
47.0
48.0
11.1
12.1
12.0
11.0
1.7
1.6
-
-
3.6
3.3
SAIL
Neutral
63
-
25,813
54,100
63,555
3.0
10.0
(10.0)
1.5
41.7
0.8
0.8
-
-
1.5
1.3
Vedanta
Neutral
323
-
120,158
81,206
87,345
28.0
29.0
26.5
33.5
12.2
9.7
2.8
2.4
-
-
2.2
1.9
Tata Steel
Neutral
677
-
65,708
121,445
126,500
16.2
17.2
65.4
81.3
10.3
8.3
1.6
1.4
-
-
1.1
0.9
Oil & Gas
GAIL
Neutral
420
-
71,060
53,115
52,344
14.2
15.3
30.0
31.1
14.0
13.5
1.8
1.6
-
-
1.1
1.0
ONGC
Neutral
166
-
212,968
83,111
84,934
44.2
44.9
16.4
16.9
10.1
9.8
1.2
1.1
-
-
2.4
2.4
Indian Oil Corp
Neutral
418
-
203,123
396,116
432,560
8.5
8.8
40.1
42.2
10.4
9.9
1.8
1.6
-
-
0.7
0.6
Reliance Industries
Neutral
840
-
546,319
257,711
267,438
17.0
18.2
89.1
89.5
9.4
9.4
0.9
0.8
-
-
1.8
1.7
Pharmaceuticals
Alembic Pharma
Buy
484
600
9,130
3,903
4,584
18.2
19.2
21.8
27.2
22.2
17.8
4.0
3.4
19.8
20.6
2.4
2.0
Alkem Laboratories Ltd
Buy
1,777
2,161
21,251
6,901
7,850
18.4
19.1
85.0
100.5
20.9
17.7
4.2
3.6
20.2
20.1
3.1
2.7
Aurobindo Pharma
Accumulate
748
823
43,847
17,086
19,478
22.1
22.0
44.7
51.4
16.7
14.6
3.7
3.0
24.7
22.7
2.7
2.3
Aventis*
Neutral
4,046
-
9,318
2,508
2,862
16.8
16.8
139.9
153.8
28.9
26.3
4.2
3.4
23.5
25.8
3.3
2.7
Cadila Healthcare
Reduce
485
426
49,611
11,584
13,228
20.3
20.4
18.7
21.3
25.9
22.8
5.8
4.7
24.6
22.9
4.1
3.5
Cipla
Sell
574
458
46,149
16,619
19,437
15.4
16.2
19.7
24.3
29.1
23.6
3.3
2.9
12.0
13.2
2.9
2.5
Dr Reddy's
Neutral
2,239
-
37,122
15,844
17,973
17.6
18.2
91.7
111.0
24.4
20.2
2.8
2.5
11.9
13.0
2.6
2.3
GSK Pharma*
Neutral
2,402
-
20,348
3,260
3,651
15.0
18.0
46.1
58.6
52.1
41.0
10.7
11.0
20.0
26.5
6.1
5.6
Indoco Remedies
Sell
202
153
1,861
1,154
1,310
14.9
14.9
11.3
12.7
17.9
15.9
2.5
2.2
15.0
15.0
1.7
1.5
Stock Watch
September 20, 2017
Company Name
Reco
CMP
Target
Mkt Cap
Sales ( Čcr )
OPM(%)
EPS (Č)
PER(x)
P/BV(x)
RoE(%)
EV/Sales(x)
(Č)
Price ( Č)
( Č cr )
FY18E FY19E
FY18E
FY19E
FY18E
FY19E
FY18E
FY19E
FY18E
FY19E
FY18E
FY19E
FY18E
FY19E
Pharmaceuticals
Ipca labs
Accumulate
490
540
6,184
3,593
4,022
14.5
15.5
19.4
25.2
25.3
19.5
2.3
2.1
9.5
11.2
1.8
1.6
Lupin
Buy
1,006
1,467
45,442
18,657
21,289
21.3
23.3
52.8
66.7
19.1
15.1
2.9
2.4
16.3
17.5
2.4
2.0
Natco Pharma
Neutral
799
-
13,922
1,836
1,946
31.8
28.9
22.1
20.6
36.1
38.7
7.3
6.5
20.1
16.7
7.4
7.0
Sun Pharma
Accumulate
517
558
123,945
32,899
36,451
26.9
25.4
31.6
32.3
16.4
16.0
2.9
2.5
18.7
18.8
3.4
2.9
Syngene International
Buy
481
557
9,613
1,402
1,823
32.8
36.0
15.9
20.7
30.3
23.3
5.7
4.7
18.7
20.0
6.8
5.2
Power
Tata Power
Neutral
85
-
22,882
32,547
33,806
20.5
20.5
4.7
5.4
18.0
15.8
1.7
1.5
10.5
10.5
1.7
1.6
NTPC
Neutral
169
-
139,266
86,070
101,246
28.3
30.7
12.9
16.2
13.1
10.4
1.4
1.3
10.6
12.4
3.0
2.7
Power Grid
Neutral
215
-
112,688
29,183
32,946
89.7
90.0
18.0
20.8
12.0
10.4
2.0
1.8
17.7
18.2
7.8
7.2
Real Estate
Prestige Estate
Neutral
281
-
10,524
4,607
5,146
21.0
22.2
7.9
9.8
35.5
28.6
2.2
2.0
10.3
12.0
3.5
3.1
MLIFE
Neutral
525
-
2,694
487
590
12.3
17.8
21.0
31.2
25.0
16.8
1.3
1.2
5.2
7.4
4.2
3.5
Telecom
Bharti Airtel
Neutral
395
-
157,777
97,903
105,233
36.0
36.3
9.3
11.1
42.4
35.7
2.1
1.9
5.0
5.6
2.6
2.3
Idea Cellular
Neutral
83
-
29,937
35,012
37,689
27.1
27.7
(4.4)
(2.7)
1.3
1.4
(6.8)
(4.6)
2.2
1.9
zOthers
Abbott India
Neutral
4,171
-
8,864
3,244
3,723
14.9
16.1
167.5
209.4
24.9
19.9
5.5
4.6
23.7
24.8
2.4
2.0
Asian Granito
Neutral
492
-
1,480
1,169
1,286
12.5
12.5
16.0
19.7
30.8
25.0
3.3
2.9
10.7
11.6
1.5
1.3
Bajaj Electricals
Neutral
390
-
3,964
4,646
5,301
6.7
7.6
16.1
22.3
24.3
17.5
4.0
3.4
16.4
19.2
0.8
0.7
Banco Products (India)
Neutral
218
-
1,558
1,530
1,695
13.2
12.7
19.0
20.0
11.5
10.9
1.8
1.6
0.2
0.2
0.9
103.1
Coffee Day Enterprises
Neutral
242
-
4,989
3,494
3,913
17.4
18.0
4.8
5.7
-
42.5
2.2
2.0
-
0.1
1.9
1.7
Ltd
Elecon Engineering
Neutral
52
-
583
171
201
15.0
16.2
36.0
43.0
1.4
1.2
0.1
0.1
0.1
0.1
2.8
2.4
Garware Wall Ropes
Neutral
865
-
1,892
928
1,003
15.2
15.2
39.4
43.2
21.9
20.0
3.6
3.1
16.5
15.4
1.9
1.7
Goodyear India*
Neutral
830
-
1,914
1,717
1,866
11.8
12.3
47.9
49.8
17.3
16.7
2.7
2.3
15.6
15.7
0.8
116.0
Hitachi
Neutral
1,966
-
5,347
2,355
2,715
10.3
10.8
49.0
60.9
40.1
32.3
9.4
7.4
0.2
0.2
2.3
2.0
HSIL
Neutral
390
-
2,816
2,240
2,670
14.6
15.0
17.0
22.0
22.9
17.7
1.9
1.8
0.1
0.1
1.5
1.2
Interglobe Aviation
Neutral
1,149
-
41,550
22,570
27,955
14.2
15.0
63.6
81.8
18.1
14.1
9.5
8.0
0.5
0.6
1.5
1.1
Jyothy Laboratories
Neutral
431
-
7,833
1,781
2,044
14.1
15.0
9.4
10.5
46.1
41.1
9.8
9.2
0.2
0.2
4.6
4.0
Linc Pen & Plastics
Neutral
234
-
346
420
462
9.3
9.3
15.3
17.1
15.3
13.7
2.6
2.7
16.9
19.5
0.9
0.8
M M Forgings
Neutral
650
-
785
542
642
20.1
21.0
41.6
56.8
15.6
11.5
2.2
1.8
0.1
0.2
1.9
1.6
Mirza International
Neutral
168
-
2,015
1,148
1,285
18.0
18.0
8.0
9.4
20.8
17.9
3.5
2.9
16.3
16.1
1.9
1.7
Navkar Corporation
Buy
193
265
2,757
561
617
41.5
41.5
11.5
12.7
16.8
15.2
1.8
1.6
10.5
10.4
5.6
4.9
Nilkamal
Neutral
1,576
-
2,352
2,317
2,525
11.4
11.1
96.0
105.0
16.4
15.0
2.8
2.4
0.2
0.2
1.0
0.9
Stock Watch
September 20, 2017
Company Name
Reco
CMP
Target Mkt Cap
Sales ( Čcr )
OPM(%)
EPS (Č)
PER(x)
P/BV(x)
RoE(%)
EV/Sales(x)
(Č)
Price ( Č)
( Č cr )
FY18E FY19E FY18E FY19E FY18E FY19E FY18E FY19E FY18E FY19E FY18E FY19E FY18E FY19E
zOthers
Parag Milk Foods
Neutral
247
-
2,080
1,987
2,379
7.6
9.0
12.4
18.3
19.9
13.5
2.8
2.5
8.2
13.2
1.2
1.0
Radico Khaitan
Neutral
169
-
2,251
1,811
1,992
13.2
13.2
8.1
8.8
20.9
19.2
2.1
2.3
10.1
12.0
1.6
1.4
Relaxo Footwears
Neutral
528
-
6,345
1,981
2,310
13.7
14.5
12.0
15.5
44.0
34.1
8.6
6.9
0.2
0.2
3.3
2.8
Siyaram Silk Mills
Accumulate
2,311
2,500
2,166
1,769
1,981
12.7
12.7
113.1
131.1
20.4
17.6
3.2
2.7
15.5
15.5
1.4
1.2
Styrolution ABS India* Neutral
934
-
1,643
1,800
1,980
8.0
8.1
42.0
46.2
22.3
20.2
2.5
2.2
0.1
0.1
1.0
0.9
Surya Roshni
Neutral
318
-
1,394
4,870
5,320
7.7
7.8
22.8
28.1
14.0
11.3
1.9
1.6
0.1
0.1
0.5
0.4
TVS Srichakra
Neutral
3,125
-
2,393
2,729
2,893
12.7
12.5
248.5
265.0
12.6
11.8
3.6
2.9
0.3
0.3
0.9
0.8
Visaka Industries
Neutral
655
-
1,040
1,104
1,214
12.1
12.6
31.0
37.9
21.1
17.3
2.6
2.3
0.1
0.1
1.2
1.0
VIP Industries
Neutral
248
-
3,511
1,450
1,693
10.4
10.5
6.5
7.8
38.0
31.8
8.0
7.0
21.1
22.1
2.4
2.1
Navin Fluorine
Accumulate
659
730
3,247
945
1,154
22.4
22.6
28.7
34.8
23.0
19.0
3.8
3.2
-
-
3.0
2.3
Source: Company, Angel Research; Note: *December year end; #September year end; &October year end; Price as on September 19, 2017
Market Outlook
September 20, 2017
Research Team Tel: 022 - 39357800
DISCLAIMER
Angel Broking Private Limited (hereinafter referred to as “Angel”) is a registered Member of National Stock Exchange of India
Limited,Bombay Stock Exchange Limited and Metropolitan Stock Exchange Limited. It is also registered as a Depository Participant with
CDSL and Portfolio Manager with SEBI. It also has registration with AMFI as a Mutual Fund Distributor. Angel Broking Private Limited is a
registered entity with SEBI for Research Analyst in terms of SEBI (Research Analyst) Regulations, 2014 vide registration number
INH000000164. Angel or its associates has not been debarred/ suspended by SEBI or any other regulatory authority for accessing
/dealing in securities Market. Angel or its associates/analyst has not received any compensation / managed or
co-managed public offering of securities of the company covered by Analyst during the past twelve months.
This document is solely for the personal information of the recipient, and must not be singularly used as the basis of any investment
decision. Nothing in this document should be construed as investment or financial advice. Each recipient of this document should make
such investigations as they deem necessary to arrive at an independent evaluation of an investment in the securities of the companies
referred to in this document (including the merits and risks involved), and should consult their own advisors to determine the merits and
risks of such an investment.
Reports based on technical and derivative analysis center on studying charts of a stock's price movement, outstanding positions and
trading volume, as opposed to focusing on a company's fundamentals and, as such, may not match with a report on a company's
fundamentals. Investors are advised to refer the Fundamental and Technical Research Reports available on our website to evaluate the
contrary view, if any.
The information in this document has been printed on the basis of publicly available information, internal data and other reliable
sources believed to be true, but we do not represent that it is accurate or complete and it should not be relied on as such, as this
document is for general guidance only. Angel Broking Pvt. Limited or any of its affiliates/ group companies shall not be in any way
responsible for any loss or damage that may arise to any person from any inadvertent error in the information contained in this report.
Angel Broking Pvt. Limited has not independently verified all the information contained within this document. Accordingly, we cannot
testify, nor make any representation or warranty, express or implied, to the accuracy, contents or data contained within this document.
While Angel Broking Pvt. Limited endeavors to update on a reasonable basis the information discussed in this material, there may be
regulatory, compliance, or other reasons that prevent us from doing so.
This document is being supplied to you solely for your information, and its contents, information or data may not be reproduced,
redistributed or passed on, directly or indirectly.
Neither Angel Broking Pvt. Limited, nor its directors, employees or affiliates shall be liable for any loss or damage that may arise from
or in connection with the use of this information.