OFS note | Fertilizer
March 7, 2013
Rashtriya Chemicals & Fertilisers
SUBSCRIBE
CMP
`44
Recommend SUBSCRIBE
OFS floor price
`45
The Government of India is divesting 68,961,012 shares (12.5% stake) in Rashtriya
Chemicals & Fertilisers (RCF) out of its shareholding of 92.5% in the domestic
market through Offer for Sale (OFS). We recommend investors to SUBSCRIBE the
RCF issue.
Investment Arguments
New Urea Investment Policy to boost expansion plan
The recently approved New Urea Policy is likely to encourage fertilizer companies
to set up new plants and expand existing capacities, thereby reducing dependence
on imports. India currently imports ~30% of its urea requirement. The new policy
provides moderate upside to companies as the government plans to give 12-20%
post-tax returns (earlier, returns were less than 12%) on fresh capital infused by
manufacturers for both - setting new urea plants, and for the expansion or
modernisation of the existing plants. The government plans to facilitate this by
providing subsidy on gas prices (the main feedstock of urea, accounting for ~80%
of the cost) subject to its price remaining at or below the level of US$14/mmbtu.
The company is geared up with a capacity expansion plan of urea at Thal by
12.7lakh MT p.a. to be completed in the next three years with a capex of
~`4,112cr, which the company plans to fund through a mix of equity, debt and
internal funding. The project has been cleared by pre-Public Investment Board (PIB)
and the company is now seeking PIB’s and CCEA’s approval.
Great distribution network and high brand recall
RCF has ~6,314 dealers across the county as well as over 500 co-operative
marketing societies that facilitate its pan-India reach. The company enjoys a high
brand recall with brands like Ujjwala (urea); Suphala 15:15:15 and Suphala 20:20:20
(NPK); Biola (bio-fertilizers); Microla (micro nutrients) and Sujala (water soluble
fertilizers). Further, given the high brand recall, RCF enjoys a market share of 10.7% in
the urea market, 5.5% in the NPK market and 7.3% in the MOP market.
Projects under consideration may provide upside in future
In addition to the expansion plan at the Thal unit, the company is working on other
projects for capacity expansion, which are also expected to be completed in a span
of next three to four years. These include -
1) Coal gasification based fertilizer & chemical complex at Talcher (12.7lakh MT
urea, 3.3lakh MT ammonium nitrate and 2.8lakh MT nitric acid) on a JV basis with
Coal India and Fertilizer Corporation, with a capex of ~`9,126cr.
2) Fertilizer project in Ghana (12.7lakh MT urea) on a JV basis with a capex of
~`7,121cr.
3) Granulated Single Super Phosphate project at Thal with a capex of ~`307cr.
Tejashwini Kumari
However, none of these projects are near their zero dates, while they also have a
022-39357800 Ext: 6856
long gestation period.
Please refer to important disclosures at the end of this report
1
OFS note | RCF
Company overview
RCF is a Miniratna PSU incorporated in 1978 as a chemical manufacturer. The
Government of India’s shareholding in the company stands at 92.5%. RCF is in the
business of manufacturing and marketing of various fertilizers and chemicals and
is among the leading players in its industry segment. Its products enjoy high brand
recall. It is the fourth largest producer of urea (sold under the brand name Ujjwala)
with a market share of 10.7% and total capacity of ~23lakh MT p.a. in India. The
company has two operating units at Trombay and Thal in Maharashtra. RCF has
expanded its revenue stream and product portfolio through sale of imported
diammonium phosphate (DAP) and muriate of potash (MOP).
Exhibit 1: Business Structure
Segments
Products
Sales*
EBITDA*
Nitrogenous Fertilizers
Urea - Manufactured & Imported
50%
P&K Fertilizers
Complex Fertilizers
- Suphala 15:15:15
62%
36%
- ANP 20:20:0
- DAP, MOP, Complexes Imported
Industrial Chemicals
Used in various Industries like Pharmaceuticals, Drugs, dyes,
13%
pesticides etc
Specialty Nutrients
Bio Fertilizers
38%
Micro Nutrients
1%
Water Soluble Fertilizers
Source: Company Presentation, Angel Research, *contribution in FY2012
Industry
The Indian fertilizer industry is one of the most regulated sectors in the country. The
urea sector (which accounts for around 50% of the fertilizer consumption) is
completely regulated where retail prices are fixed and subsidy is variable in order
to ensure cost plus return (12% post tax RoE). On the contrary, the non-urea sector
(DAP and NPK fertilizers) functions under a fixed subsidy. A variable retail price
framework is followed with considerable pricing freedom being granted since April
2011.
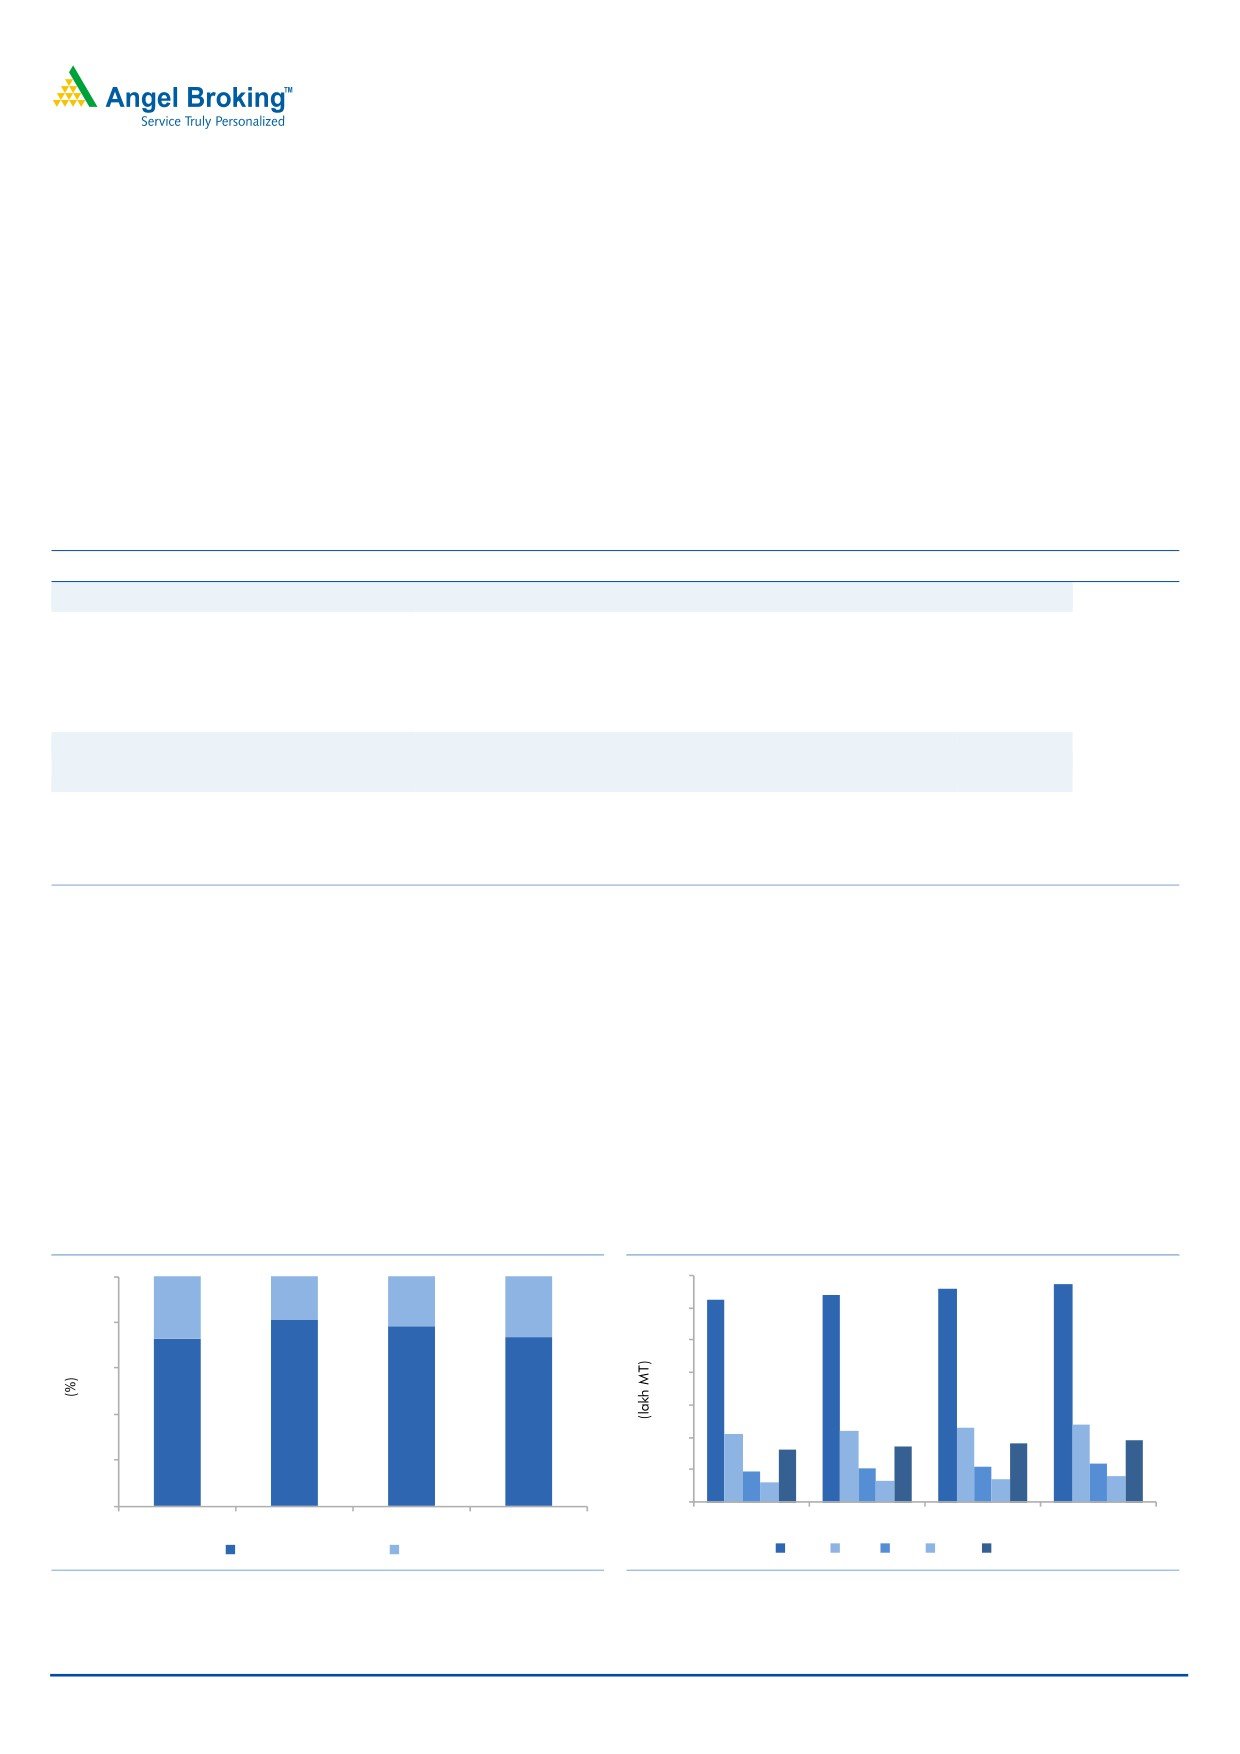
Exhibit 2: Demand fulfilment - Domestic vs. imports
Exhibit 3: Fertilizer demand forecasts in India
100.0
350
320
329
337
312
19.2
21.4
26.9
26.7
300
80.0
250
60.0
200
150
120
40.0
105
110
115
85
90
95
100
80
51
55
60
47
40
20.0
30
33
36
50
73.1
80.8
78.6
73.3
0.0
0
FY2009
FY2010
FY2011
FY2012
FY2014
FY2015
FY2016
FY2017
Domestic production
Import
Urea DAP SSP MOP NPK
Source: Company, Angel Research
Source: Company, Angel Research
March 7, 2013
2
OFS note | RCF
The growth in overall demand for fertilizers has remained at ~5% over the period
FY2005-12. However, the production has remained largely stagnant during the
same period, mainly because of lack of capacity addition due to various policy
related issues and limited availability of raw materials. Hence, India’s dependence
on fertilizer imports has increased to the current level of ~27% for urea and 68%
for DAP.
However, with the New Urea Policy coming in, we expect the scenario to improve
and dependence on imports to reduce in coming years.
Exhibit 4: Major players producing Urea in India
Company
Urea Capacity* (lakh MT)
Other Products
IFFCO
42.4
NPK, DAP, Phosphates, Complex
NFL
32.3
-
KRIBHCO
25.9
-
RCF
23.3
Nitro Phosphate, Ammonium Nitrate Phosphate
Chambal Fertilizers & Chemicals Ltd.
17.3
-
Nagarjuna Fertilizers & Chemicals Ltd.
15.2
-
Source: Company, Angel Research, * as on November 2012
Risks and concerns
Fluctuations in global raw material & natural gas prices
Policy related issues and stringent terms in gas supply and transportation
contracts and their operability
Adverse movements in exchange rate
Adverse agro-climatic conditions may impact the performance of the company
Recession in international chemical market leading to un-remunerative
domestic prices
Outlook and valuation
The new urea investment policy and capacity expansion plans provide the
company a healthy outlook but being a public sector company in a highly
regulated industry, the implementation of projects as well as the policies might get
delayed, which may pose a risk to the company’s future.
The company has fixed a floor price of `45, which is at a premium of 2.6% from
its current market price (CMP) `44. At the CMP, the stock is trading at a PE of 8.7x
on TTM basis and at the floor price of the issue of `45, it is trading at 9.0x on TTM
basis. We recommend investors to SUBSCRIBE the RCF issue as it is fairly valued
and the successful completion of projects in pipeline will provide upside to the
stock in the future.
March 7, 2013
3
OFS note | RCF
Profit and Loss Statement
Y/E March (` cr)
FY2008*
FY2009*
FY2010
FY2011
FY2012
Total operating income
5,141
8,366
5,642
5,524
6,434
% chg
62.8
(32.6)
(2.1)
16.5
Net Raw Materials
2,399
5,099
3,651
2,937
3,497
% chg
112.6
(28.4)
(19.5)
19.0
Other Mfg costs
1,312
1,369
552
925
1,011
% chg
4.3
(59.7)
67.6
9.3
Personnel
236
382
359
400
424
% chg
61.7
(6.2)
11.6
5.9
Other
902
1,113
740
861
1,102
% chg
23.4
(33.5)
16.4
28.0
Total Expenditure
4,850
7,963
5,302
5,124
6,034
EBITDA
291
403
340
400
399
% chg
38.5
(15.6)
17.6
(0.1)
(% of Net Sales)
5.7
4.8
6.0
7.2
6.2
Depreciation & Amortisation
83
87
106
113
143
EBIT
208
316
234
287
257
% chg
52.2
(25.9)
22.5
(10.6)
(% of Net Sales)
4.0
3.8
4.2
5.2
4.0
Interest & other Charges
66
111
71
69
49
Other Income
100
119
180
137
167
(% of Net Sales)
2.0
1.4
3.2
2.5
2.6
Recurring PBT
142
206
164
218
207
% chg
45.3
(20.3)
32.8
(4.7)
PBT (reported)
242
325
344
354
374
Tax
84
114
109
110
125
(% of PBT)
34.7
35.2
31.8
30.9
33.5
PAT (reported)
158
211
234
245
249
Extraordinary Expense/(Inc.)
(1)
-
-
(1)
(1)
ADJ. PAT
159
211
234
246
250
% chg
32.7
11.3
4.9
1.8
(% of Net Sales)
3.1
2.5
4.2
4.4
3.9
Basic EPS (`)
2.9
3.8
4.2
4.5
4.5
Fully Diluted EPS (`)
2.9
3.8
4.2
4.5
4.5
% chg
32.7
11.3
4.9
1.8
Note: *Standalone
March 7, 2013
4
OFS note | RCF
Balance Sheet Statement
Y/E March (` cr)
FY2008*
FY2009*
FY2010
FY2011
FY2012
SOURCES OF FUNDS
Equity Share Capital
552
552
552
552
552
Reserves& Surplus
987
1,120
1,284
1,460
1,620
Shareholder’s Funds
1,539
1,672
1,836
2,012
2,171
Total Loans
1,243
1,425
1,355
422
1,185
Other Long Term Liabilities
0
0
-
85
72
Long Term Provisions
0
0
-
108
127
Deferred Tax (Net)
166
149
164
156
214
Total Liabilities
2,948
3,245
3,354
2,783
3,770
APPLICATION OF FUNDS
Gross Block
2,778
2,875
3,116
3,264
3,521
Less: Acc. Depreciation
1,693
1,762
1,867
1,980
2,123
Less: Impairment
31
31
1
1
1
Net Block
1,054
1,082
1,247
1,282
1,397
Capital Work-in-Progress
115
248
178
82
177
Lease adjustment
0
-
-
-
-
Goodwill
0
-
-
-
-
Investments
360
20
0
15
18
Long Term Loans and advances
0
0
-
98
136
Other Non-current asset
0
0
-
14
16
Current Assets
2,290
3,819
2,883
2,257
3,874
Cash
49
412
785
419
592
Loans & Advances
231
926
830
88
85
Inventory
872
693
410
535
1,178
Debtors
1,138
1,788
859
857
1,978
Other current assets
-
357
41
Current liabilities
872
1,925
954
966
1,848
Net Current Assets
1,418
1,894
1,929
1,291
2,026
Misc. Exp. not written off
2
1
-
-
-
Total Assets
2,948
3,245
3,354
2,783
3,770
Note: *Standalone
March 7, 2013
5
OFS note | RCF
Cash Flow Statement
Y/E March (` cr)
FY2008*
FY2009*
FY2010 FY2011 FY2012
Profit before tax
242
325
344
354
374
Depreciation
83
87
106
113
143
Change in Working Capital
(166)
(113)
338
273
(562)
Direct taxes paid
(84)
(114)
(109)
(110)
(125)
Others
62
84
(38)
25
20
Cash Flow from Operations
138
269
640
656
(150)
(Inc.)/Dec. in Fixed Assets
(115)
(230)
(170)
(53)
(353)
(Inc.)/Dec. in Investments
(360)
340
20
(15)
(3)
(Incr)/Decr In LT loans & adv.
-
(112)
(39)
Others
3
20
52
116
98
Cash Flow from Investing
(472)
130
(99)
(64)
(296)
Issue of Equity
0
-
-
-
-
Inc./(Dec.) in loans
288
181
(69)
(933)
763
Dividend Paid (Incl. Tax)
(5)
(5)
(7)
(8)
(8)
Others
(130)
(211)
(92)
(16)
(136)
Cash Flow from Financing
153
(36)
(168)
(957)
619
Inc./(Dec.) in Cash
(181)
363
372
(365)
173
Opening Cash balances
231
49
412
785
419
Closing Cash balances
49
412
785
419
592
Note: *Standalone
March 7, 2013
6
OFS note | RCF
Key Ratios
Y/E March
FY2008*
FY2009*
FY2010
FY2011
FY2012
Valuation Ratio (x)
P/E (on FDEPS)
15.2
11.5
10.3
9.8
9.7
P/CEPS
10.0
8.1
7.1
6.7
6.2
P/BV
1.6
1.4
1.3
1.2
1.1
EV/Net sales
0.6
0.4
0.5
0.4
0.5
EV/EBITDA
11.2
8.5
8.8
6.0
7.5
EV / Total Assets
1.2
1.1
0.9
0.9
0.8
Per Share Data (`)
EPS (Basic)
2.9
3.8
4.2
4.5
4.5
EPS (fully diluted)
2.9
3.8
4.2
4.5
4.5
Cash EPS
4.4
5.4
6.2
6.5
7.1
DPS
0.1
0.1
0.1
0.1
0.1
Book Value
27.9
30.3
33.3
36.5
39.4
DuPont Analysis
EBIT margin
4.0
3.8
4.2
5.2
4.0
Tax retention ratio
0.7
0.6
0.7
0.7
0.7
Asset turnover (x)
2.3
3.5
2.5
2.6
2.3
ROIC (Post-tax)
6.0
8.5
7.2
9.4
6.2
Cost of Debt (Post Tax)
3.9
5.4
3.5
5.4
4.1
Leverage (x)
0.5
0.6
0.3
(0.0)
0.3
Operating ROE
7.1
10.3
8.3
9.4
6.7
Returns (%)
ROCE (Pre-tax)
7.5
10.2
7.3
10.9
7.2
Angel ROIC (Pre-tax)
9.2
13.1
10.5
13.6
9.3
ROE
10.6
13.1
13.4
12.8
12.0
Turnover ratios (x)
Asset TO (Gross Block)
1.9
3.0
1.9
1.7
1.9
Inventory / Net sales (days)
57
34
36
31
49
Receivables (days)
72
64
86
57
80
Payables (days)
-
64
99
68
85
WC cycle (ex-cash) (days)
97
65
74
58
81
Solvency ratios (x)
Net debt to equity
0.5
0.6
0.3
(0.0)
0.3
Net debt to EBITDA
2.9
2.5
1.7
(0.0)
1.4
Int. Coverage (EBIT/ Int.)
3.1
2.9
3.3
4.1
5.2
Note: *Standalone
March 7, 2013
7
OFS note | RCF
Research Team Tel: 022 - 39357800
DISCLAIMER
This document is solely for the personal information of the recipient, and must not be singularly used as the basis of any investment
decision. Nothing in this document should be construed as investment or financial advice. Each recipient of this document should make
such investigations as they deem necessary to arrive at an independent evaluation of an investment in the securities of the companies
referred to in this document (including the merits and risks involved), and should consult their own advisors to determine the merits and
risks of such an investment.
Angel Broking Limited, its affiliates, directors, its proprietary trading and investment businesses may, from time to time, make
investment decisions that are inconsistent with or contradictory to the recommendations expressed herein. The views contained in this
document are those of the analyst, and the company may or may not subscribe to all the views expressed within.
Reports based on technical and derivative analysis center on studying charts of a stock's price movement, outstanding positions and
trading volume, as opposed to focusing on a company's fundamentals and, as such, may not match with a report on a company's
fundamentals.
The information in this document has been printed on the basis of publicly available information, internal data and other reliable
sources believed to be true, but we do not represent that it is accurate or complete and it should not be relied on as such, as this
document is for general guidance only. Angel Broking Limited or any of its affiliates/ group companies shall not be in any way
responsible for any loss or damage that may arise to any person from any inadvertent error in the information contained in this report.
Angel Broking Limited has not independently verified all the information contained within this document. Accordingly, we cannot testify,
nor make any representation or warranty, express or implied, to the accuracy, contents or data contained within this document. While
Angel Broking Limited endeavours to update on a reasonable basis the information discussed in this material, there may be regulatory,
compliance, or other reasons that prevent us from doing so.
This document is being supplied to you solely for your information, and its contents, information or data may not be reproduced,
redistributed or passed on, directly or indirectly.
Angel Broking Limited and its affiliates may seek to provide or have engaged in providing corporate finance, investment banking or
other advisory services in a merger or specific transaction to the companies referred to in this report, as on the date of this report or in
the past.
Neither Angel Broking Limited, nor its directors, employees or affiliates shall be liable for any loss or damage that may arise from or in
connection with the use of this information.
Note: Please refer to the important `Stock Holding Disclosure' report on the Angel website (Research Section). Also, please refer to the
latest update on respective stocks for the disclosure status in respect of those stocks. Angel Broking Limited and its affiliates may have
investment positions in the stocks recommended in this report.
March 7, 2013
8
OFS note | RCF
6th Floor, Ackruti Star, Central Road, MIDC, Andheri (E), Mumbai- 400 093. Tel: (022) 39357800
Research Team
Fundamental:
Sarabjit Kour Nangra
VP-Research, Pharmaceutical
Vaibhav Agrawal
VP-Research, Banking
Bhavesh Chauhan
Sr. Analyst (Metals & Mining)
Viral Shah
Sr. Analyst (Infrastructure)
Sharan Lillaney
Analyst (Mid-cap)
V Srinivasan
Analyst (Cement, FMCG)
Yaresh Kothari
Analyst (Automobile)
Ankita Somani
Analyst (IT, Telecom)
Sourabh Taparia
Analyst (Banking)
Bhupali Gursale
Economist
Vinay Rachh
Research Associate
Amit Patil
Research Associate
Shareen Batatawala
Research Associate
Twinkle Gosar
Research Associate
Tejashwini Kumari
Research Associate
Technicals:
Shardul Kulkarni
Sr. Technical Analyst
Sameet Chavan
Technical Analyst
Sacchitanand Uttekar
Technical Analyst
Derivatives:
Siddarth Bhamre
Head - Derivatives
Institutional Sales Team:
Mayuresh Joshi
VP - Institutional Sales
Hiten Sampat
Sr. A.V.P- Institution sales
Meenakshi Chavan
Dealer
Gaurang Tisani
Dealer
Akshay Shah
Sr. Executive
Production Team:
Tejas Vahalia
Research Editor
Dilip Patel
Production
Angel Broking Ltd: BSE Sebi Regn No : INB 010996539 / CDSL Regn No: IN - DP - CDSL - 234 - 2004 / PMS Regn Code: PM/INP000001546 Angel Securities Ltd:BSE: INB010994639/INF010994639 NSE: INB230994635/INF230994635 Membership numbers: BSE 028/NSE:09946
Angel Capital & Debt Market Ltd: INB 231279838 / NSE FNO: INF 231279838 / NSE Member code -12798 Angel Commodities Broking (P) Ltd: MCX Member ID: 12685 / FMC Regn No: MCX / TCM / CORP / 0037 NCDEX : Member ID 00220 / FMC Regn No: NCDEX / TCM / CORP / 0302
March 7, 2013
9