FPO Note | Banking
May 10, 2011
Power Finance Corporation
SUBSCRIBE
Issue Open: May10, 2011
High-powered growth
Issue Close: May 13, 2011
Strong growth outlook: The surge in power sector projects in the past few years,
Issue Details
especially from the private sector, has led to a sharp increase in funding
requirements, visible in PFC’s huge outstanding loan sanctions of `1.7lakh crore.
Face Value: `10
This alone provides high loan growth visibility in the next few years (we have
Present Eq. Paid-up Capital: `1147.8cr
factored in a 25% CAGR in loan growth over FY2012-13E). Moreover, with banks
having seen a 47% CAGR in power sector lending in the past two years, their
Offer Size: 22.96cr Shares
exposures in most cases have reached close to board-mandated limits, creating
Fresh Issue: 17.22cr Shares
even more space for specialised lenders such as PFC to grow. This will be further
aided by the company’s expanded net worth post the FPO and higher
Offer for sale:5.74cr Shares
concentration limits pursuant to an infrastructure finance company (IFC) status.
Post Eq. Paid-up Capital: ` 1,320cr
Healthy profitability: Structurally, as is the case with several other niche NBFCs,
regulatory arbitrage vis-à-vis banks allows PFC to earn healthy NIMs, further
Issue size (amount):** `4,353-4,573cr
aided by its close-to-sovereign credit rating. Moreover, reduction in risk weightage
Fresh Issue: **`3,265-3,434cr
from 100% to 20% due to the IFC status makes funding from banks ~100bp
cheaper. Cyclically, we have conservatively factored in a 50bp NIM compression
Offer for sale: ** `1,088-1,143cr
over FY2012-13E due to rising funding costs. That said, the recent
Price Band: `193-203#
underperformance of the stock, in our view, over discounted the
~75bp
sequential NIM compression in 4QFY2011 (calculated), which was partly on
Post-issue implied mkt cap**: ` 25,474cr-
26,795cr
account of large bond and ECB issuances (issue costs accounted upfront) as well
as large disbursements towards the quarter-end.
Promoters holding Pre-Issue: 89.8%
With 87% of loans to public sector utilities so far, asset quality has not been an
Promoters holding Post-Issue: 73.7%
issue irrespective of the financial health of utilities. In our view, the scenario
Note: **At the lower and upper price band,
respectively, # 5% discount to retail investors
pertaining to PSU borrowers is likely to remain unchanged, further aided by the
likely benign approach towards any required restructuring and NPA recognition
pertaining to such loans, given quasi-sovereign status as well as systemic issues of
Book Building
the alternative. The increasing proportion of private sector loan sanctions, in our
view, does increase the risk profile. Though, in any case, this is unlikely to
QIBs
Up to 50%
manifest in the next few years, when most loans relate to projects under
Non-Institutional
At least 15%
implementation, the substantial valuation discount to PFC’s historical valuation
range provides further margin of safety.
Retail
At least 35%
Attractive valuations: At the CMP, the stock is trading at 1.1x FY2013 P/ABV.
Historically, the stock has traded at 1.2-2.2x one-year forward ABV with a median
Post Issue Shareholding Pattern
of 1.75x. Considering asset-quality issues that could creep up as exposure to
private sector increases, we have assigned an FY2013E P/ABV multiple of 1.4x,
Promoters Group
73.7
20% lower than PFC’s median P/ABV multiple since listing. The resultant target
MF/Banks/Indian
26.3
price of `254 implies an upside of 25% from the upper end of the price band.
FIs/FIIs/Public & Others
Hence, we recommend Subscribe to the issue.
Key financials
Y/E March (` cr)
FY2010 FY2011E FY2012E FY2013E
NII
2,874
3,466
4,056
4,733
Vaibhav Agrawal
% chg
44.1
20.6
17.0
16.7
022 - 3935 7800 Ext: 6808
Net profit
2,357
2,619
3,073
3,601
% chg
19.7
11.1
17.4
17.2
Shrinivas Bhutda
NIM (%)
3.9
3.8
3.6
3.3
022 - 3935 7800 Ext: 6845
EPS (`)
20.5
22.8
23.3
27.3
P/E (x)
9.9
8.9
8.7
7.4
P/ABV (x)
1.7
1.5
1.3
1.1
Varun Varma
RoA (%)
3.1
2.7
2.6
2.4
022 - 3935 7800 Ext: 6847
RoE (%)
18.3
18.1
16.6
15.8
Source: RHP, Angel Research. Note: Valuations at the upper price band
Please refer to important disclosures at the end of this report
1
Power Finance Corporation | FPO Note
Company background
Power Finance Corporation Ltd. (PFC) is a leading power sector public financial
institution and a non-banking financial company, providing fund and non-fund
based support for development of the Indian power sector. The company plays a
major role in channelising investment into the power sector and acts as a vehicle
for development of this sector. PFC enjoys the highest credit rating in the Indian
market; while in international markets, the company is rated at par with the Indian
Sovereign rating. The company is registered as a non-banking financial company
(NBFC) by the RBI and was conferred with the status of Nav-Ratna PSU by the
Government of India on June 22, 2007. The company was conferred with the
status of NBFCND-IFC (Non Banking Finance Company-Non Deposit Taking-
Infrastructure Finance Company) on July 28, 2010.
Details of the issue
The IPO comprises an issue of 22.95cr equity shares of face value of `10 each in
the price band of `193-203 per share. The issue comprises a fresh issue of
17.22cr equity shares and an offer for sale of 5.74cr equity shares by the
Government of India. The company expects to raise between `3,092cr and
`3,262cr at the lower and upper price band, respectively. The primary issue of
shares would result in a dilution of the promoter’s holding by 16.1% to 73.7%.
The issue proceeds are planned to be utilised for augmenting the capital base to
ensure compliance with requisite capital adequacy norms and to meet future
capital requirements arising out of growth in the business and for general
corporate purposes.
Investment arguments
Strong growth outlook
The surge in power sector projects in the past few years, especially from the private
sector, has led to a sharp increase in funding requirements, visible in PFC’s huge
outstanding loan sanctions of `1.7lakh crore. This alone provides high loan
growth visibility in the next few years (we have factored in a 25% CAGR in loan
growth over FY2012-13E). Moreover, with banks having seen a 47% CAGR in
power sector lending in the past two years, their exposure in most cases has
reached close to board-mandated limits, creating even more space for specialised
lenders such as PFC to grow. This will be further aided by the company’s expanded
net worth post the FPO and higher concentration limits pursuant to its IFC status.
May 10, 2011
2
Power Finance Corporation | FPO Note
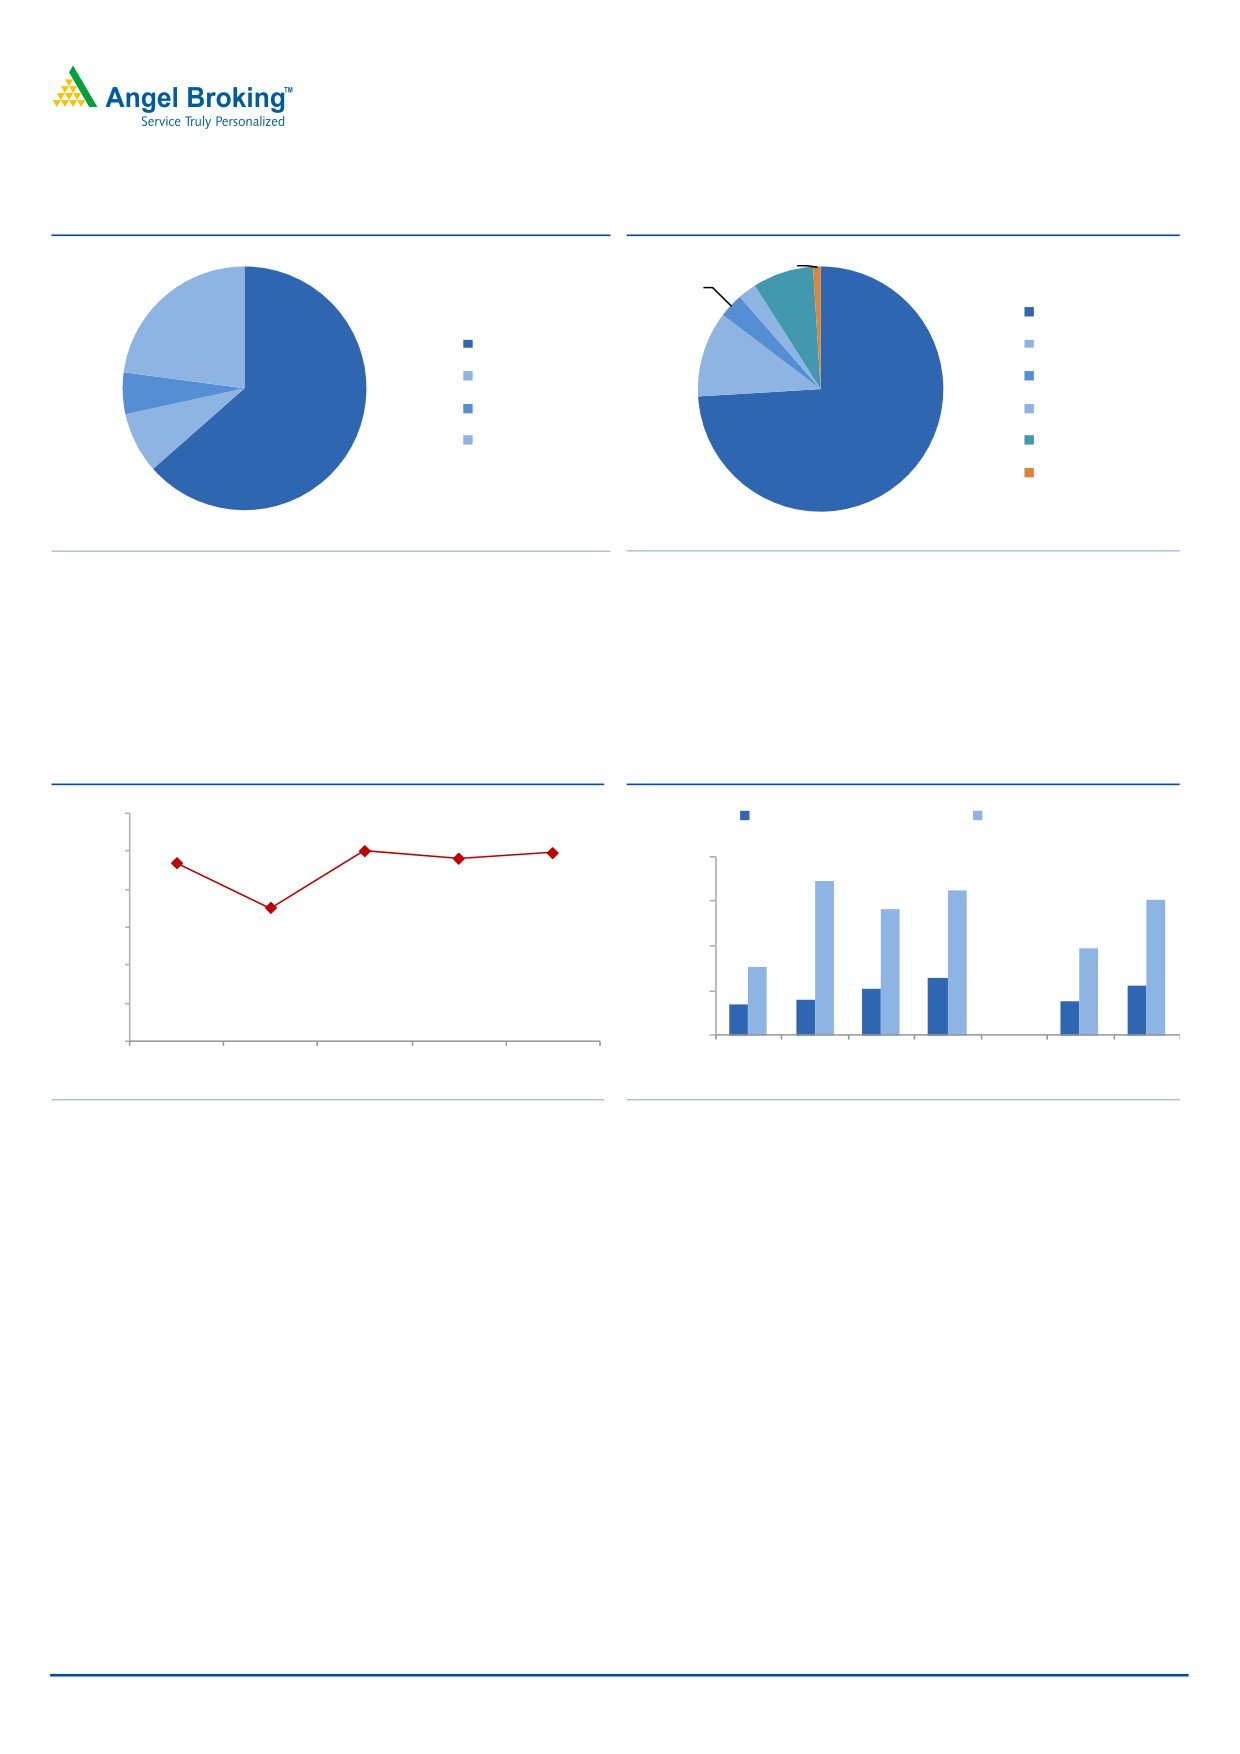
Exhibit 1: Outstanding sanction mix* - Sector wise
Exhibit 2: Outstanding sanction mix* - Project wise
1%
3%
3%
8%
Generation
23%
State Sector
Transmission
11%
Central Sector
Distribution
6%
Joint Sector
R-APDRP (Part A)
8%
63%
Private sector
R-APDRP (Part B)
74%
Others
Source: RHP, Angel Research; Note: *As of December 31, 2010
Source: RHP, Angel Research; Note: *As of December 31, 2010
Outstanding sanctions as of December 31, 2010, stood at 1.7lakh crore, with
higher concentration towards public sector (~77% of total outstanding sanctions)
and generation projects (~74% of total outstanding sanctions).
Exhibit 3: Healthy yoy loan growth
Exhibit 4: Disbursements and sanctions
30.00
Disbursements (`cr)
Sanctions (`cr)
24.94
24.68
23.36
23.94
25.00
80,000
20.00
17.49
60,000
15.00
40,000
10.00
20,000
5.00
0
0.00
2007
2008
2009
2010
9MFY109MFY11
2007
2008
2009
2010
2011
Source: RHP, Angel Research
Source: RHP, Angel Research
Loan growth has been healthy on a yearly basis, and seeing the large demand
supply gap in power requirements and increasing needs for power financing, we
expect loan growth to sustain at 25% levels for FY2013. The disbursement and
sanctions over FY2007-9MFY2011 have also been healthy (`22,270cr worth
disbursements and `61,077 worth sanctions done in 9MFY2011).
May 10, 2011
3
Power Finance Corporation | FPO Note
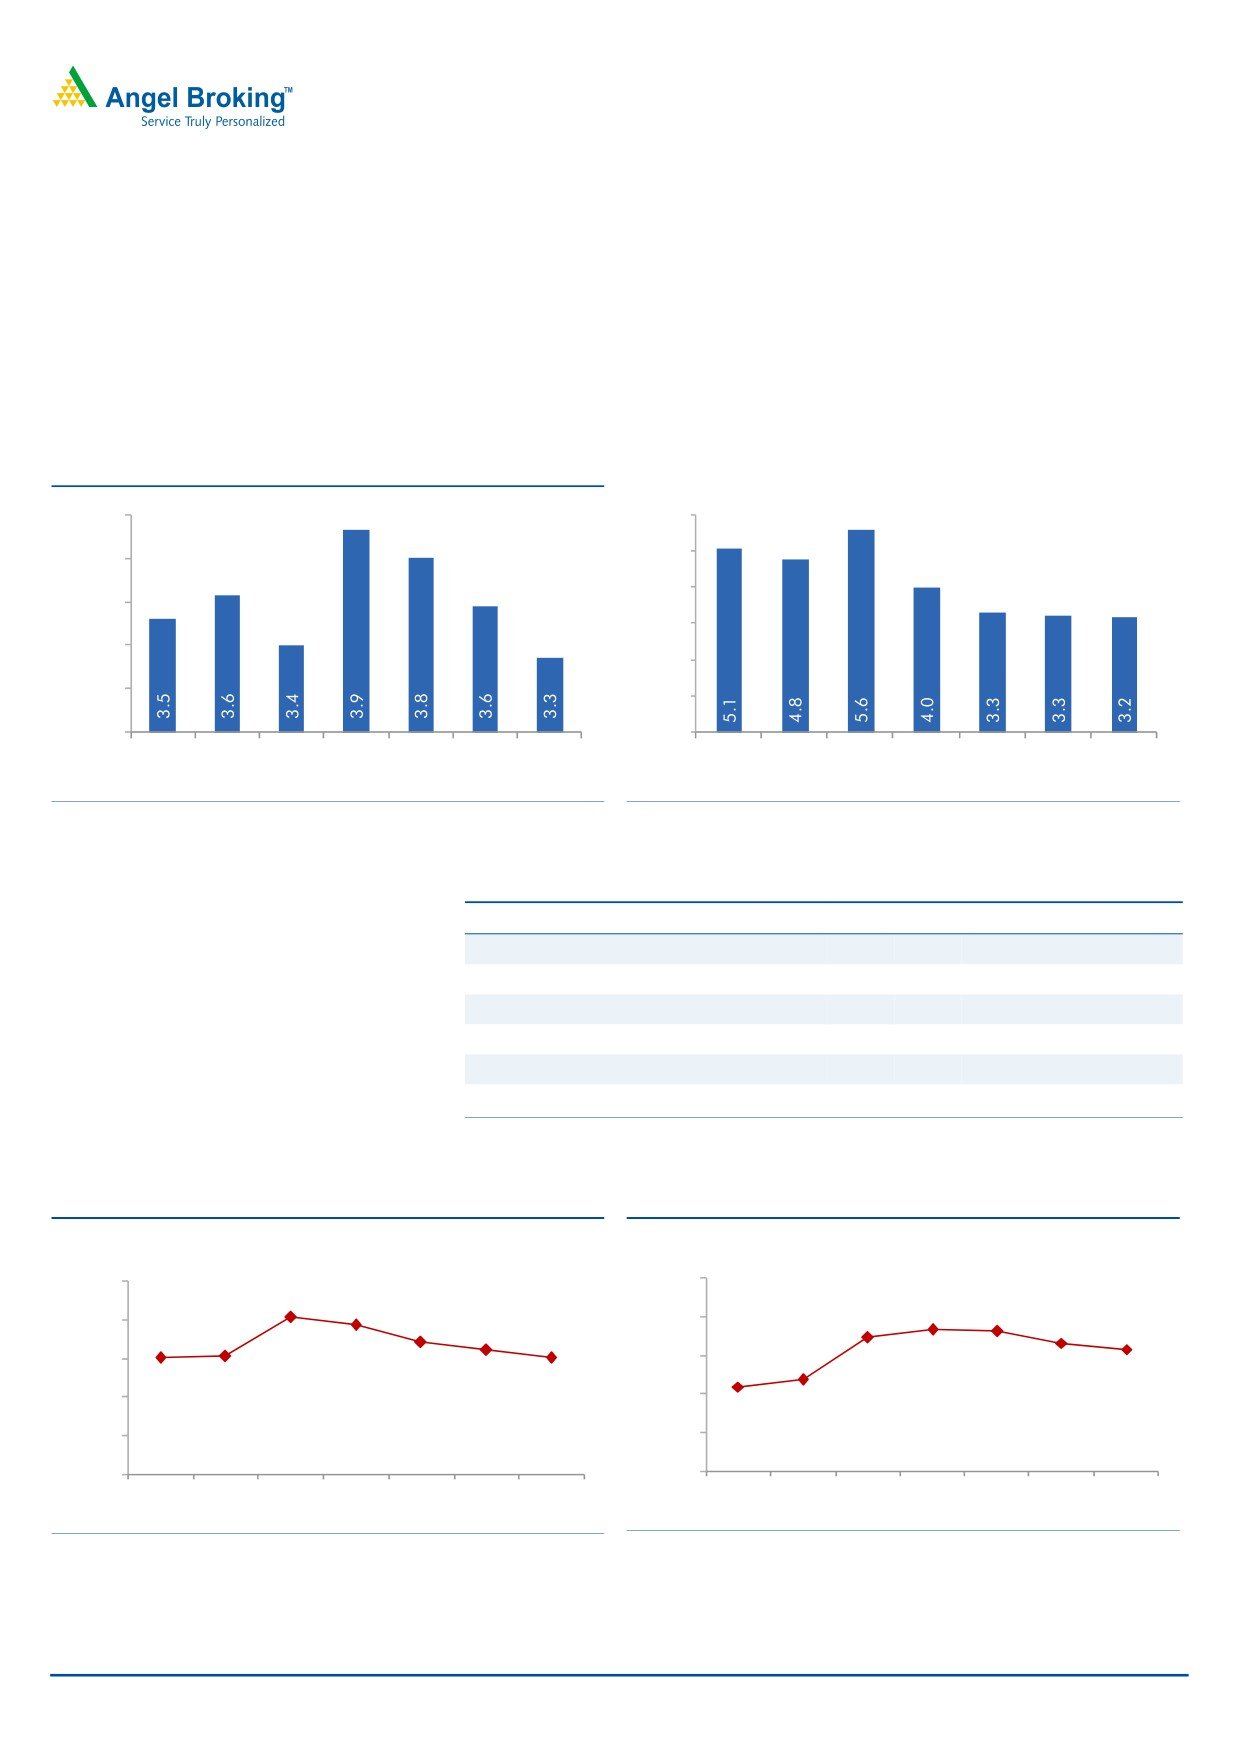
Exhibit 5: Outstanding loan mix* - Sector wise
Exhibit 6: Outstanding loan mix* - Project wise
3%
7%
12%
8%
State Sector
Generation
Central Sector
20%
TnD
Joint Sector
Others
65%
Private Sector
85%
Source: Company, Angel Research; Note: *As of December 31, 2010
Source: Company, Angel Research; Note: *As of December 31, 2010
Outstanding loans as of December 31, 2010, stood at `92,040cr, with higher
concentration to public sector units (~93% of total loans outstanding) and to
generation projects (85% of total loans outstanding).
Exhibit 7: Borrowing profile (%)
Borrowing Profile (%)
4QFY2009
1QFY2010 2QFY2010 3QFY2010 4QFY2010 1QFY2011 2QFY2011 3QFY2011
Bonds
70.7
71.4
73.7
73.0
69.5
74.1
73.7
73.6
Term Loans
26.6
26.4
24.5
25.2
27.1
25.4
25.9
25.1
Short-term Loans
2.7
2.1
1.8
1.7
3.5
0.5
0.3
1.3
Total
100
100
100
100
100
100
100
100
Rupee Denominated
95.0
95.4
97.3
97.5
95.9
96.1
94.8
95.0
Foreign Currency Loans
5.0
4.6
2.7
2.5
4.1
3.9
5.2
5.0
Total
100
100
100
100
100
100
100
100
Source: Company, Angel Research
Healthy profitability
Structurally, as is the case with several other niche NBFCs, regulatory arbitrage vis-
à-vis banks allows PFC to earn healthy NIMs, further aided by its close-to-
sovereign credit rating. Moreover, reduction in risk weightage from 100% to 20%
due to the IFC status makes funding from banks ~100bp cheaper. Cyclically, we
have conservatively factored in a 50bp NIM compression over FY2012-13E due to
rising funding costs. That said, the recent underperformance of the stock, in our
view, over discounted the ~75bp sequential NIM compression in 4QFY2011
(calculated), which was partly on account of large bond and ECB issuances (issue
costs accounted upfront) as well as large disbursements towards the quarter-end.
With 87% of loans to public sector utilities so far, asset quality has not been an
issue irrespective of the financial health of the utilities. In our view, the scenario
pertaining to PSU borrowers is likely to remain unchanged, further aided by the
likely benign approach towards any required restructuring and NPA recognition
pertaining to such loans, given quasi-sovereign status as well as systemic issues of
the alternative. The increasing proportion of private sector loan sanctions, in our
view, does increase the risk profile. Though, in any case, this is unlikely to manifest
May 10, 2011
4
Power Finance Corporation | FPO Note
in the next few years, when most loans relate to projects under implementation, the
substantial valuation discount to PFC’s historical valuation range provides further
margin of safety.
Overall, driven by 25% loan growth and NIM of 3.3% by FY2013E, we estimate
PAT CAGR of 17.3% (EPS CAGR 0f 9.4%) over FY2011-13. PFC has delivered
healthy ROAs and ROEs over FY2007-10. Going forward, we expect ROAs and
ROEs to sustain at 2.4% and 15.8%, respectively.
Exhibit 8: Healthy NIMs and...
Exhibit 9: ...low C-I* ratio leading to higher profitability
4.0
6.0
5.0
3.8
4.0
3.6
3.0
3.4
2.0
3.2
1.0
3.0
0.0
FY07
FY08
FY09
FY10
FY11E FY12E FY13E
FY07
FY08
FY09
FY10
FY11E FY12E FY13E
Source: Company, Angel Research
Source: Company, Angel Research, Note * Cost-to-income ratio
Exhibit 10: Near negligible NPAs for PFC
Gross NPA as on
2006
2007
2008
2009
2010 9MFY11
Public sector (`cr)
31.7
25.9
4.2
4.2
4.2
4.2
Private sector (`cr)
59.3
16.4
8.9
8.9
8.9
8.9
Total
909.9
423.1
131.6
131.6
131.6
131.6
GNPA ratio (Public, %)
0.01%
0.01%
0.00%
0.00%
0.00%
0.00%
GNPA ratio (Private, %)
0.21%
0.05%
0.02%
0.02%
0.02%
0.01%
GNPA Total (%)
0.26%
0.10%
0.03%
0.02%
0.02%
0.01%
Source: RHP, Angel Research
Exhibit 11: Healthy ROAs...
Exhibit 12: ...and healthy ROEs
(%)
(%)
4.0
25.0
3.2
3.1
18.3
18.1
3.2
2.7
20.0
17.3
16.6
2.6
15.8
2.4
2.4
2.4
2.4
15.0
11.9
11.0
1.6
10.0
0.8
5.0
0.0
0.0
FY07
FY08
FY09
FY10
FY11E FY12E FY13E
FY07
FY08
FY09
FY10
FY11E FY12E FY13E
Source: Company, Angel Research
Source: Company, Angel Research
May 10, 2011
5
Power Finance Corporation | FPO Note
IFC status to aid in capitalising on available financing
opportunities in the power sector
PFC before being categorised as an IFC was categorized as a loan company (a
category of NBFCs). Thus, loans given to PFC (despite it having AAA rating
accorded by CRISIL and CARE) were assigned a 100% risk weightage, as a bank’s
claims on all categories of NBFCs except AFCs and IFCs are uniformly risk
weighted at 100%.
However, bank claims on corporates, asset finance companies (AFCs) IFCs
(NBFC-IFC) are risk weighted as per the ratings assigned by rating agencies
registered with the SEBI and accredited by the RBI. Hence, post conferral of IFC
status to PFC (July 28, 2010), the risk weightage assigned to loans given to PFC by
banks stands at 20%, allowing banks to keep aside lower capital (1/5th of the
previous amount required) to meet capital adequacy norms and, hence, employ
higher leverage to increase their ROAs. These gains, which accrue to banks in
terms of higher returns, will enable PFC relatively easier and cheaper access to
funds than what it had when it was classified as a loan company. In our view, the
benefit to PFC in the form of lower cost of funds from banks works out to ~100bp.
The IFC status also makes PFC eligible to raise, under the automatic route, ECBs
up to US$500mn each fiscal, subject to the aggregate outstanding ECBs not
exceeding 50.0% of the net worth. With foreign currency loans coming at a
cheaper cost than domestic borrowings, we expect PFC to maximise this advantage
by raising more foreign currency borrowings in future. As of December 31, 2010,
foreign currency borrowings stood at
`3,813cr
(4.0% of total borrowings).
The company recently availed (February 2011) of a JPY, denominated foreign
currency loan equivalent to US$260mn
Exhibit 13: Concentration of credit / investment
NBFC Type
Loan company
IFC
Lending ceilings
Lending to any single borrower
15% (+ 5*)
25%
Lending to any single group of borrowers
25% (+ 10*)
40%
Investing ceilings
Investing in shares of a company
15% (+ 5*)
15% (+ 5*)
Investing in shares of a single group of companies
25% (+ 10*)
25% (+ 10*)
Loans and investment taken together
Lending and investing to single party
25% (+ 5*)
30%
Lending and investing to single group of parties
40% (+ 10*)
50%
Source: RHP, Angel Research Note: * Additional exposure applicable in case of infrastructure loans
Classification of PFC as an IFC will permit banks to take an exposure of up to 20%
(15% for NBCFs engaged in infra lending) of their capital funds to PFC. Also, as a
government-owned NBFC, loans made to central and state entities in the power
sector (92.9% of total loan portfolio as of December 31, 2010) are currently
exempt from the RBI's prudential lending norm (0.4% provisioning for standard
assets) that are applicable to other non-government owned NBFCs (hit of ~`340cr
to P&L if this exemption is withdrawn).
May 10, 2011
6
Power Finance Corporation | FPO Note
PFC, now being classified as an IFC, is also allowed to issue infrastructure bonds
that offer tax benefits to investors (currently these bonds can only be issued by IFCI,
LIC, IDFC and IFCs). The company recently raised `235cr via issue of these
infrastructure bonds (March 31, 2011).
Investment risks
Historically, PFC has witnessed superior asset quality, which is reflected in the near
zero NPAs that the company has maintained on its loan portfolio. Although, state
electricity boards, to which PFC has the highest exposure, have been in poor health
for a while now, there default seems unlikely given their quasi-sovereign status;
however, the risk of restructuring cannot be ruled out. As of December 31, 2010,
the top 10 borrowers accounted for 54.1% of the loan portfolio, indicating high
borrower concentration. A single default or restructure on these accounts could
send the NPAs soaring and stem asset-quality concerns, which the company has
successfully managed to evade until now.
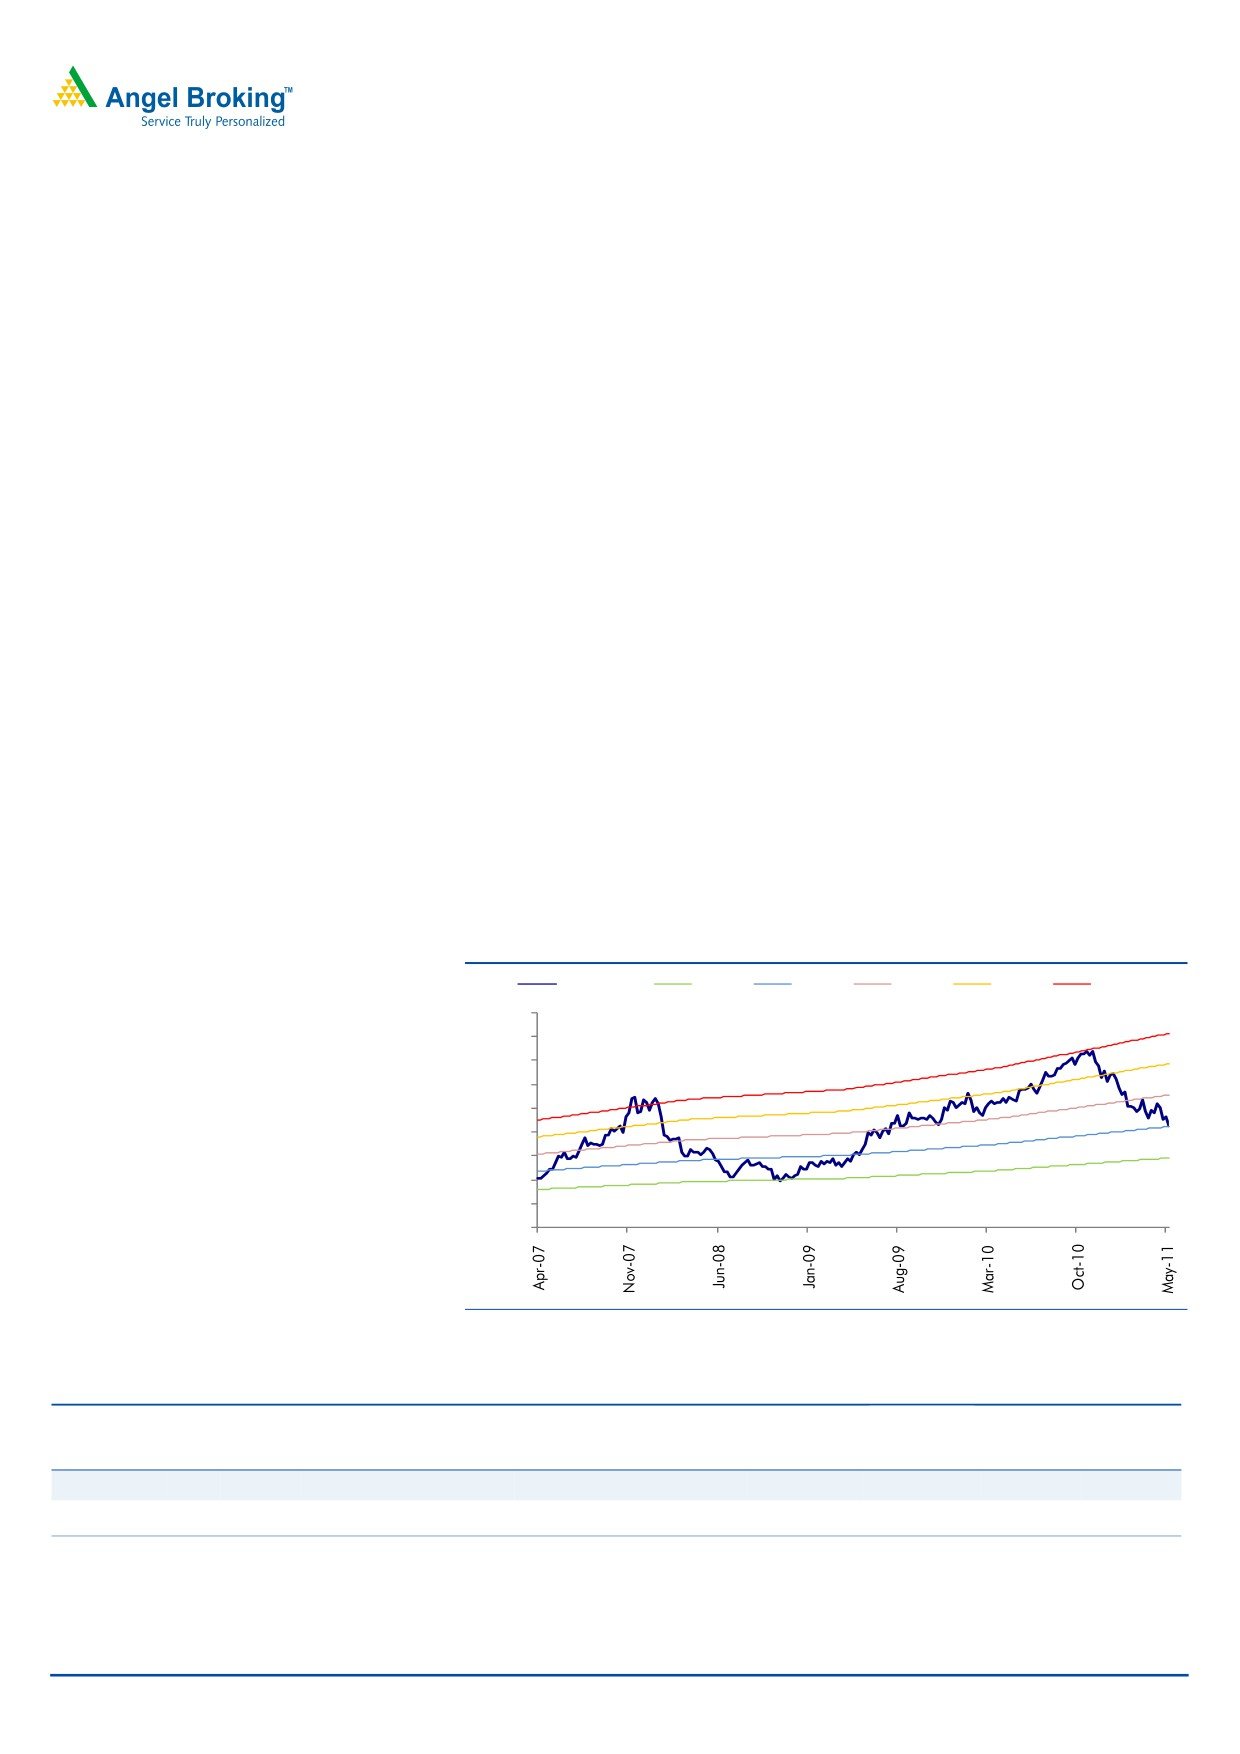
Outlook and valuation
At the CMP, the stock is trading at 1.1x FY2013 P/ABV. Historically, the stock has
traded in at 1.2-2.2x one-year forward ABV with a median of 1.75x. Considering
asset-quality issues that could creep up as exposure to private sector increases,
we have assigned an FY2013E P/ABV multiple of 1.4x, 20% lower than PFC’s
median P/ABV multiple since listing. The resultant target price of `254 implies an
upside of 25% from the upper end of the price band. Hence, we recommend
Subscribe to the issue.
Exhibit 14: P/ABV band
Price (`)
0 .9x
1 .3x
1 .7x
2 .1x
2.50
450
400
350
300
250
200
150
100
50
-
Source: Company, Angel Research
Exhibit 15: Reco summary
FY11E-13E
Tgt. Price
FY2013E
FY2013E Tgt.
FY2013E P/E
FY2013E FY2013E
Comp
Reco. CMP (`)
Upside (%)
EPS CAGR
(`)
P/ABV (x)
P/ABV (x)
(x)
RoA (%)
RoE (%)
(%)
PFC
Buy
203$
254
25.2
1.1
1.4
7.4
9.4
2.4
15.8
REC*
NA
222
NA
NA
1.3
NA
6.4
16.3
3.0
21.4
Source: Company, Angel Research; Note * Bloomberg estimates for REC, $ At the upper end of the issue
May 10, 2011
7
Power Finance Corporation | FPO Note
Income statement
Y/E March (` cr)
FY07
FY08
FY09
FY10
FY11
FY12E
FY13E
Net Interest Income
1,417
1,758
1,994
2,874
3,466
4,056
4,733
- YoY Growth (%)
16.5
24.1
13.4
44.1
20.6
17.0
16.7
Other Income
176
119
118
266
202
240
300
- YoY Growth (%)
46.2
(32.0)
(0.9)
124.5
(23.8)
18.8
25.0
Operating Income
1,593
1,878
2,113
3,140
3,668
4,296
5,033
- YoY Growth (%)
19.2
17.9
12.5
48.6
16.8
17.1
17.1
Operating Expenses
81
90
118
126
121
140
161
- YoY Growth (%)
13.5
10.9
31.6
6.4
(3.5)
15.0
15.0
Pre - Provision Profit
1,512
1,788
1,994
3,014
3,547
4,157
4,872
- YoY Growth (%)
19.5
18.3
11.6
51.1
17.7
17.2
17.2
Prov. and Cont.
0
-
4
0
3
6
8
- YoY Growth (%)
(83)
(100)
NA
(89)
670
76
44
Profit Before Tax
1,512
1,788
1,990
3,013
3,543
4,151
4,864
- YoY Growth (%)
19.5
18.3
11.3
51.4
17.6
17.1
17.2
Provision for Taxation
525
581
21
656
925
1,077
1,262
- as a % of PBT
34.8
32.5
1.0
21.8
26.1
26.0
26.0
PAT
986
1,207
1,970
2,357
2,619
3,073
3,601
- YoY Growth (%)
1.6
22.4
63.2
19.7
11.1
17.4
17.2
Balance sheet
Y/E March (` cr)
FY07
FY08
FY09
FY10
FY11
FY12E FY13E
Share Capital
1,148
1,148
1,148
1,148
1,148
1,320
1,320
Reserve & Surplus
8,677
9,249 11,269 12,184
14,264
19,904
22,656
Borrowings
33,584 40,648 52,160 67,108
85,591
104,804
133,508
- Growth (%)
24.7
21.0
28.3
28.7
27.5
22.4
27.4
Other Liabilities & Provisions
2,129
2,443
3,586
4,375
5,804
7,480
9,401
Total Liabilities
45,538 53,487 68,163 84,815 106,806
133,508
166,885
Investments
59
66
36
31
54
67
84
Advances
43,919 51,574 64,436 79,856
99,562
124,453
155,566
- Growth (%)
23.3
17.4
24.9
23.9
24.7
25.0
25.0
Fixed Assets
81
77
75
75
77
96
120
Other Assets
1,478
1,770
3,616
4,853
7,114
8,892
11,115
Total Assets
45,538 53,487 68,163 84,815 106,806
133,508
166,885
May 10, 2011
8
Power Finance Corporation | FPO Note
Key Ratios
Year end March
FY07
FY08
FY09
FY10 FY11
FY12E
FY13E
Per Share Data (`)
EPS
8.6
10.5
17.2
20.5
22.8
23.3
27.3
ABVPS ( 75% Coverage for NPAs)
85.6
90.6
108.2
116.1
134.3
160.8
181.6
DPS
2.3
3.5
4.5
5.5
3.5
4.5
5.5
Profitability ratios (%)
NIMs
3.5
3.6
3.4
3.9
3.8
3.6
3.3
ROA
2.4
2.4
3.2
3.1
2.7
2.6
2.4
ROE
11.0
11.9
17.3
18.3
18.1
16.6
15.8
Asset Quality (%)
Gross NPAs
0.03
0.02
0.02
0.02
0.02
0.02
0.02
Net NPAs
0.00
0.00
0.01
0.01
0.01
0.01
0.01
$
Valuation Ratios
PER (x)
23.6
19.3
11.8
9.9
8.9
8.7
7.4
P/ABVPS (x)
2.4
2.2
1.9
1.7
1.5
1.3
1.1
Dividend Yield
1.1
1.7
2.2
2.7
1.7
2.2
2.7
DuPont Analysis (%)
NII
3.5
3.6
3.3
3.8
3.6
3.4
3.2
(-) Prov. Exp.
0.0
0.0
0.0
0.0
0.0
0.0
0.0
Adj NII
3.5
3.6
3.3
3.8
3.6
3.4
3.1
Other Inc.
0.4
0.2
0.2
0.3
0.2
0.2
0.2
Op. Inc.
3.9
3.8
3.5
4.1
3.8
3.6
3.3
Opex
0.2
0.2
0.2
0.2
0.1
0.1
0.1
PBT
3.7
3.6
3.3
3.9
3.7
3.5
3.2
Taxes
1.3
1.2
0.0
0.9
1.0
0.9
0.8
ROA
2.4
2.4
3.2
3.1
2.7
2.6
2.4
Leverage
4.6
4.9
5.3
5.9
6.6
6.5
6.6
ROE
11.0
11.9
17.3
18.3
18.1
16.6
15.8
Note: $ Valuations at the upper price band
May 10, 2011
9
Power Finance Corporation | FPO Note
Research Team Tel: 022 - 39357800
DISCLAIMER
This document is solely for the personal information of the recipient, and must not be singularly used as the basis of any investment
decision. Nothing in this document should be construed as investment or financial advice. Each recipient of this document should make
such investigations as they deem necessary to arrive at an independent evaluation of an investment in the securities of the companies
referred to in this document (including the merits and risks involved), and should consult their own advisors to determine the merits and
risks of such an investment.
Angel Broking Limited, its affiliates, directors, its proprietary trading and investment businesses may, from time to time, make
investment decisions that are inconsistent with or contradictory to the recommendations expressed herein. The views contained in this
document are those of the analyst, and the company may or may not subscribe to all the views expressed within.
Reports based on technical and derivative analysis center on studying charts of a stock's price movement, outstanding positions and
trading volume, as opposed to focusing on a company's fundamentals and, as such, may not match with a report on a company's
fundamentals.
The information in this document has been printed on the basis of publicly available information, internal data and other reliable
sources believed to be true, but we do not represent that it is accurate or complete and it should not be relied on as such, as this
document is for general guidance only. Angel Broking Limited or any of its affiliates/ group companies shall not be in any way
responsible for any loss or damage that may arise to any person from any inadvertent error in the information contained in this report.
Angel Broking Limited has not independently verified all the information contained within this document. Accordingly, we cannot testify,
nor make any representation or warranty, express or implied, to the accuracy, contents or data contained within this document. While
Angel Broking Limited endeavours to update on a reasonable basis the information discussed in this material, there may be regulatory,
compliance, or other reasons that prevent us from doing so.
This document is being supplied to you solely for your information, and its contents, information or data may not be reproduced,
redistributed or passed on, directly or indirectly.
Angel Broking Limited and its affiliates may seek to provide or have engaged in providing corporate finance, investment banking or
other advisory services in a merger or specific transaction to the companies referred to in this report, as on the date of this report or in
the past.
Neither Angel Broking Limited, nor its directors, employees or affiliates shall be liable for any loss or damage that may arise from or in
connection with the use of this information.
Note: Please refer to the important `Stock Holding Disclosure' report on the Angel website (Research Section). Also, please refer to the
latest update on respective stocks for the disclosure status in respect of those stocks. Angel Broking Limited and its affiliates may have
investment positions in the stocks recommended in this report.
May 10, 2011
10