FPO Note | Non-Ferrous
March 14, 2013
NALCO
AVOID
Issue Open: March 15, 2013
Expensive valuation
Issue Close: March 15, 2013
Company background: The government of India is divesting 10% stake in Nalco
via an OFS at `40/share (a 9.6% discount to its closing price as on March 14,
Issue Details
2013). Nalco, a Navratna company, is India’s third largest aluminium producer.
Face Value: `5
The company has Asia's largest integrated aluminium complex. The company
Present Eq. Paid-up Capital: `1,288cr
engages into alumina refining (capacity - 2.1mn tonnes), aluminium smelting
(capacity - 0.7mn tonnes) and power generation (capacity - 1,200MW). The
Offer Size: 25.8cr Shares
company has a captive bauxite mine at Panchpatmalli with a mining capacity of
6.3mn tonnes p.a. The company also sells excess power. Nalco exports its products
Post Eq. Paid-up Capital: `1,288cr
to South East Asia, Far East, Indian subcontinent, Gulf, China and the U.S.
Issue size (amount): `1,031cr
Aluminium business continues to make losses: At current aluminium price
OFS Floor Price: `40
of US$2,000-2,100/tonne, we expect Nalco to make losses on its Aluminium
Post-issue implied mkt cap: `10,308cr
business. Moreover, prices of key inputs such as coal, caustic soda, CP coke,
aluminium fluoride etc continue to remain high. Hence, we expect Nalco to
Promoters holding Pre-Issue: 87.2%
operate its aluminium smelters at lower utilization levels during FY2013-14.
Promoters holding Post-Issue: 77.2%
Coal supply issues to continue: Nalco has been facing coal supply issues,
which disrupted its operations in the past few quarters. The company sources its
annual coal requirement from Mahanadi Coalfields Ltd., but the supply is not
Post Issue Shareholding Pattern
evenly distributed. In our view, any disturbance in coal supply would increase the
Promoters Group
77.2
company’s dependence on imported or external coal (which is very expensive
MF/Banks/Indian
compared to linkage coal), thereby negatively affecting its margins.
FIs/FIIs/Public &
Others
22.8
No clarity on timelines for production from Utkal coal block: Nalco has
been allotted Utkal-E coal block which has estimated reserves of 70mn tonnes.
Currently, there is no clarity on land acquisition for coal block. Although Nalco
expects to commence production from this mine by end of CY2013, our recent
experience suggests that it could take a much longer time to acquire land and
sign the mining lease with the state government.
Outlook and valuation: Nalco’s earnings over the past 6-8 quarters have
remained very volatile. Although Nalco has captive bauxite mines, the cost of
aluminium production remains very high on account of high power costs. Further,
there is lack of clarity over the company’s future expansion plans. At the OFS
price, Nalco is trading at 7.4x FY2013E and 5.2x FY2014E EV/EBITDA, which is
at a significant premium compared to its peers. Hence, we recommend investors
to avoid subscribing to Nalco OFS.
Key financials (Standalone)
Y/E March (` cr)
FY11
FY12
FY13E
FY14E
Net sales
5,959
6,500
6,630
8,357
% chg
17.9
9.1
2.0
26.0
Net profit
1,069
871
548
840
% chg
31.3
(18.5)
(37.1)
53.3
FDEPS (`)
4.1
3.4
2.1
3.3
OPM (%)
26.7
17.5
11.4
14.5
Bhavesh Chauhan
P/E (x)
9.6
11.8
18.8
12.3
Tel: 022- 39357600 Ext: 6821
P/BV (x)
0.9
0.9
0.9
0.8
RoE (%)
9.9
7.4
4.6
6.9
RoCE (%)
10.2
5.5
2.0
5.0
Vinay Rachh
EV/Sales (x)
0.9
0.8
0.8
0.8
Tel: 022- 39357600 Ext: 6841
EV/EBITDA (x)
3.3
4.7
7.4
5.2
Source: Company, Angel Research
Please refer to important disclosures at the end of this report
1
NALCO | FPO Note
Company Background
Nalco, a Navratna company, is India’s third largest aluminium producer. The
company has Asia's largest integrated aluminium complex. The company engages
into alumina refining (capacity - 2.1mn tonnes), aluminium smelting (capacity -
0.7mn tonnes) and power generation (capacity - 1,200MW). The company has a
captive bauxite mine at Panchpatmalli with a mining capacity of 6.3mn tonnes p.a.
The company also sells excess power. Nalco exports its products to South East
Asia, Far East, Indian subcontinent, Gulf, China and the U.S.
Issue Details
The Promoter (Government of India), proposes to sell 12,88,61,925 equity shares
of the face value of `5 each with an option to sell an additional 12,88,61,925
equity shares of the face value of
`5 each collectively aggregating to
approximately 10% of the total paid up equity share capital of the company.
Nalco
has fixed the OFS floor price at `40 per share (at a 9.6% discount to its closing
price as on March 14, 2013).
Exhibit 1: Shareholding Pattern
Pre-Issue
Post-Issue
Particulars
No. of shares
(%)
No. of shares
(%)
Promoter and promoter group
2,24,60,63,363
87.2
1,98,83,39,512
77.2
Total public holding
33,11,75,149
12.8
58,88,99,000
22.8
Total
2,57,72,38,512
100
2,57,72,38,512
100
Source: Company, Angel Research
March 14, 2013
2
NALCO | FPO Note
Investment rationale
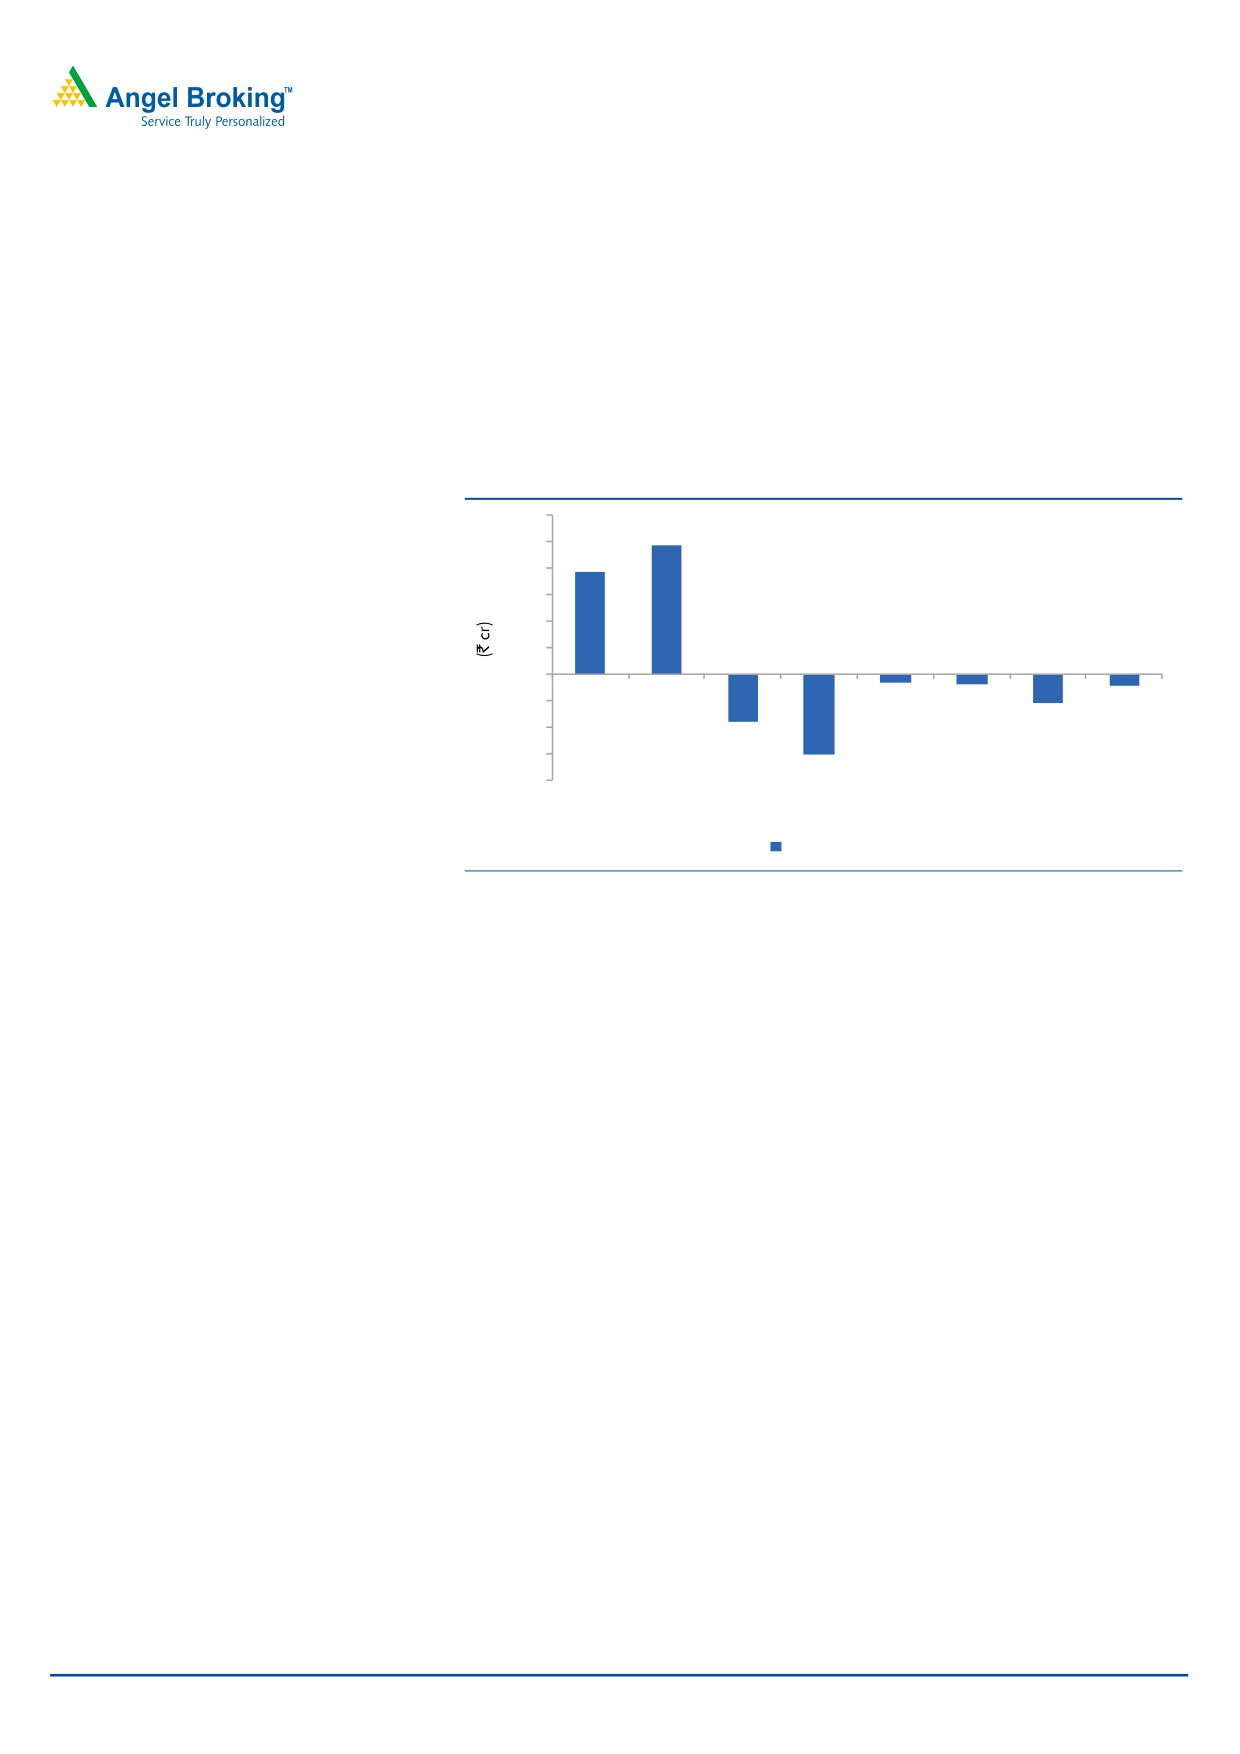
Aluminium business continues to make losses
At current aluminium price of US$2,000-2,100/tonne, we expect Nalco to make
losses on its Aluminium business. Moreover, prices of key inputs such as coal,
caustic soda, CP coke, aluminium fluoride etc continue to remain high. Hence, we
expect Nalco to operate its aluminium smelters at lower utilization levels during
FY2013-14.
Exhibit 2: Aluminium business continues to make losses
300
242
250
193
200
150
100
50
0
(50)
(16)
(19)
(22)
(53)
(100)
(89)
(150)
(153)
(200)
4QFY11 1QFY12 2QFY12 3QFY12 4QFY12 1QFY13 2QFY13 3QFY13
Aluminium EBIT
Source: Company, Angel Research
Coal supply issues to continue
Nalco has been facing coal supply issues, which disrupted its operations in the
past few quarters. The company sources its annual coal requirement from
Mahanadi Coalfields Ltd., but the supply is not evenly distributed. In our view, any
disturbance in coal supply would increase the company’s dependence on imported
or external coal (which is very expensive compared to linkage coal), thereby
negatively affecting its margins.
No clarity on timelines for production from Utkal coal block
Nalco has been allotted Utkal-E coal block which has estimated reserves of 70mn
tonnes. Currently, there is no clarity on land acquisition for coal block. Although
Nalco expects to commence production from this mine by end of CY2013, our
recent experience suggests that it could take a much longer time to acquire land
and sign the mining lease with the state government.
Limited growth visibility
There is little clarity on Nalco’s proposed expansion plans, as they are in various
stages of financial closure and significant progress is yet to be made.
March 14, 2013
3
NALCO | FPO Note
Outlook and valuation
Nalco’s earnings over the past 6-8 quarters have remained very volatile. Although
Nalco has captive bauxite mines, the cost of aluminium production remains very
high on account of high power costs. Further, there is lack of clarity over the
company’s future expansion plans. At the OFS price, Nalco is trading at 7.4x
FY2013E and 5.2x FY2014E EV/EBITDA, which is at a significant premium
compared to its peers. Hence, we recommend investors to avoid subscribing to
Nalco OFS.
March 14, 2013
4
NALCO | FPO Note
Profit & loss statement (Standalone)
Y/E March (` cr)
FY09
FY10
FY11
FY12
FY13E
FY14E
Net Sales
5,095
5,055
5,959
6,500
6,630
8,357
Other operating income
-
119
98
111
136
149
Total operating income
5,095
5,174
6,057
6,612
6,766
8,506
% chg
2.1
1.6
17.1
9.2
2.3
25.7
Total Expenditure
3,401
4,071
4,464
5,473
6,013
7,298
Net Raw Materials
585
808
704
1,034
1,094
1,254
Other Mfg costs
1,562
2,124
1,765
2,197
3,070
3,802
Personnel
771
813
961
1,035
1,153
1,239
Other
483
326
1,033
1,208
696
1,003
EBITDA
1,694
1,102
1,592
1,139
753
1,208
% chg
(23.7)
(34.9)
44.4
(28.5)
(33.9)
60.4
(% of Net Sales)
33.2
21.8
26.7
17.5
11.4
14.5
Depreciation& Amortisation
272
319
422
467
500
557
EBIT
1,421
783
1,170
673
253
651
% chg
(26.7)
(44.9)
49.5
(42.5)
(62.4)
157.4
(% of Net Sales)
27.9
15.5
19.6
10.3
3.8
7.8
Interest & other Charges
4
2
0
1
6
2
Other Income
496
374
353
542
548
586
Recurring PBT
1,913
1,155
1,524
1,214
794
1,235
% chg
(23.2)
(39.6)
31.9
(20.3)
(34.6)
55.5
Extraordinary Inc/(Expense)
14
-
-
(22)
-
-
PBT (reported)
1,927
1,155
1,524
1,192
794
1,235
Tax
655
341
455
342
246
395
(% of PBT)
34.0
29.5
29.8
28.7
31.0
32.0
PAT (reported)
1,272
814
1,069
850
548
840
PAT after MI (reported)
1,272
814
1,069
850
548
840
ADJ. PAT
1,258
814
1,069
871
548
840
% chg
(24.0)
(35.3)
31.3
(18.5)
(37.1)
53.3
(% of Net Sales)
24.7
16.1
17.9
13.4
8.3
10.1
Basic EPS (`)
4.9
3.2
4.1
3.4
2.1
3.3
Fully Diluted EPS (`)
4.9
3.2
4.1
3.4
2.1
3.3
% chg
(24.0)
(35.3)
31.3
(18.5)
(37.1)
53.3
March 14, 2013
5
NALCO | FPO Note
Balance sheet (Standalone)
Y/E March (` cr)
FY09
FY10
FY11
FY12
FY13E
FY14E
SOURCES OF FUNDS
Equity Share Capital
644
644
1,289
1,289
1,289
1,289
Reserves & Surplus
9,126
9,751
9,876
10,426
10,613
11,061
Shareholders Funds
9,770
10,396
11,165
11,715
11,902
12,350
Total Loans
-
-
-
-
-
-
Other long-term liabilities
-
-
270
280
280
280
Deferred Tax Liability
621
661
693
849
849
849
Total Liabilities
10,391
11,056
12,128
12,844
13,030
13,479
APPLICATION OF FUNDS
-
-
-
-
-
-
Gross Block
9,900
11,018
12,076
13,659
14,709
16,409
Less: Acc. Depreciation
5,868
6,182
6,583
7,046
7,546
8,103
Net Block
4,032
4,836
5,494
6,612
7,162
8,306
Capital Work-in-Progress
2,868
2,243
1,707
684
584
284
Goodwill
-
-
-
-
-
-
Investments
896
987
1,332
754
754
754
Current Assets
4,529
5,210
5,589
6,269
6,006
5,611
Cash
2,869
3,152
3,795
4,168
3,952
3,218
Loans & Advances
616
786
612
750
750
750
Other
1,044
1,272
1,183
1,351
1,303
1,643
Current liabilities
1,933
2,220
2,821
2,677
2,677
2,677
Net Current Assets
2,596
2,990
2,768
3,592
3,329
2,934
Othe long-term assets
-
-
827
1,201
1,201
1,201
Mis. Exp. not written off
-
-
-
-
-
-
Total Assets
10,391
11,056
12,128
12,844
13,030
13,479
March 14, 2013
6
NALCO | FPO Note
Cash flow statement (Standalone)
Y/E March (` cr)
FY09
FY10
FY11
FY12
FY13E
FY14E
Profit before tax
1,927
1,155
1,524
1,197
794
1,235
Depreciation
273
319
422
467
500
557
Change in Working Capital
361
(20)
288
(397)
47
(339)
Others
60
9
(56)
(77)
-
-
Direct taxes paid
682
292
548
304
246
395
Cash Flow from Operations
1,938
1,172
1,630
886
1,095
1,057
(Inc.)/ Dec. in Fixed Assets
(2,211)
(678)
(833)
(181)
(950)
(1,400)
(Inc.)/ Dec. in Investments
-
-
-
-
-
-
(Inc.)/ Dec. in loans and adv.
-
-
-
-
-
-
Others
13
84
65
-
-
-
Cash Flow from Investing
(2,198)
(593)
(768)
(181)
(950)
(1,400)
Inc./(Dec.) in loans
-
-
-
-
-
-
Dividend
-
-
-
416
361
392
Others
388
303.8
219
15
-
-
Cash Flow from Financing
(388)
(304)
(219)
(430)
(361)
(392)
Inc./(Dec.) in Cash
(647)
275
642
275
(216)
(734)
Opening Cash balances
3,516
2,878
3,152
3,794
4,168
3,952
Closing Cash balances
2,869
3,152
3,794
4,168
3,952
3,218
March 14, 2013
7
NALCO | FPO Note
Key ratios
Y/E March
FY09
FY10
FY11
FY12
FY13E
FY14E
Valuation Ratio (x)
P/E (on FDEPS)
8.2
12.7
9.6
11.8
18.8
12.3
P/CEPS
6.7
9.1
6.9
7.8
9.8
7.4
P/BV
1.1
1.0
0.9
0.9
0.9
0.8
Dividend yield (%)
3.1
1.6
2.2
2.5
3.0
3.3
EV/Sales
1.3
1.2
0.9
0.8
0.8
0.8
EV/EBITDA
3.9
5.6
3.3
4.7
7.4
5.2
EV/Total Assets
0.6
0.6
0.4
0.4
0.4
0.5
Per Share Data (`)
EPS (Basic)
4.9
3.2
4.1
3.4
2.1
3.3
EPS (fully diluted)
4.9
3.2
4.1
3.4
2.1
3.3
Cash EPS
6.0
4.4
5.8
5.1
4.1
5.4
DPS
1.3
0.6
0.9
1.0
1.2
1.3
Book Value
37.9
40.3
43.3
45.5
46.2
47.9
Dupont Analysis
EBIT margin
27.9
15.5
19.6
10.3
3.8
7.8
Tax retention ratio (%)
66.0
70.5
70.2
71.3
69.0
68.0
Asset turnover (x)
1.4
1.2
1.2
1.1
0.9
1.0
ROIC (Post-tax)
25.8
13.4
17.2
8.1
2.5
5.5
Cost of Debt (Post Tax)
-
-
-
-
-
-
Leverage (x)
-
-
-
-
-
-
Operating ROE
25.8
13.4
17.2
8.1
2.5
5.5
Returns (%)
ROCE (Pre-tax)
14.3
7.3
10.2
5.5
2.0
5.0
Angel ROIC (Pre-tax)
39.1
18.6
24.1
11.2
3.5
7.9
ROE
13.6
8.1
9.9
7.4
4.6
6.9
Turnover ratios (x)
Asset Turnover (Gross Block)
0.5
0.5
0.5
0.5
0.5
0.5
Inventory / Sales (days)
55
65
62
64
64
64
Receivables (days)
2
13
7
8
8
8
Payables (days)
717
718
0
0
0
0
WC cycle (ex-cash) (days)
(5)
(27)
22
71
73
64
Solvency ratios (x)
Net debt to equity
(0.4)
(0.4)
(0.5)
(0.4)
(0.4)
(0.3)
Net debt to EBITDA
(2.2)
(3.8)
(3.2)
(4.3)
(6.2)
(3.3)
March 14, 2013
8
NALCO | FPO Note
Research Team Tel: 022 - 39357800
DISCLAIMER
This document is solely for the personal information of the recipient, and must not be singularly used as the basis of any investment
decision. Nothing in this document should be construed as investment or financial advice. Each recipient of this document should make
such investigations as they deem necessary to arrive at an independent evaluation of an investment in the securities of the companies
referred to in this document (including the merits and risks involved), and should consult their own advisors to determine the merits and
risks of such an investment.
Angel Broking Limited, its affiliates, directors, its proprietary trading and investment businesses may, from time to time, make
investment decisions that are inconsistent with or contradictory to the recommendations expressed herein. The views contained in this
document are those of the analyst, and the company may or may not subscribe to all the views expressed within.
Reports based on technical and derivative analysis center on studying charts of a stock's price movement, outstanding positions and
trading volume, as opposed to focusing on a company's fundamentals and, as such, may not match with a report on a company's
fundamentals.
The information in this document has been printed on the basis of publicly available information, internal data and other reliable
sources believed to be true, but we do not represent that it is accurate or complete and it should not be relied on as such, as this
document is for general guidance only. Angel Broking Limited or any of its affiliates/ group companies shall not be in any way
responsible for any loss or damage that may arise to any person from any inadvertent error in the information contained in this report.
Angel Broking Limited has not independently verified all the information contained within this document. Accordingly, we cannot testify,
nor make any representation or warranty, express or implied, to the accuracy, contents or data contained within this document. While
Angel Broking Limited endeavours to update on a reasonable basis the information discussed in this material, there may be regulatory,
compliance, or other reasons that prevent us from doing so.
This document is being supplied to you solely for your information, and its contents, information or data may not be reproduced,
redistributed or passed on, directly or indirectly.
Angel Broking Limited and its affiliates may seek to provide or have engaged in providing corporate finance, investment banking or
other advisory services in a merger or specific transaction to the companies referred to in this report, as on the date of this report or in
the past.
Neither Angel Broking Limited, nor its directors, employees or affiliates shall be liable for any loss or damage that may arise from or in
connection with the use of this information.
Note: Please refer to the important `Stock Holding Disclosure' report on the Angel website (Research Section). Also, please refer to the
latest update on respective stocks for the disclosure status in respect of those stocks. Angel Broking Limited and its affiliates may have
investment positions in the stocks recommended in this report.
Disclosure of Interest Statement
Nalco
1. Analyst ownership of the stock
No
2. Angel and its Group companies ownership of the stock
No
3. Angel and its Group companies' Directors ownership of the stock
No
4. Broking relationship with company covered
No
Note: We have not considered any Exposure below ` 1 lakh for Angel, its Group companies and Directors
March 14, 2013
9
NALCO | FPO Note
6th Floor, Ackruti Star, Central Road, MIDC, Andheri (E), Mumbai- 400 093. Tel: (022) 39357800
Research Team
Fundamental:
Sarabjit Kour Nangra
VP-Research, Pharmaceutical
Vaibhav Agrawal
VP-Research, Banking
Bhavesh Chauhan
Sr. Analyst (Metals & Mining)
Viral Shah
Sr. Analyst (Infrastructure)
Sharan Lillaney
Analyst (Mid-cap)
V Srinivasan
Analyst (Cement, Power, FMCG)
Yaresh Kothari
Analyst (Automobile)
Ankita Somani
Analyst (IT, Telecom)
Sourabh Taparia
Analyst (Banking)
Bhupali Gursale
Economist
Vinay Rachh
Research Associate
Amit Patil
Research Associate
Shareen Batatawala
Research Associate
Twinkle Gosar
Research Associate
Tejashwini Kumari
Research Associate
Technicals:
Shardul Kulkarni
Sr. Technical Analyst
Sameet Chavan
Technical Analyst
Sacchitanand Uttekar
Technical Analyst
Derivatives:
Siddarth Bhamre
Head - Derivatives
Institutional Sales Team:
Mayuresh Joshi
VP - Institutional Sales
Hiten Sampat
Sr. A.V.P- Institution sales
Meenakshi Chavan
Dealer
Gaurang Tisani
Dealer
Akshay Shah
Sr. Executive
Production Team:
Tejas Vahalia
Research Editor
Dilip Patel
Production Incharge
Angel Broking Ltd: BSE Sebi Regn No : INB 010996539 / CDSL Regn No: IN - DP - CDSL - 234 - 2004 / PMS Regn Code: PM/INP000001546 Angel Securities Ltd:BSE: INB010994639/INF010994639 NSE: INB230994635/INF230994635 Membership numbers: BSE 028/NSE:09946
Angel Capital & Debt Market Ltd: INB 231279838 / NSE FNO: INF 231279838 / NSE Member code -12798 Angel Commodities Broking (P) Ltd: MCX Member ID: 12685 / FMC Regn No: MCX / TCM / CORP / 0037 NCDEX : Member ID 00220 / FMC Regn No: NCDEX / TCM / CORP /
March 14, 2013
10