Offer for Sale | Power Sector
February 6, 2013
NTPC
SUBSCRIBE
CMP
`152
Valuation commands Subscribe
OFS floor price
`145
The government is coming out with an Offer For Sale (OFS) of 78.3cr equity
Stock Info
shares of NTPC. The OFS is expected to raise close to `11,350cr at the floor price
Sector
Power
of `145/share. After this OFS, the government’s stake in the company would
Market Cap (` cr)
125,578
come down from 84.5% to 75%. The OFS will be held on February 07, 2013.
Net Debt (` cr)
30,365
Beta
0.8
Investment Arguments
52 Week High / Low
190/139
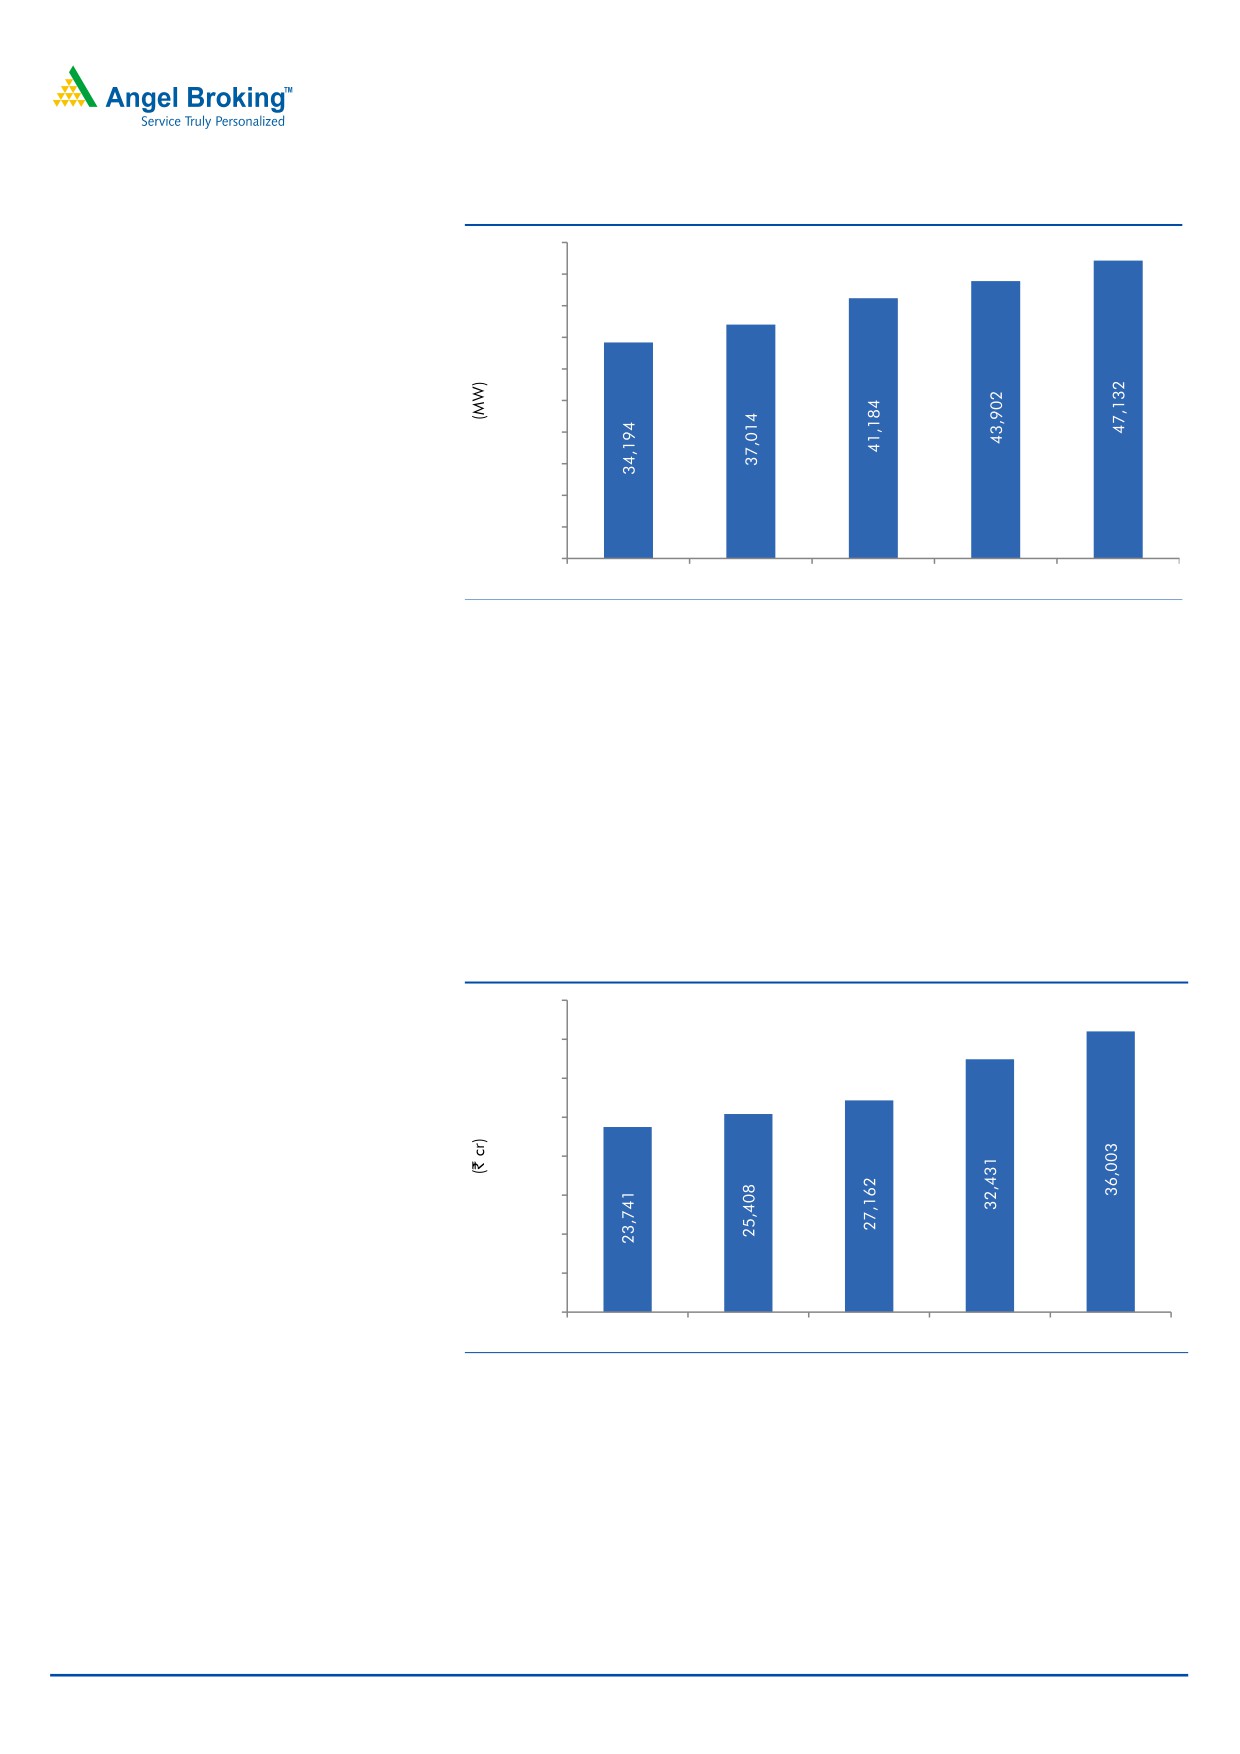
Capacity addition to drive future growth: Going forward, NTPC’s growth is
Avg. Daily Volume
239,341
expected to be driven by the huge capacity addition planned by it. The company
Face Value (`)
10
envisions having 51,000MW of capacity by FY2017. In all, the company targets
BSE Sensex
19,640
to add ~14,038MW of capacity in the Twelfth Plan (FY2012-17), of which
Nifty
5,959
4,170MW and 2,718MW of capacity is planned for addition during FY2013 and
Reuters Code
NTPC.BO
FY2014 respectively. The robust capacity addition is expected to result in
Bloomberg Code
NTPC@IN
15% CAGR in regulated equity to `36,003cr over FY2012-14E.
Earnings protected by the regulated return model: NTPC, being a central public
Shareholding Pattern (%)
utility, is governed by the regulated return model. The CERC’s regulations for
Promoters
84.5
FY2010-14 provide RoE of 15.5% on regulated equity. As per regulations, fuel
MF / Banks / Indian Fls
7.5
costs are a pass-through, which protect the company from cost pressures due to
FII / NRIs / OCBs
4.4
increased fuel costs. NTPC has 85% of its overall output tied up under the
Indian Public / Others
3.6
long-term power purchase agreement (PPA) route (regulated returns), which
ensures power off-take and stable cash flows thereof.
Abs. (%)
3m 1yr
3yr
Outlook and Valuation: We expect NTPC to register a CAGR of 12.3% and 8.5%
Sensex
4.4
10.9
23.4
in its top-line and bottom-line over FY2012-14E, respectively. At the offer price
NTPC
(9.6)
(14.3)
(25.7)
(which is at a 4.6% discount to the price as on February 06, 2013), the stock
would trade at 1.3x FY2014E P/BV. Given the attractive valuation (stock trading at
1.3x FY2014E P/BV compared to its three year trading range of 1.5x to 2.3x and
median of 1.8x), we recommend Subscribe on the issue. We have assigned a
multiple of 1.5x to arrive at a target price of `163.
Key financials (Consolidated)
Y/E March (` cr)
FY2011
FY2012 FY2013E
FY2014E
Net Sales
57,607
64,958
72,809
81,951
% chg
19.4
12.8
12.1
12.6
Net Profit
7,691
9,497
10,048
11,187
% chg
(13.0)
23.5
5.8
11.3
EBITDA (%)
22.2
21.8
23.4
24.1
EPS (`)
9.3
11.5
12.2
13.6
P/E (x)
15.5
12.6
11.9
10.7
V Srinivasan
P/BV (x)
1.7
1.6
1.5
1.3
022-39357800 Ext: 6831
RoE (%)
11.5
13.1
12.7
13.0
RoCE (%)
8.8
8.7
9.3
9.6
EV/Sales (x)
2.4
2.3
2.3
2.2
Amit Patil
022-39357800 Ext: 6839
EV/EBITDA (x)
11.0
10.6
9.7
9.0
Source: Company, Angel Research
Please refer to important disclosures at the end of this report
1
Offer for Sale | Power sector
Company Background
Established in 1975, NTPC is India's largest power generation company. NTPC
Group has an installed capacity of 39,674MW. The company enjoys healthy
operational efficiency and has consistently reported high PLF of ~85% compared
to all-India PLF of ~73%.
Investment Rationale
Capacity addition to drive future growth: Going forward, NTPC’s growth is
expected to be driven by the huge capacity addition planned by it. The company
envisions having 51,000MW of capacity by FY2017. In all, the company targets to
add ~14,038MW of capacity in the Twelfth Plan (FY2012-17), of which 4,170MW
and 2,718MW of capacity is planned for addition during FY2013 and FY2014
respectively. NTPC has already commissioned 2,660MW capacity in 1HFY2013
and is likely to meet its targeted capacity for FY2013. The robust capacity addition
is expected to result in 15% CAGR in regulated equity to `36,003cr by FY2014.
Exhibit 1: Upcoming Projects
Projects
Capacity (MW)
Vallur - I, Phase - I & II JV
500
Solar PV (A&N, Dadri)
10
Rihand - III
500
Bongaigaon
250
Barh-II
660
Koldam
800
Singrauli Hydel
8
Vallur - I, Phase - I & II JV
500
Bongaigaon
500
Barh-II
660
Barh-I
660
Tapovan Vishnugarh Hydel
520
Nabinagar JV
500
Kanti - Subsidiary
390
Barh-I
1320
Vindhyachal
500
Kudgi
800
Nabinagar JV
500
Kudgi
800
Source: Company, Angel Research
February 6, 2013
2
Offer for Sale | Power sector
Exhibit 2: Capacity ramp up
50,000
45,000
40,000
35,000
30,000
25,000
20,000
15,000
10,000
5,000
-
FY2011
FY2012
FY2013E
FY2014E
FY15E
Source: Company, Angel Research
Earnings protected by the regulated return model: NTPC, being a central public
utility, is governed by the regulated return model. CERC’s regulations for
FY2010-14 provide RoE of 15.5% on regulated equity. As per regulations, fuel
costs are a pass-through, which protect the company from cost pressures due to
increased fuel costs. NTPC has 85% of its overall output tied up under the
long-term power purchase agreement (PPA) route (regulated returns), which
ensures power off-take and stable cash flows thereof. Further, recent tariff hikes
carried out by almost all SEBs across India is expected to improve their financial
position, resulting in higher power off-take, which will benefit NTPC.
Exhibit 3: Regulated Equity
40,000
35,000
30,000
25,000
20,000
15,000
10,000
5,000
-
FY2010
FY2011
FY2012
FY2013E
FY2014E
Source: Company, Angel Research
February 6, 2013
3
Offer for Sale | Power sector
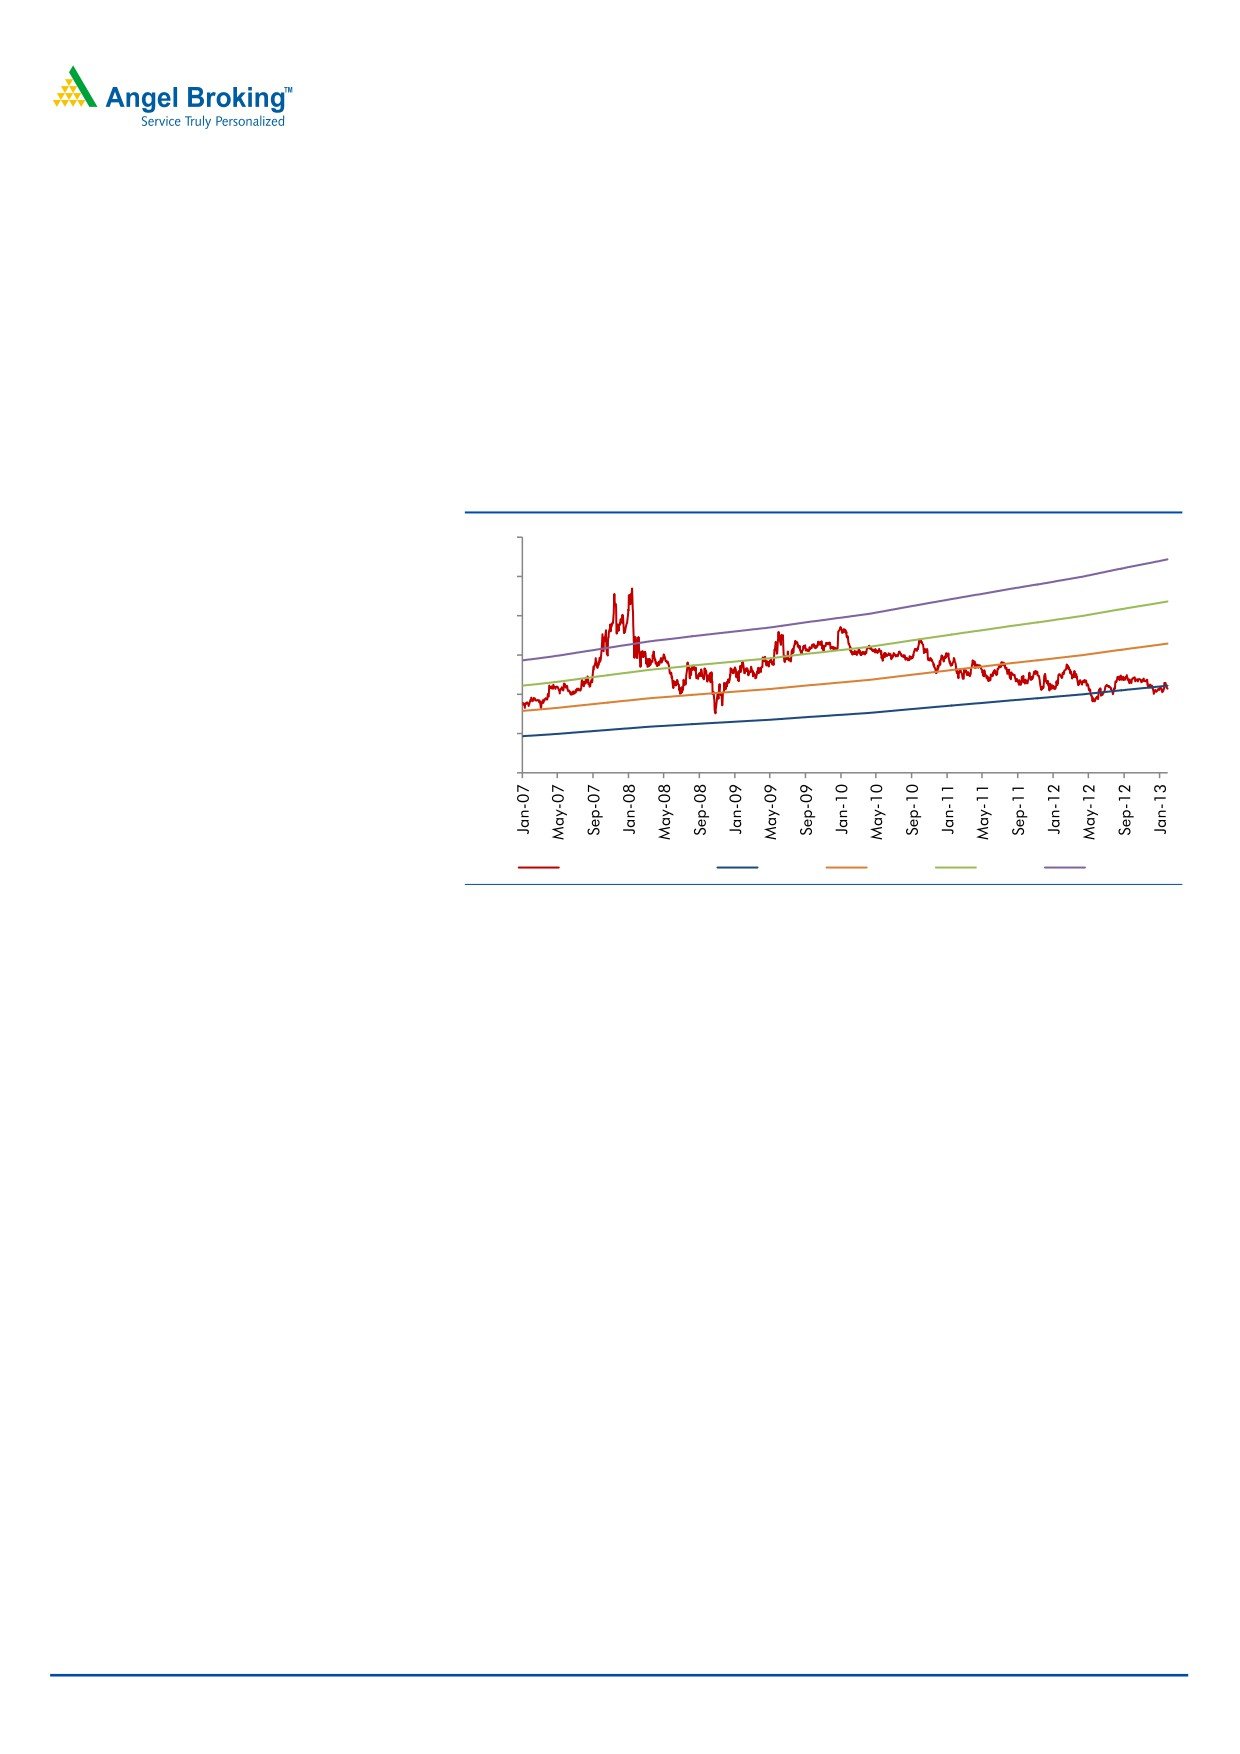
Outlook and Valuation
We expect NTPC to register a CAGR of 12.3% and 8.5% in its top-line and bottom-
line over FY2012-14E, respectively. At the offer price (which is at a 4.6% discount
to the price as on February 06, 2013), the stock would trade at 1.3x FY2014E
P/BV. Given the attractive valuation (stock trading at
1.3x FY2014E
P/BV compared to its three year trading range of 1.5x to 2.3x and median of
1.8x), we recommend Subscribe on the issue. We have assigned a multiple of
1.5x to arrive at a target price of `163.
Exhibit 4: One-year forward P/BV
350
300
250
200
150
100
50
Share Price (`)
1.5x
2.0x
2.5x
3.0x
Source: BSE, Company, Angel Research
Company Background
Established in 1975, NTPC is India's largest power generation company. NTPC has
an installed capacity of 39,674MW (including 4,864MW under JVs), spread across
28 power stations. The company's capacity has grown by
9,610MW over
FY2007-12. The company envisions being a 75,000MW company by FY2017.
NTPC enjoys healthy operational efficiency and has consistently reported high PLF
of ~90% compared to all-India PLF of ~75%.
February 6, 2013
4
Offer for Sale | Power sector
Profit and loss statement (Consolidated)
Y/E March (` cr)
FY2009
FY2010
FY2011
FY2012
FY2013E
FY2014E
Total Operating Income
44,245
48,231
57,607
64,958
72,809
81,951
% chg
14.5
9.0
19.4
12.8
12
13
Total Expenditure
33,702
35,156
44,833
50,768
55,793
62,183
Net Raw Materials
27,347
30,188
36,422
43,312
47,763
53,268
Other Mfg costs
3,823
2,446
5,488
4,207
4,570
5,143
Personnel
2,533
2,523
2,922
3,250
3,460
3,772
EBITDA
10,544
13,075
12,775
14,190
17,016
19,767
% chg
(7.6)
24.0
(2.3)
11.1
19.9
16
(% of Net Sales)
23.8
27.1
22.2
21.8
23.4
24.1
Depreciation& Amortisation
2,495
2,894
2,720
3,107
3,736
4,366
EBIT
8,049
10,180
10,055
11,083
13,280
15,402
% chg
(12.6)
26.5
(1.2)
10.2
20
16
(% of Net Sales)
18
21
17
17
18
19
Interest & other Charges
2,144
2,078
1,726
2,135
2,935
3,496
Other Income
3,402
2,947
2,401
3,873
2,984
2,934
Share in profit of Associates
-
-
-
-
-
-
Recurring PBT
9,307
11,049
10,730
12,821
13,329
14,840
Extraordinary Expense/(Inc.)
-
-
-
-
-
PBT (reported)
9,307
11,049
10,730
12,821
13,329
14,840
Tax
1,215
2,211
3,044
3,323
3,279
3,651
(% of PBT)
13.1
20.0
28.4
25.9
25
25
PAT (reported)
8,092
8,838
7,686
9,499
10,050
11,189
Less Minority Interest
-
(0.0)
(5.2)
1.9
2
2
PAT After Minority Interest
8,092
8,838
7,691
9,497
10,048
11,187
% chg
8.3
9.2
(13.0)
23.5
5.8
11.3
(% of Net Sales)
18.3
18.3
13.4
14.6
13.8
13.7
Basic EPS (`)
9.8
10.7
9.3
11.5
12.2
13.6
Fully Diluted EPS (`)
9.8
10.7
9.3
11.5
12.2
13.6
% chg
8.3
9.2
(13.0)
23.5
5.8
11.3
Note: Some of the figures from FY2011 onwards are reclassified; hence not comparable with
previous year numbers
February 6, 2013
5
Offer for Sale | Power sector
Balance Sheet (Consolidated)
Y/E March
FY2009 FY2010E FY2011 FY2012 FY2013E FY2014E
SOURCES OF FUNDS
Equity Share Capital
8,246
8,246
8,246
8,246
8,246
8,246
Reserves& Surplus
51,706
55,993
61,053
67,587
73,968
81,488
Shareholders Funds
59,951
64,239
69,298
75,833
82,214
89,734
Minority Interest
166
279
485
596
596
596
Total Loans
38,823
43,844
47,099
55,002
66,002
76,002
Deferred Tax Liability
0
230
672
764
764
764
Other long term liablities
2,469
1,792
1,792
1,792
Total Liabilities
98,940
108,592
120,023
133,987
151,368
168,888
APPLICATION OF FUNDS
Gross Block
64,741
71,527
79,210
88,882
106,882
124,882
Less: Acc. Depreciation
29,776
32,723
34,346
37,749
41,485
45,850
Net Block
34,966
38,804
44,863
51,133
65,397
79,031
Capital Work-in-Progress
30,929
37,682
41,092
50,397
54,397
57,397
Goodwill
1
1
1
1
1
1
Investments
11,696
11,778
8,357
6,545
5,545
4,545
Current Assets
33,486
33,215
41,836
45,811
46,791
49,583
Cash
17,250
16,053
17,860
18,092
15,649
14,448
Loans & Advances
9,006
6,549
18,319
16,861
18,971
21,435
Other
7,230
10,614
5,657
10,859
12,171
13,700
Current liabilities
12,137
12,908
16,590
21,275
22,138
23,044
Net Current Assets
21,349
20,307
25,246
24,536
24,653
26,539
Other non CA
-
20
463
1,375
1,375
1,375
Total Assets
98,940
108,592
120,023
133,987
151,368
168,888
Note: Some of the figures from FY2011 onwards are reclassified; hence not comparable with
previous year numbers
February 6, 2013
6
Offer for Sale | Power sector
Cash flow statement (Consolidated)
Y/E March (` cr)
FY2009 FY2010 FY2011 FY2012 FY2013E FY2014E
Profit before tax
9,307
11,049
12,392
13,137
13,329
14,840
Depreciation
2,495
2,894
2,720
3,107
3,736
4,366
Chg in WC & other adj.
(2,782)
408
(3,132)
941
(2,560)
(3,088)
Less: Other income
3,402
2,947
503
3,873
2,984
2,934
Direct taxes paid
2,566
2,799
3,044
3,323
3,279
3,651
Cash Flow from Operations
3,052
8,606
8,433
9,989
8,242
9,533
(Inc)/ Decin Fixed Assets
(11,344)
(14,009)
(10,550)
(19,477)
(22,000)
(21,000)
(Inc)/ Dec in Investments
1,751
(82)
3,820
1,612
1,000
1,000
Other income
3,402
2,947
503
3,873
2,984
2,934
Cash Flow from Investing
(6,192)
(11,144)
(6,226)
(13,992)
(18,016)
(17,066)
Issue of Equity
-
-
-
-
-
-
Inc./(Dec.) in loans
8,508
5,022
3,255
7,903
11,000
10,000
Dividend Paid (Incl. Tax)
3,478
3,682
3,654
3,669
3,669
3,669
Others
-
-
-
-
-
-
Cash Flow from Financing
5,030
1,340
(400)
4,234
7,331
6,331
Inc./(Dec.) in Cash
1,890
(1,198)
1,807
231
(2,443)
(1,202)
Opening Cash balances
15,361
17,250
16,053
17,860
18,092
15,649
Closing Cash balances
17,250
16,053
17,860
18,092
15,649
14,448
Note: Some of the figures from FY2011 onwards are reclassified; hence not comparable with
previous year numbers
February 6, 2013
7
Offer for Sale | Power sector
Key ratios
Y/E March
FY2009
FY2010
FY2011
FY2012
FY2013E
FY2014E
Valuation Ratio (x)
P/E (on FDEPS)
14.8
13.5
15.5
12.6
11.9
10.7
P/CEPS
11.3
10.2
11.5
9.5
8.7
7.7
P/BV
2.0
1.9
1.7
1.6
1.5
1.3
Dividend yield (%)
2.9
3.1
3.1
3.1
3.1
3.1
EV/Sales
2.9
2.8
2.4
2.3
2.3
2.2
EV/EBITDA
12.3
10.4
11.0
10.6
9.7
9.0
EV / Total Assets
1.3
1.3
1.2
1.1
1.1
1.1
Per Share Data (`)
EPS (Basic)
9.8
10.7
9.3
11.5
12.2
13.6
EPS (fully diluted)
9.8
10.7
9.3
11.5
12.2
13.6
Cash EPS
12.8
14.2
12.6
15.3
16.7
18.9
DPS
4.2
4.5
4.4
4.4
4.4
4.4
Book Value
72.7
77.9
84.0
92.0
99.7
108.8
DuPont Analysis
EBIT margin
18.2
21.1
17.5
17.1
18.2
18.8
Tax retention ratio
86.9
80.0
71.6
74.1
75.4
75.4
Asset turnover (x)
0.6
0.6
0.6
0.6
0.6
0.6
ROIC (Post-tax)
9.3
9.4
7.4
7.5
8.0
8.0
Cost of Debt (Post Tax)
5.4
4.0
2.7
3.1
3.7
3.7
Leverage (x)
0.6
0.7
0.7
0.7
0.8
0.8
Operating ROE
11.7
12.9
10.6
10.7
11.3
11.6
Returns (%)
ROCE (Pre-tax)
8.8
9.8
8.8
8.7
9.3
9.6
Angel ROIC (Pre-tax)
17.1
19.3
17.4
17.5
18.1
17.3
ROE
14.2
14.2
11.5
13.1
12.7
13.0
Turnover ratios (x)
Asset Turnover (Gross Block)
0.7
0.7
0.8
0.8
0.7
0.7
Inventory / Sales (days)
26
26
24
23
22
22
Receivables (days)
29
41
28
24
36
35
Payables (days)
114
130
120
136
142
133
WC cycle (ex-cash) (days)
25
32
37
39
39
47
Solvency ratios (x)
Net debt to equity
0.4
0.4
0.4
0.5
0.6
0.7
Net debt to EBITDA
2.0
2.1
2.3
2.6
3.0
3.1
Interest Coverage (EBIT / Int.)
3.8
4.9
5.8
5.2
4.5
4.4
Note: Some of the figures from FY2011 onwards are reclassified; hence not comparable with
previous year numbers
February 6, 2013
8
Offer for Sale | Power sector
Research Team Tel: 022 - 39357800
DISCLAIMER
This document is solely for the personal information of the recipient, and must not be singularly used as the basis of any investment
decision. Nothing in this document should be construed as investment or financial advice. Each recipient of this document should make
such investigations as they deem necessary to arrive at an independent evaluation of an investment in the securities of the companies
referred to in this document (including the merits and risks involved), and should consult their own advisors to determine the merits and
risks of such an investment.
Angel Broking Limited, its affiliates, directors, its proprietary trading and investment businesses may, from time to time, make
investment decisions that are inconsistent with or contradictory to the recommendations expressed herein. The views contained in this
document are those of the analyst, and the company may or may not subscribe to all the views expressed within.
Reports based on technical and derivative analysis center on studying charts of a stock's price movement, outstanding positions and
trading volume, as opposed to focusing on a company's fundamentals and, as such, may not match with a report on a company's
fundamentals.
The information in this document has been printed on the basis of publicly available information, internal data and other reliable
sources believed to be true, but we do not represent that it is accurate or complete and it should not be relied on as such, as this
document is for general guidance only. Angel Broking Limited or any of its affiliates/ group companies shall not be in any way
responsible for any loss or damage that may arise to any person from any inadvertent error in the information contained in this report.
Angel Broking Limited has not independently verified all the information contained within this document. Accordingly, we cannot testify,
nor make any representation or warranty, express or implied, to the accuracy, contents or data contained within this document. While
Angel Broking Limited endeavours to update on a reasonable basis the information discussed in this material, there may be regulatory,
compliance, or other reasons that prevent us from doing so.
This document is being supplied to you solely for your information, and its contents, information or data may not be reproduced,
redistributed or passed on, directly or indirectly.
Angel Broking Limited and its affiliates may seek to provide or have engaged in providing corporate finance, investment banking or
other advisory services in a merger or specific transaction to the companies referred to in this report, as on the date of this report or in
the past.
Neither Angel Broking Limited, nor its directors, employees or affiliates shall be liable for any loss or damage that may arise from or in
connection with the use of this information.
Note: Please refer to the important `Stock Holding Disclosure' report on the Angel website (Research Section). Also, please refer to the
latest update on respective stocks for the disclosure status in respect of those stocks. Angel Broking Limited and its affiliates may have
investment positions in the stocks recommended in this report.
Disclosure of Interest Statement
NTPC
1. Analyst ownership of the stock
No
2. Angel and its Group companies ownership of the stock
No
3. Angel and its Group companies' Directors ownership of the stock
No
4. Broking relationship with company covered
No
Note: We have not considered any Exposure below ` 1 lakh for Angel, its Group companies and Directors
Ratings (Returns):
Buy (> 15%)
Accumulate (5% to 15%)
Neutral (-5 to 5%)
Reduce (-5% to -15%)
Sell (< -15%)
February 6, 2013
9
Offer for Sale | Power sector
6th Floor, Ackruti Star, Central Road, MIDC, Andheri (E), Mumbai- 400 093. Tel: (022) 39357800
Research Team
Fundamental:
Sarabjit Kour Nangra
VP-Research, Pharmaceutical
Vaibhav Agrawal
VP-Research, Banking
Bhavesh Chauhan
Sr. Analyst (Metals & Mining)
Viral Shah
Sr. Analyst (Infrastructure)
Sharan Lillaney
Analyst (Mid-cap)
V Srinivasan
Analyst (Cement, FMCG)
Yaresh Kothari
Analyst (Automobile)
Ankita Somani
Analyst (IT, Telecom)
Sourabh Taparia
Analyst (Banking)
Bhupali Gursale
Economist
Vinay Rachh
Research Associate
Amit Patil
Research Associate
Shareen Batatawala
Research Associate
Twinkle Gosar
Research Associate
Tejashwini Kumari
Research Associate
Technicals:
Shardul Kulkarni
Sr. Technical Analyst
Sameet Chavan
Technical Analyst
Sacchitanand Uttekar
Technical Analyst
Derivatives:
Siddarth Bhamre
Head - Derivatives
Institutional Sales Team:
Mayuresh Joshi
VP - Institutional Sales
Hiten Sampat
Sr. A.V.P- Institution sales
Meenakshi Chavan
Dealer
Gaurang Tisani
Dealer
Akshay Shah
Sr. Executive
Production Team:
Tejas Vahalia
Research Editor
Dilip Patel
Production
Angel Broking Ltd: BSE Sebi Regn No : INB 010996539 / CDSL Regn No: IN - DP - CDSL - 234 - 2004 / PMS Regn Code: PM/INP000001546 Angel Securities Ltd:BSE: INB010994639/INF010994639 NSE: INB230994635/INF230994635 Membership numbers: BSE 028/NSE:09946
Angel Capital & Debt Market Ltd: INB 231279838 / NSE FNO: INF 231279838 / NSE Member code -12798 Angel Commodities Broking (P) Ltd: MCX Member ID: 12685 / FMC Regn No: MCX / TCM / CORP / 0037 NCDEX : Member ID 00220 / FMC Regn No: NCDEX / TCM / CORP / 0302
February 6, 2013
10