Market Outlook
December 31, 2015
Market Cues
Domestic Indices
Chg (%)
(Pts)
(Close)
Indian markets are expected to open flat tracking the SGX Nifty and Asian peers.
BSE Sensex
(0.5)
(119)
25,960
U.S. markets closed in the red as downbeat housing data raised concerns about the
Nifty
(0.4)
(33)
7,896
economy. The National Association of Realtors' pending home sales index fell by
Mid Cap
0.2
23
11,104
0.9% in November, as against expectations of an increase.
Small Cap
0.1
9
11,779
European markets too declined led by further drop in commodity prices leading to a
Bankex
(0.4)
(84)
19,347
drop in energy and metal/mining stocks. Trading activity remained light across both,
US and Europe ahead of Friday's New Year's Day holiday.
Global Indices
Chg (%)
(Pts)
(Close)
Indian markets closed lower led by some selling pressure ahead of the F&O expiry,
Dow Jones
(0.7)
(117)
17,604
in the absence of any other major trigger. Volumes continued to remain low led on
Nasdaq
(0.8)
(42)
5,066
account of the holiday season.
FTSE
(0.6)
(41)
6,274
News & Result Analysis
Nikkei
0.3
51
19,034
Government cancels 4th tranche of coal auction on poor response
Hang Seng
(0.5)
(117)
21,882
Detailed analysis on Pg2
Shanghai Com
0.3
9
3,573
Investor’s Ready Reckoner
Key Domestic & Global Indicators
Advances / Declines
BSE
NSE
Stock Watch: Latest investment recommendations on 150+ stocks
Advances
1,372
732
Refer P4 onwards
Declines
1,306
810
Unchanged
287
81
Top Picks
CMP
Target
Upside
Company
Sector
Rating
(`)
(`)
(%)
Volumes (` Cr)
Axis Bank
Financials
Buy
455
630
38.3
BSE
2,401
HCL Tech
IT
Buy
842
1,132
34.5
NSE
12,989
ICICI Bank
Financials
Buy
263
354
34.5
Ashok Leyland
Automobiles
Buy
90
111
24.0
Net Inflows (` Cr)
Net
Mtd
Ytd
Larsen & Toubro
Construction
Buy
1,284
1,646
28.2
More Top Picks on Pg3
FII
62
-881
16,488
MFs
233
3,381
66,240
Key Upcoming Events
Previous
Consensus
Date
Region
Event Description
Reading
Expectations
Top Gainers
Price (`)
Chg (%)
Dec 31
USA
Initial Jobless claims - Dec 26 (in `000s)
267
270
Den
114
9.3
Jan 1
China
PMI Manufacturing
49.6
49.8
Laxmimach
3,797
7.9
Jan 8
India
Imports YoY% - Dec (% change)
(30.30)
-
Jindalstel
95
4.3
Jan 8
India
Exports YoY% - Dec (% change)
(24.43)
-
Bayercrop
3,473
4.2
Adanipower
32
3.5
Top Losers
Price (`)
Chg (%)
Kscl
319
(9.5)
Sreinfra
56
(5.0)
Naukri
862
(4.1)
Pmcfin
1
(3.9)
Bfutilitie
654
(2.9)
As on December 30, 2015
Market Outlook
December 31, 2015
Government cancels 4th tranche of coal auction on poor
response
The government annulled the process for a fourth round of coal block auctions,
scheduled for the next month, on account of poor response from bidders in sectors
like steel, as well as depressed commodity prices and adverse market conditions.
The government had last month kick-started the process to auction nine blocks for
sectors like iron and steel, cement and captive power plants. The fourth round of
mines auction was slated for January 18-22.
Coal Secretary Anil Swarup stated “We have not got sufficient number of bids to
carry on with the coal block auctions. We have received 15 bids for nine blocks; so
in view of this, we had to annul the process.” The coal mines to be auctioned were
earmarked for non-regulated sectors, like iron and steel, cement and captive
power plants, which have been impacted due to adverse market conditions.
Coal secretary said that it appeared that due to slackness in demand and the
pressure in the steel and aluminum industry, which consumes most of the coal
within the country, there were not many bids. He added the government will wait
for the right time for the sale of these mines. "We will look at the market situation
and offer again. Right now it appears that in general commodity prices are
depressed so are the coal prices... companies that would have bid are not
financially strong at this point of time," he said.
The coal blocks, which were to be put under the hammer were Brahmapuri and
Suliyari in Madhya Pradesh, Bundu and Gondulpura in Jharkhand, Gondkhari
and Khappa & Extn in Maharashtra and Jaganathpur A and Jaganathpur B in
West Bengal besides Bhaskarpara mine in Chhattisgarh.
Economic and Political News
Government approves amended TUF Scheme, to create over 3 million jobs
Government stares at `50,000cr shortfall in disinvestment proceeds
State govts likely to borrow up to `1.05 lakh crore in Mar quarter: RBI
Corporate News
Dr Reddy's re-launches Nexium generic version in the US
Amtek Auto pledges 71% stake in JMT Auto with IL&FS Trust Company
Prakash Steelage to sell 12.47% more stake in JV to Tubacex of Spain
Essar Oil completes delisting of shares
Market Outlook
December 31, 2015
Top Picks HHHHH
Large Cap
Market Cap
CMP
Target
Upside
Company
Rationale
(` Cr)
(`)
(`)
(%)
To outpace battery industry growth due to better technological
Amara Raja Batteries
14,778
865
1,040
20.2
products leading to market share gains in both the automotive
OEM and replacement segments.
Earnings to grow strongly given the MHCV cyclical upturn.
Ashok Leyland
25,471
90
111
24.0
Focus on exports and LCV's provides additional growth
avenue.
Healthy pace of branch expansion, backed by distribution
Axis Bank
1,08,270
455
630
38.3
network, will be the driving force for the bank’s retail business
and overall earnings.
The stock is trading at attractive valuations and is factoring all
HCL Tech
1,18,648
842
1,132
34.5
the bad news.
Strong visibility for a robust 20% earnings trajectory, coupled
HDFC Bank
2,71,219
1,074
1,262
17.5
with high quality of earnings on account of high quality retail
business and strategic focus on highly rated corporates.
Due to its robust franchise and capital adequacy position, the
bank is well positioned to grow by at least a few percentage
ICICI Bank
1,52,914
263
354
34.5
points higher than the average industry growth rate from a
structural point of view.
Back on the growth trend, expect a long term growth of 14%
Infosys
2,49,460
1,086
1,306
20.3
to be a US$20bn in FY2020.
Well positioned to benefit from such expected gradual
recovery in the overall domestic capex cycle, given its presence
Larsen & Toubro
1,19,596
1,284
1,646
28.2
across various infrastructure segments, its execution
capabilities, and its strong balance sheet.
LICHF continues to grow its retail loan book at a healthy pace
with improvement in asset quality. We expect the company to
LIC Housing Finance
25,253
500
571
14.1
post a healthy loan book which is likely to reflect in a strong
earnings growth.
Source: Company, Angel Research
Mid Cap
Market Cap
CMP
Target
Upside
Company
Rationale
(` Cr)
(`)
(`)
(%)
Favourable outlook for the AC industry to augur well for
Cooling products business which is out pacing the market
Blue Star
3,445
383
429
12.0
growth. EMPPAC division's profitability to improve once
operating environment turns around.
Change in business focus towards high-margin chronic &
Ipca labs
9,447
749
900
20.2
lifestyle segments and increasing penetration in Europe and
US
Economic recovery to have favourable impact on advertising &
circulation revenue growth. Further, the acquisition of a radio
Jagran Prakashan
5,203
159
169
6.2
business (Radio City) would also boost the company's revenue
growth.
Earnings boost on back of stable material prices and
Radico Khaitan
1,531
115
156
35.6
favourable pricing environment. Valuation discount to peers
provides additional comfort
Strong brands and distribution network would boost growth
Siyaram Silk Mills
1,135
1,211
1,354
11.8
going ahead. Stock currently trades at an inexpensive
valuation.
Structural shift in the Lighting industry towards LED lighting will
Surya Roshni
623
142
183
28.8
drive growth.
Source: Company, Angel Research
Market Outlook
December 31, 2015
Key Upcoming Events
Global economic events release calendar
Date
Time
Country
Event Description
Unit
Period
Bloomberg Data
Last Reported Estimated
Dec 31, 2015
7:00PM
US
Initial Jobless claims
Thousands
Dec 26
267.00
270.00
Jan 1, 2016
6:30AM
China
PMI Manufacturing
Value
Dec
49.60
49.80
Jan 4, 2016
2:25PM
Germany
PMI Manufacturing
Value
Dec F
53.00
53.00
3:00PM
UK
PMI Manufacturing
Value
Dec
52.70
52.90
Jan 5, 2016
2:25PM
Germany
Unemployment change (000's)
Thousands
Dec
(13.00)
(8.00)
Jan 6, 2016
2:25PM
Germany
PMI Services
Value
Dec F
55.40
55.40
Jan 7, 2016
3:30PM
Euro Zone
Euro-Zone Consumer Confidence
Value
Dec F
(5.70)
(5.70)
Jan 8, 2016
India
Imports YoY%
% Change
Dec
(30.30)
--
India
Exports YoY%
% Change
Dec
(24.43)
--
7:00PM
US
Change in Nonfarm payrolls
Thousands
Dec
211.00
200.00
7:00PM
US
Unnemployment rate
%
Dec
5.00
5.00
Jan 9, 2016
7:00AM
China
Consumer Price Index (YoY)
% Change
Dec
1.50
1.50
Jan 12, 2016
5:30PM
India
Industrial Production YoY
% Change
Nov
9.80
--
3:00PM
UK
Industrial Production (YoY)
% Change
Nov
1.70
--
Jan 14, 2016
12:00PM
India
Monthly Wholesale Prices YoY%
% Change
Dec
(1.99)
--
5:30PM
UK
BOE Announces rates
% Ratio
Jan 14
0.50
0.50
Jan 15, 2016
7:45PM
US
Industrial Production
%
Dec
(0.56)
--
US
Producer Price Index (mom)
% Change
Dec
0.10
--
Jan 19, 2016
3:00PM
UK
CPI (YoY)
% Change
Dec
0.10
--
7:30AM
China
Industrial Production (YoY)
% Change
Dec
6.20
--
7:30AM
China
Real GDP (YoY)
% Change
4Q
6.90
--
Jan 20, 2016
7:00PM
US
Housing Starts
Thousands
Dec
1,173.00
--
7:00PM
US
Building permits
Thousands
Dec
1,282.00
--
3:00PM
UK
Jobless claims change
% Change
Dec
3.90
--
7:00PM
US
Consumer price index (mom)
% Change
Dec
--
--
Jan 21, 2016
3:30PM
Euro Zone
Euro-Zone CPI (YoY)
%
Dec F
0.20
--
6:15PM
Euro Zone
ECB announces interest rates
%
Jan 21
0.05
--
Jan 22, 2016
8:30PM
US
Existing home sales
Million
Dec
4.76
--
Jan 27, 2016
8:30PM
US
New home sales
Thousands
Dec
490.00
--
Jan 28, 2016
3:00PM
UK
GDP (YoY)
% Change
4Q A
2.10
--
12:30AM
US
FOMC rate decision
%
Jan 27
0.50
0.50
Jan 29, 2016
7:00PM
US
GDP Qoq (Annualised)
% Change
4Q A
2.00
--
Source: Bloomberg, Angel Research
Market Outlook
December 31, 2015
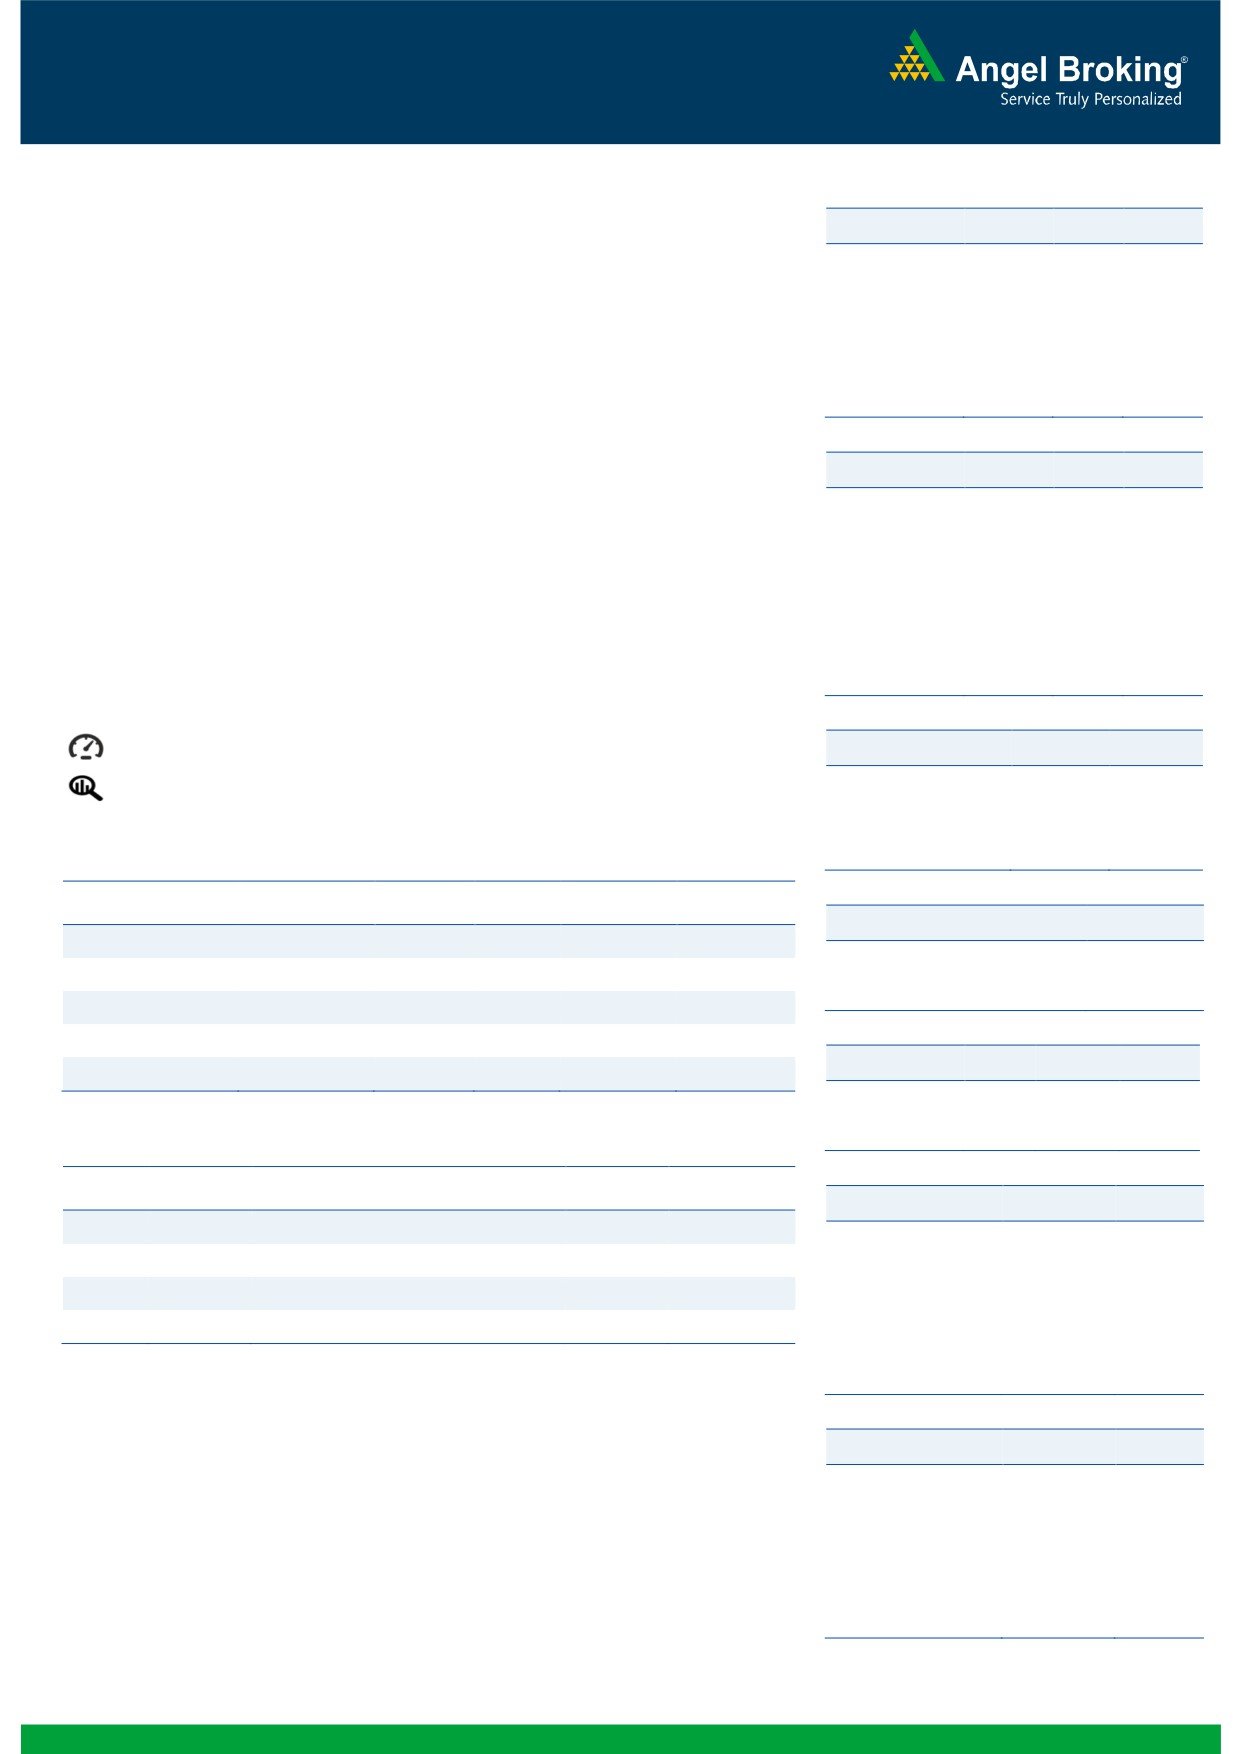
Macro watch
Exhibit 1: Quarterly GDP trends
Exhibit 2: IIP trends
(%)
(%)
9.0
8.4
12.0
9.8
8.0
7.5
7.5
7.4
10.0
7.0
7.0
6.7
6.7
6.6
7.0
6.4
8.0
6.3
6.0
6.0
4.8
5.0
4.2
4.3
4.7
3.6
3.8
5.0
4.0
2.8
3.0
2.5
2.5
4.0
2.0
3.0
-
Source: CSO, Angel Research
Source: MOSPI, Angel Research
Exhibit 3: Monthly CPI inflation trends
Exhibit 4: Manufacturing and services PMI
(%)
56.0
Mfg. PMI
Services PMI
6.0
5.4
5.3
5.4
5.4
5.2
5.0
5.0
54.0
4.9
5.0
4.3
4.4
3.7
3.7
52.0
4.0
3.0
50.0
2.0
48.0
1.0
46.0
-
44.0
Source: MOSPI, Angel Research
Source: Market, Angel Research; Note: Level above 50 indicates expansion
Exhibit 5: Exports and imports growth trends
Exhibit 6: Key policy rates
(%)
Exports yoy growth
Imports yoy growth
(%)
Repo rate
Reverse Repo rate
CRR
0.0
8.00
(5.0)
7.50
7.00
(10.0)
6.50
(15.0)
6.00
5.50
(20.0)
5.00
(25.0)
4.50
4.00
(30.0)
3.50
(35.0)
3.00
Source: Bloomberg, Angel Research
Source: RBI, Angel Research
Market Outlook
December 31, 2015
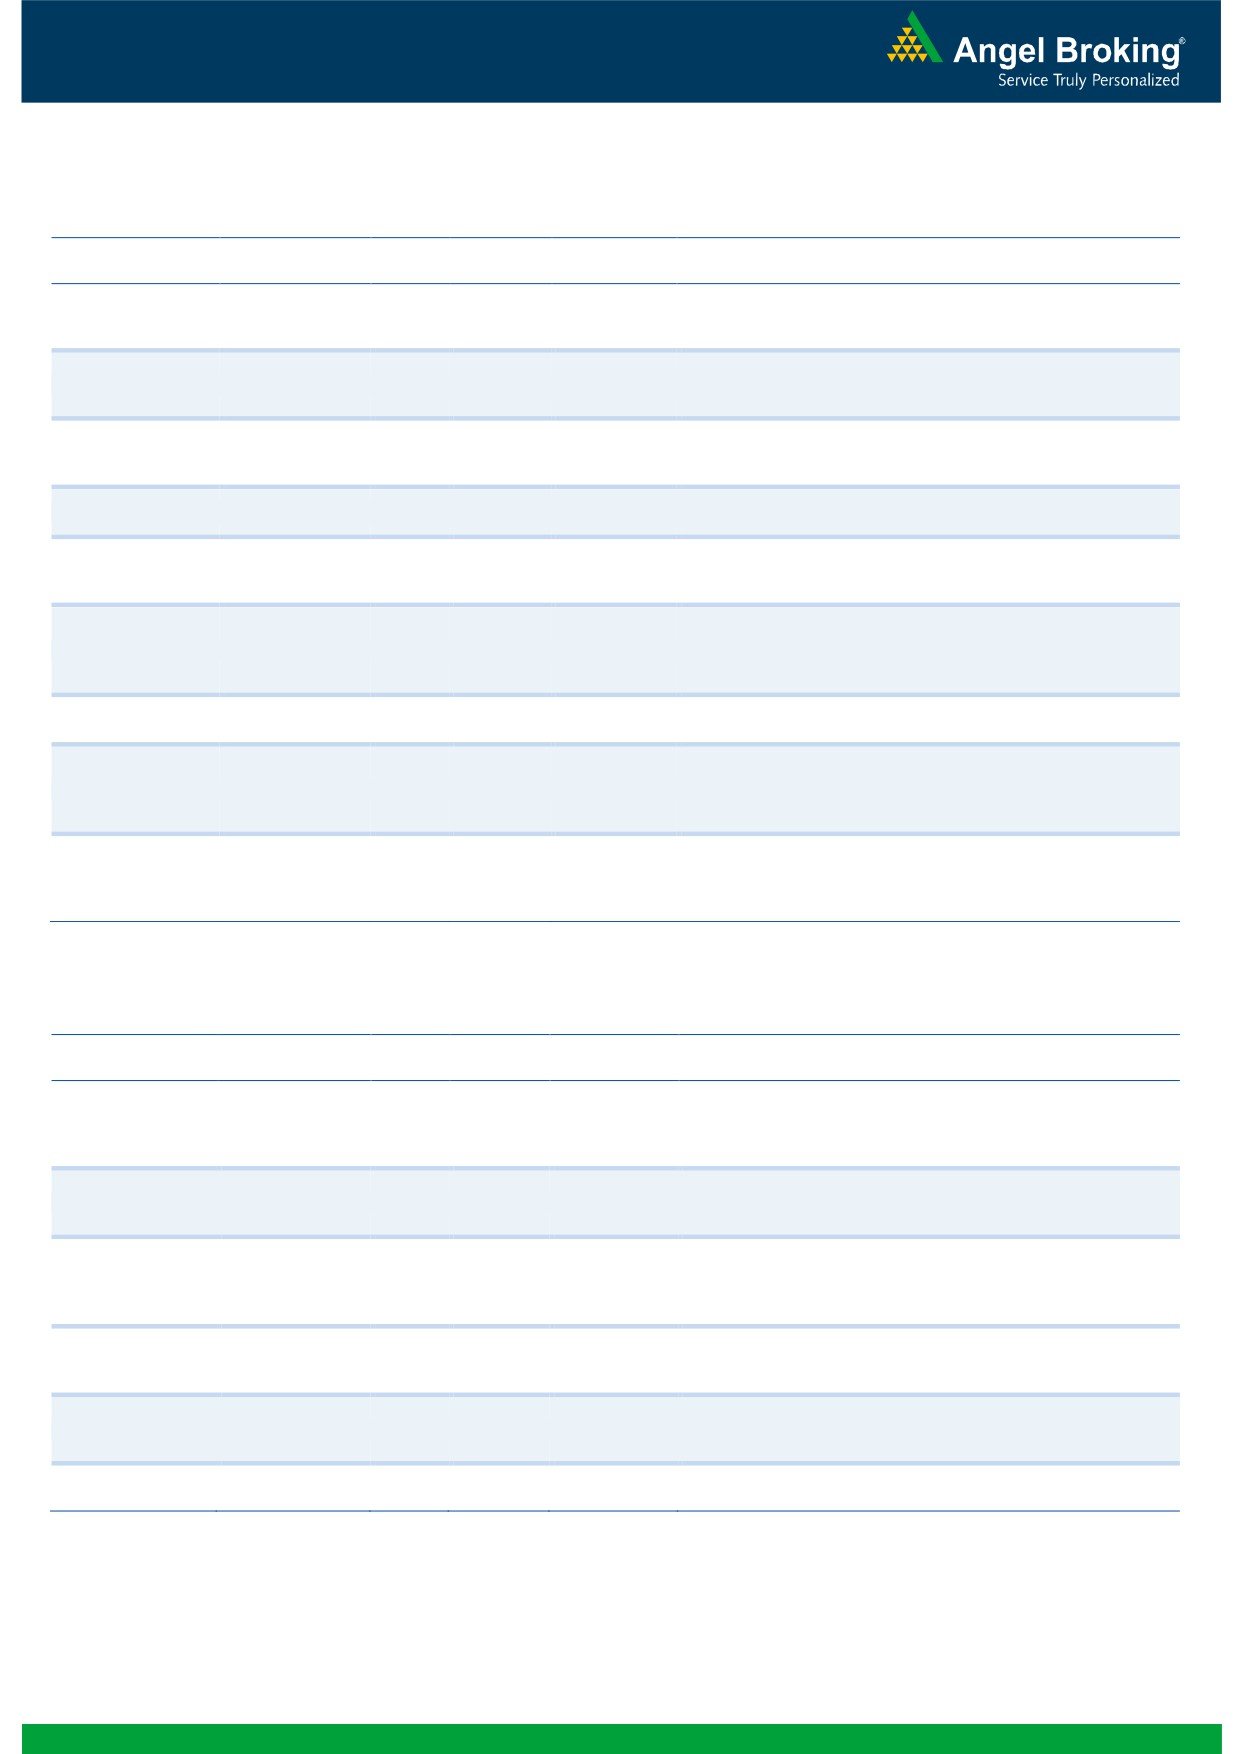
Global watch
Exhibit 1: Latest quarterly GDP Growth (%, yoy) across select developing and developed countries
(%)
8.0
6.9
6.0
5.3
4.7
4.7
4.0
2.9
2.1
2.1
1.8
2.0
1.0
1.1
1.6
-
(2.0)
(4.0)
(4.1)
(4.5)
(6.0)
Source: Bloomberg, Angel Research
Exhibit 2: 2015 GDP Growth projection by IMF (%, yoy) across select developing and developed countries
(%)
7.3
8.0
6.8
6.0
4.7
4.7
4.0
2.5
2.5
2.6
1.4
1.5
2.0
1.2
0.6
(3.8)
-
(2.0)
(4.0)
(3.0)
(6.0)
Source: IMF, Angel Research
Exhibit 3: One year forward P-E ratio across select developing and developed countries
(x)
20.0
18.0
16.0
14.0
12.0
10.0
8.0
6.0
4.0
2.0
-
Source: IMF, Angel Research
Market Outlook
December 31, 2015
Exhibit 4: Relative performance of indices across globe
Returns (%)
Country
Name of index
Closing price
1M
3M
1YR
Brazil
Bovespa
43,350
(8.1)
(4.3)
(12.7)
Russia
Micex
1,761
(0.5)
7.2
22.9
India
Nifty
7,896
(0.6)
0.6
(3.4)
China
Shanghai Composite
3,573
3.3
15.5
14.2
South Africa
Top 40
45,901
(2.1)
3.9
4.4
Mexico
Mexbol
43,012
(2.8)
2.7
(0.0)
Indonesia
LQ45
792
0.2
13.2
(8.4)
Malaysia
KLCI
1,693
0.6
4.8
(2.9)
Thailand
SET 50
814
(7.0)
(6.7)
(19.7)
USA
Dow Jones
17,604
(1.1)
9.7
(1.2)
UK
FTSE
6,274
(1.9)
6.2
(4.2)
Japan
Nikkei
19,034
(4.3)
6.4
10.6
Germany
DAX
10,743
(5.1)
13.7
13.4
France
CAC
4,677
(5.1)
5.0
13.7
Source: Bloomberg, Angel Research
Stock Watch
December 31, 2015
Company Name
Reco
CMP
Target
Mkt Cap
Sales ( Čcr )
OPM(%)
EPS (Č)
PER(x)
P/BV(x)
RoE(%)
EV/Sales(x)
(Č)
Price ( Č)
( Č cr )
FY16E FY17E
FY16E
FY17E
FY16E
FY17E
FY16E
FY17E
FY16E
FY17E
FY16E
FY17E
FY16E
FY17E
Agri / Agri Chemical
Rallis
Neutral
177
-
3,439
2,075
2,394
14.4
14.4
9.5
11.0
18.6
16.1
3.7
3.2
21.1
21.3
1.7
1.5
United Phosphorus
Buy
434
510
18,604
13,698
15,752
17.6
17.6
32.1
38.5
13.5
11.3
2.7
2.2
21.4
21.3
1.5
1.2
Auto & Auto Ancillary
Ashok Leyland
Buy
90
111
25,471
17,995
21,544
11.4
11.6
3.4
4.7
26.3
19.0
4.6
4.2
17.7
22.2
1.4
1.1
Bajaj Auto
Accumulate
2,516
2,728
72,790
23,695
27,298
21.3
20.4
134.6
151.5
18.7
16.6
5.9
5.1
31.8
30.6
2.6
2.3
Bharat Forge
Accumulate
896
943
20,869
7,867
8,881
20.0
20.3
34.4
41.0
26.1
21.9
5.1
4.2
21.1
20.9
2.8
2.4
Eicher Motors
Buy
16,530
19,036
44,885
15,379
16,498
15.6
16.6
473.2
574.8
34.9
28.8
12.9
9.6
36.7
33.2
2.8
2.6
Gabriel India
Accumulate
96
101
1,375
1,415
1,544
8.7
9.0
4.6
5.4
20.8
17.7
3.8
3.4
18.1
18.9
0.9
0.8
Hero Motocorp
Neutral
2,712
-
54,148
28,561
31,559
14.7
14.7
151.1
163.2
18.0
16.6
7.0
5.9
38.7
35.6
1.7
1.5
Jamna Auto Industries Neutral
139
-
1,109
1,292
1,486
9.3
9.8
6.0
7.5
23.1
18.5
4.8
4.1
20.7
21.8
0.9
0.8
L G Balakrishnan & Bros Neutral
518
-
814
1,254
1,394
11.6
11.8
35.9
41.7
14.5
12.5
2.0
1.7
13.5
13.8
0.8
0.7
Mahindra and Mahindra Accumulate
1,262
1,449
78,400
39,031
44,440
13.8
13.9
57.9
67.6
21.8
18.7
3.5
3.1
16.1
16.6
1.7
1.4
Maruti
Neutral
4,588
-
138,608
57,865
68,104
16.4
16.7
176.3
225.5
26.0
20.4
5.1
4.3
19.4
21.2
2.2
1.8
Minda Industries
Neutral
934
-
1,483
2,567
2,965
8.0
8.3
46.1
57.8
20.3
16.2
3.4
2.8
16.7
17.3
0.7
0.6
Motherson Sumi
Accumulate
294
313
38,901
39,343
45,100
8.8
9.1
10.1
12.5
29.1
23.5
9.2
7.2
35.3
34.4
1.1
0.9
Rane Brake Lining
Accumulate
342
366
270
454
511
11.1
11.4
23.8
28.1
14.4
12.2
2.0
1.9
14.2
15.3
0.7
0.7
Setco Automotive
Neutral
43
-
572
594
741
12.7
13.7
1.7
3.2
25.2
13.4
2.6
2.3
10.4
16.9
1.4
1.2
Tata Motors
Neutral
394
-
113,611
255,254
301,772
12.9
13.4
23.7
37.3
16.6
10.6
2.0
1.7
7.4
12.1
0.6
0.6
TVS Motor
Buy
290
338
13,787
11,569
13,648
7.3
8.7
10.3
16.1
28.2
18.0
7.0
5.5
24.8
30.5
1.2
1.0
Amara Raja Batteries
Buy
865
1,040
14,778
4,892
5,871
17.4
17.6
28.8
37.1
30.0
23.3
7.0
5.6
23.4
24.1
3.0
2.4
Exide Industries
Accumulate
147
162
12,495
6,950
7,784
14.4
14.8
6.6
7.3
22.3
20.1
2.8
2.6
12.6
12.8
1.5
1.4
Apollo Tyres
Accumulate
155
171
7,900
12,146
12,689
16.8
16.0
21.2
19.0
7.3
8.2
1.2
1.1
16.5
13.0
0.7
0.8
Ceat
Accumulate
1,048
1,119
4,239
6,041
6,597
14.1
13.7
99.5
111.9
10.5
9.4
2.1
1.7
19.6
18.5
0.9
0.7
JK Tyres
Neutral
108
-
2,447
7,446
7,669
15.2
14.0
19.6
18.4
5.5
5.9
1.4
1.2
25.2
19.5
0.7
0.6
Swaraj Engines
Neutral
958
-
1,190
552
630
14.2
14.7
44.6
54.1
21.5
17.7
5.0
4.5
23.2
25.6
2.0
1.7
Subros
Neutral
109
-
654
1,268
1,488
11.6
11.9
3.7
6.6
29.5
16.5
2.0
1.8
6.8
11.4
0.8
0.7
Indag Rubber
Neutral
205
-
539
283
329
17.0
17.2
13.0
15.4
15.8
13.3
3.5
2.9
21.8
21.6
1.6
1.3
Capital Goods
ACE
Neutral
46
-
450
660
839
4.7
8.2
1.0
3.9
45.5
11.7
1.4
1.3
3.2
11.3
0.8
0.7
BEML
Neutral
1,280
-
5,330
3,277
4,006
6.0
8.9
29.2
64.3
43.8
19.9
2.5
2.2
5.7
11.7
1.7
1.4
Bharat Electronics
Neutral
1,352
-
32,459
7,737
8,634
16.8
17.2
54.0
61.0
25.1
22.2
3.6
3.2
39.3
45.6
3.3
2.8
Stock Watch
December 31, 2015
Company Name
Reco
CMP
Target
Mkt Cap
Sales ( Čcr )
OPM(%)
EPS (Č)
PER(x)
P/BV(x)
RoE(%)
EV/Sales(x)
(Č)
Price ( Č)
( Č cr )
FY16E
FY17E
FY16E
FY17E
FY16E
FY17E
FY16E
FY17E
FY16E
FY17E
FY16E
FY17E
FY16E
FY17E
Capital Goods
Voltas
Accumulate
317
353
10,473
5,363
5,963
8.0
9.1
11.0
13.8
28.8
22.9
4.4
3.9
16.2
17.9
1.9
1.7
BGR Energy
Neutral
132
-
955
3,615
3,181
9.5
9.4
16.7
12.4
7.9
10.7
0.7
0.7
10.0
7.0
0.7
0.8
BHEL
Neutral
170
-
41,487
33,722
35,272
10.8
11.7
10.5
14.2
16.1
11.9
1.2
1.1
7.0
9.0
1.3
1.3
Blue Star
Accumulate
383
429
3,445
3,548
3,977
6.3
6.9
13.7
17.2
28.0
22.3
7.0
4.6
26.1
25.4
1.1
0.9
Crompton Greaves
Accumulate
191
204
11,955
13,484
14,687
4.9
6.2
4.5
7.1
42.4
26.9
3.0
2.8
7.2
10.8
1.0
0.9
Inox Wind
Buy
361
458
8,008
4,980
5,943
17.0
17.5
26.6
31.6
13.6
11.4
4.1
3.0
35.0
30.0
1.8
1.4
KEC International
Neutral
155
-
3,973
8,791
9,716
6.1
6.8
5.4
8.2
28.6
18.9
2.9
2.6
10.0
14.0
0.7
0.6
Thermax
Neutral
912
-
10,872
6,413
7,525
7.4
8.5
30.5
39.3
29.9
23.2
4.6
4.0
15.0
17.0
1.7
1.4
Cement
ACC
Buy
1,350
1,630
25,342
13,151
14,757
16.4
18.3
63.9
83.4
21.1
16.2
2.7
2.5
13.3
16.1
1.8
1.5
Ambuja Cements
Accumulate
205
233
31,744
11,564
12,556
19.4
20.7
8.9
10.1
23.0
20.3
2.9
2.7
12.8
13.8
2.4
2.2
HeidelbergCement
Neutral
80
-
1,813
1,772
1,926
13.3
15.4
1.0
3.0
80.0
26.7
2.0
1.9
2.6
7.9
1.6
1.4
India Cements
Buy
91
112
2,791
4,216
4,840
18.0
19.5
4.0
9.9
22.7
9.2
0.9
0.8
4.0
9.5
1.0
0.8
JK Cement
Buy
603
744
4,217
3,661
4,742
10.1
15.8
18.0
61.0
33.5
9.9
2.4
2.1
7.5
22.9
1.6
1.2
J K Lakshmi Cement
Buy
330
430
3,888
2,947
3,616
16.7
19.9
11.5
27.2
28.7
12.2
2.7
2.4
9.8
20.8
1.7
1.4
Mangalam Cements
Neutral
195
-
521
1,053
1,347
10.5
13.3
8.4
26.0
23.2
7.5
1.0
0.9
4.3
12.5
0.9
0.6
Orient Cement
Buy
150
183
3,072
1,854
2,524
21.2
22.2
7.7
11.1
19.5
13.5
2.8
2.4
13.3
15.7
2.4
1.7
Ramco Cements
Neutral
378
-
8,987
4,036
4,545
20.8
21.3
15.1
18.8
25.0
20.1
3.1
2.7
12.9
14.3
2.7
2.4
Shree Cement^
Neutral
11,234
-
39,137
7,150
8,742
26.7
28.6
228.0
345.5
49.3
32.5
7.3
6.1
15.7
20.3
5.2
4.2
UltraTech Cement
Buy
2,788
3,282
76,497
25,021
30,023
19.1
21.6
89.0
132.0
31.3
21.1
3.6
3.2
12.2
15.9
3.1
2.6
Construction
ITNL
Neutral
86
-
2,837
7,360
8,825
34.0
35.9
7.0
9.0
12.3
9.6
0.4
0.4
3.2
3.7
3.7
3.6
KNR Constructions
Buy
580
673
1,630
937
1,470
14.3
14.0
33.5
38.6
17.3
15.0
2.6
2.3
15.4
15.4
1.8
1.2
Larsen & Toubro
Buy
1,284
1,646
119,596
65,065
77,009
11.5
11.7
61.5
65.6
20.9
19.6
2.1
1.9
13.4
14.0
2.0
1.7
Gujarat Pipavav Port
Neutral
143
-
6,889
629
684
51.0
52.2
6.4
5.9
22.3
24.2
2.9
2.7
15.9
12.7
10.6
9.6
MBL Infrastructures
Buy
221
285
916
2,313
2,797
12.2
14.6
19.0
20.0
11.6
11.0
1.2
1.1
11.3
10.6
1.1
1.0
Nagarjuna Const.
Neutral
77
-
4,292
7,892
8,842
8.8
9.1
3.0
5.3
25.7
14.6
1.3
1.2
5.0
8.5
0.8
0.7
PNC Infratech
Neutral
533
-
2,735
1,873
2,288
13.2
13.5
24.0
32.0
22.2
16.7
2.2
1.9
12.1
12.3
1.6
1.3
Simplex Infra
Neutral
315
-
1,559
5,955
6,829
10.3
10.5
16.0
31.0
19.7
10.2
1.0
1.0
5.3
9.9
0.8
0.7
Power Mech Projects
Neutral
656
-
965
1,539
1,801
12.8
12.7
59.0
72.1
11.1
9.1
1.7
1.4
18.6
16.8
0.6
0.5
Sadbhav Engineering
Neutral
342
-
5,872
3,481
4,219
10.7
10.8
8.0
12.0
42.8
28.5
4.0
3.5
10.3
13.5
2.0
1.6
Stock Watch
December 31, 2015
Company Name
Reco
CMP
Target
Mkt Cap
Sales ( Čcr )
OPM(%)
EPS (Č)
PER(x)
P/BV(x)
RoE(%)
EV/Sales(x)
(Č)
Price ( Č)
( Č cr )
FY16E
FY17E
FY16E
FY17E
FY16E
FY17E
FY16E
FY17E
FY16E
FY17E
FY16E
FY17E
FY16E
FY17E
Construction
NBCC
Accumulate
985
1,089
11,822
7,382
9,506
7.7
8.6
39.8
54.4
24.8
18.1
6.0
4.7
26.7
29.1
1.4
1.0
MEP Infra
Neutral
47
-
758
1,956
1,876
28.1
30.5
1.3
3.0
35.9
15.5
7.5
5.1
21.2
32.8
1.8
1.8
SIPL
Neutral
97
-
3,431
675
1,042
62.4
64.7
-
-
3.7
4.2
-
-
16.7
11.3
Financials
Allahabad Bank
Neutral
69
-
4,132
8,569
9,392
2.8
2.9
16.3
27.5
4.2
2.5
0.4
0.3
7.6
11.9
-
-
Axis Bank
Buy
455
630
108,270
26,473
31,527
3.5
3.6
35.7
43.5
12.7
10.5
2.5
2.1
17.9
18.9
-
-
Bank of Baroda
Neutral
156
-
35,991
18,485
21,025
1.9
2.0
13.5
21.1
11.6
7.4
0.9
0.8
7.3
10.6
-
-
Bank of India
Neutral
115
-
9,139
15,972
17,271
1.9
2.0
15.3
33.4
7.5
3.5
0.3
0.3
3.6
7.6
-
-
Canara Bank
Neutral
237
-
12,869
15,441
16,945
2.0
2.1
46.6
70.4
5.1
3.4
0.5
0.4
8.0
11.2
-
-
Dena Bank
Neutral
41
-
2,649
3,440
3,840
2.1
2.3
7.3
10.0
5.7
4.1
0.4
0.4
6.1
7.9
-
-
Federal Bank
Neutral
56
-
9,686
3,477
3,999
3.0
3.0
5.0
6.2
11.2
9.0
1.1
1.0
10.6
11.9
-
-
HDFC
Neutral
1,233
-
194,689
10,358
11,852
3.3
3.3
41.1
47.0
30.0
26.2
5.7
5.2
24.7
24.9
-
-
HDFC Bank
Buy
1,074
1,262
271,219
38,309
47,302
4.3
4.3
49.3
61.1
21.8
17.6
3.8
3.2
18.5
19.7
-
-
ICICI Bank
Buy
263
354
152,914
34,279
39,262
3.3
3.3
21.0
24.4
12.5
10.8
2.1
1.8
14.4
14.7
-
-
IDBI Bank
Neutral
90
-
14,468
9,625
10,455
1.8
1.8
8.5
14.2
10.6
6.4
0.7
0.6
5.9
9.3
-
-
Indian Bank
Neutral
115
-
5,511
6,160
6,858
2.5
2.5
24.5
29.8
4.7
3.9
0.4
0.3
7.7
8.6
-
-
LIC Housing Finance
Accumulate
500
571
25,253
3,101
3,745
2.5
2.5
33.0
40.2
15.2
12.5
2.8
2.4
19.7
20.5
-
-
Oriental Bank
Neutral
138
-
4,151
7,643
8,373
2.4
2.4
37.2
45.4
3.7
3.1
0.3
0.3
8.2
9.4
-
-
Punjab Natl.Bank
Neutral
118
-
23,121
23,638
26,557
2.8
2.8
17.9
27.2
6.6
4.3
0.7
0.5
8.5
12.0
-
-
South Ind.Bank
Neutral
20
-
2,633
1,965
2,185
2.5
2.5
2.5
3.3
7.8
5.9
0.8
0.7
9.5
11.7
-
-
St Bk of India
Buy
226
283
175,284
82,520
93,299
2.7
2.8
20.0
24.5
11.3
9.2
1.2
1.1
11.5
12.8
-
-
Union Bank
Neutral
150
-
10,291
12,646
14,129
2.3
2.4
31.0
39.1
4.8
3.8
0.5
0.4
9.8
11.4
-
-
Vijaya Bank
Neutral
34
-
2,912
3,536
3,827
1.9
1.9
5.5
6.7
6.1
5.1
0.5
0.5
7.8
8.8
-
-
Yes Bank
Buy
734
921
30,761
7,190
9,011
3.2
3.3
58.2
69.7
12.6
10.5
2.3
1.9
19.2
19.6
-
-
FMCG
Asian Paints
Neutral
877
-
84,131
16,553
19,160
16.0
16.2
17.7
21.5
49.6
40.8
13.2
11.9
29.4
31.2
4.9
4.2
Britannia
Neutral
2,972
-
35,654
8,065
9,395
9.6
10.2
47.2
65.5
62.9
45.4
20.9
19.8
38.3
41.2
4.3
3.7
Colgate
Neutral
973
-
26,461
4,836
5,490
19.5
19.7
48.5
53.2
20.1
18.3
14.7
12.8
99.8
97.5
5.4
4.7
Dabur India
Neutral
275
-
48,412
9,370
10,265
17.1
17.2
7.3
8.1
37.5
34.0
11.3
9.2
33.7
30.6
5.1
4.6
GlaxoSmith Con*
Neutral
6,190
-
26,033
4,919
5,742
17.2
17.4
168.3
191.2
36.8
32.4
10.4
8.9
28.8
28.9
4.9
4.1
Godrej Consumer
Neutral
1,282
-
43,663
10,168
12,886
16.1
16.1
32.1
38.4
40.0
33.4
8.1
7.5
19.7
21.0
4.4
3.5
Stock Watch
December 31, 2015
Company Name
Reco
CMP
Target
Mkt Cap
Sales ( Čcr )
OPM(%)
EPS (Č)
PER(x)
P/BV(x)
RoE(%)
EV/Sales(x)
(Č)
Price ( Č)
( Č cr )
FY16E FY17E
FY16E
FY17E
FY16E
FY17E
FY16E
FY17E
FY16E
FY17E
FY16E
FY17E
FY16E
FY17E
FMCG
HUL
Neutral
859
-
185,974
34,940
38,957
17.5
17.7
20.8
24.7
41.3
34.8
46.0
36.7
110.5
114.2
5.1
4.6
ITC
Buy
327
382
262,438
41,068
45,068
37.8
37.4
13.9
15.9
23.5
20.5
7.9
6.9
34.1
33.8
6.0
5.4
Marico
Buy
226
363
29,093
6,551
7,766
15.7
16.0
10.4
12.5
21.7
18.0
6.3
5.2
33.2
32.4
4.4
3.7
Nestle*
Accumulate
5,822
6,646
56,138
11,291
12,847
22.2
22.3
158.9
184.6
36.6
31.5
19.2
17.2
55.0
57.3
4.8
4.2
Tata Global
Neutral
146
-
9,237
8,635
9,072
9.8
9.9
6.5
7.6
22.5
19.3
2.2
2.2
6.8
7.4
1.0
1.0
IT
HCL Tech^
Buy
842
1,132
118,648
42,038
47,503
23.2
23.5
55.8
62.9
15.1
13.4
3.5
2.7
23.0
19.8
2.4
1.9
Infosys
Buy
1,086
1,306
249,460
60,250
66,999
28.0
28.0
58.3
63.7
18.6
17.1
3.9
3.4
20.9
19.7
3.5
3.0
TCS
Buy
2,418
3,165
476,528
111,274
126,852
28.4
28.7
125.4
143.9
19.3
16.8
7.6
7.0
39.9
42.2
3.9
3.4
Tech Mahindra
Buy
523
646
50,595
25,566
28,890
16.0
17.0
26.3
31.9
19.9
16.4
3.6
3.1
17.9
18.6
1.8
1.5
Wipro
Buy
558
719
137,896
52,414
58,704
23.7
23.8
38.4
42.3
14.5
13.2
2.8
2.5
19.5
18.0
2.2
1.8
Media
D B Corp
Accumulate
328
356
6,021
2,241
2,495
27.8
27.9
21.8
25.6
15.1
12.8
3.9
3.5
26.7
28.5
2.6
2.4
HT Media
Neutral
92
-
2,152
2,495
2,603
11.2
11.2
7.3
8.6
12.7
10.8
1.0
0.9
7.4
8.1
0.4
0.3
Jagran Prakashan
Accumulate
159
169
5,203
2,170
2,355
27.2
26.2
8.9
9.9
17.9
16.1
3.8
3.3
20.9
20.5
2.3
2.1
Sun TV Network
Neutral
415
-
16,349
2,779
3,196
70.2
70.5
22.8
27.3
18.2
15.2
4.5
4.1
26.7
28.3
5.6
4.9
Hindustan Media
Neutral
291
-
2,137
920
1,031
20.0
20.0
19.2
20.9
15.2
14.0
2.5
2.1
16.4
15.3
1.9
1.6
Ventures
Metals & Mining
Coal India
Buy
322
380
203,419
76,167
84,130
19.9
22.3
22.4
25.8
14.4
12.5
5.2
5.1
35.5
41.0
2.0
1.8
Hind. Zinc
Buy
146
175
61,838
14,641
14,026
50.4
50.4
17.7
16.0
8.3
9.2
1.3
1.2
16.2
13.2
1.8
1.7
Hindalco
Neutral
85
-
17,470
104,356
111,186
8.7
9.5
6.7
11.1
12.6
7.7
0.5
0.4
3.5
5.9
0.7
0.6
JSW Steel
Neutral
1,027
-
24,826
42,308
45,147
16.4
20.7
(10.3)
49.5
20.8
1.2
1.1
(1.0)
5.6
1.6
1.5
NMDC
Neutral
90
-
35,782
8,237
10,893
46.6
44.5
10.0
11.7
9.1
7.7
1.0
0.9
12.5
13.0
4.1
3.2
SAIL
Neutral
48
-
19,659
45,915
53,954
7.2
10.5
1.5
4.4
31.6
10.9
0.5
0.5
2.3
4.1
1.1
1.0
Vedanta
Neutral
92
-
27,260
71,445
81,910
26.2
26.3
12.9
19.2
7.1
4.8
0.5
0.4
7.2
8.9
0.8
0.6
Tata Steel
Neutral
258
-
25,072
126,760
137,307
8.9
11.3
6.4
23.1
40.6
11.2
0.8
0.8
2.0
7.1
0.8
0.7
Oil & Gas
Cairn India
Neutral
137
-
25,742
11,323
12,490
49.4
51.0
20.7
20.7
6.6
6.7
0.4
0.4
6.4
6.1
1.3
0.7
GAIL
Neutral
367
-
46,604
64,856
70,933
9.1
9.6
24.0
28.9
15.3
12.7
1.3
1.2
8.8
9.6
0.9
0.8
ONGC
Neutral
240
-
205,289
154,564
167,321
36.8
37.4
28.6
32.5
8.4
7.4
1.1
1.0
12.7
13.5
1.5
1.4
Petronet LNG
Neutral
247
-
18,559
29,691
31,188
5.8
6.2
12.8
13.4
19.4
18.4
2.9
2.6
15.8
14.8
0.7
0.7
Indian Oil Corp
Accumulate
426
455
103,394
359,607
402,760
5.9
6.1
42.5
48.7
10.0
8.7
1.3
1.2
14.1
14.4
0.4
0.3
Reliance Industries
Neutral
1,005
-
325,492
304,775
344,392
12.6
13.4
91.3
102.6
11.0
9.8
1.2
1.1
11.8
12.0
1.0
0.8
Stock Watch
December 31, 2015
Company Name
Reco
CMP
Target
Mkt Cap
Sales ( Čcr )
OPM(%)
EPS (Č)
PER(x)
P/BV(x)
RoE(%)
EV/Sales(x)
(Č)
Price ( Č)
( Č cr )
FY16E FY17E
FY16E
FY17E
FY16E
FY17E
FY16E
FY17E
FY16E
FY17E
FY16E
FY17E
FY16E
FY17E
Pharmaceuticals
Alembic Pharma
Neutral
710
-
13,390
2,658
3,112
24.1
20.2
24.6
23.9
28.9
29.7
10.4
7.9
42.5
30.2
5.0
4.2
Aurobindo Pharma
Neutral
871
-
50,852
14,923
17,162
23.0
23.0
38.2
43.6
22.8
20.0
7.0
5.3
36.0
30.2
3.8
3.2
Aventis*
Neutral
4,346
-
10,008
2,082
2,371
17.4
20.8
118.2
151.5
36.8
28.7
5.4
4.3
19.9
25.5
4.5
3.7
Cadila Healthcare
Neutral
385
-
39,429
10,224
11,840
21.0
22.0
14.6
17.6
26.4
21.9
7.2
5.7
30.8
29.0
3.9
3.3
Cipla
Neutral
653
-
52,435
14,211
16,611
20.6
19.0
27.0
28.9
24.2
22.6
4.1
3.5
18.4
16.8
3.7
3.1
Dr Reddy's
Buy
3,121
3,933
53,231
16,838
19,575
25.0
23.1
167.5
178.8
18.6
17.5
3.9
3.3
23.1
20.4
3.1
2.6
Dishman Pharma
Neutral
335
-
2,703
1,733
1,906
21.5
21.5
17.0
19.9
19.7
16.8
2.0
1.8
10.5
11.2
2.1
1.8
GSK Pharma*
Neutral
3,313
-
28,060
2,870
3,158
20.0
22.1
59.5
68.3
55.7
48.5
16.4
16.9
28.5
34.3
9.3
8.5
Indoco Remedies
Neutral
325
-
2,998
1,033
1,199
15.9
18.2
9.4
13.6
34.6
23.9
5.1
4.4
15.7
19.7
3.0
2.6
Ipca labs
Buy
749
900
9,447
3,363
3,909
12.9
18.6
13.4
28.0
55.9
26.7
4.0
3.5
7.4
14.0
3.1
2.7
Lupin
Neutral
1,835
-
82,686
13,092
16,561
25.0
27.0
50.4
68.3
36.4
26.9
7.5
6.0
22.8
24.7
6.0
4.6
Sun Pharma
Buy
811
950
195,104
28,163
32,610
25.8
30.7
17.4
26.9
46.6
30.1
4.4
3.8
13.0
16.6
6.4
5.3
Power
Tata Power
Neutral
68
-
18,324
35,923
37,402
22.6
22.8
4.1
5.2
16.7
13.2
1.3
1.2
7.5
9.3
1.5
1.3
NTPC
Accumulate
145
157
119,765
87,064
98,846
23.5
23.5
11.7
13.2
12.4
11.0
1.4
1.3
11.4
12.1
2.4
2.1
Power Grid
Buy
141
170
73,713
20,702
23,361
86.7
86.4
12.1
13.2
11.7
10.7
1.7
1.5
15.6
15.1
8.5
7.9
Telecom
Bharti Airtel
Neutral
333
-
133,213
101,748
109,191
32.1
31.7
12.0
12.5
27.8
26.7
1.9
1.8
6.9
6.7
1.9
1.8
Idea Cellular
Neutral
141
-
50,652
34,282
36,941
32.0
31.5
5.9
6.2
23.9
22.7
2.2
2.0
9.9
9.3
2.1
1.9
zOthers
Abbott India
Neutral
5,810
-
12,346
2,715
3,153
14.5
14.1
134.3
152.2
43.3
38.2
10.8
8.9
27.4
25.6
4.3
3.6
Bajaj Electricals
Buy
210
290
2,117
4,719
5,287
5.2
5.8
8.6
12.7
24.5
16.6
2.8
2.5
11.4
14.8
0.4
0.4
Finolex Cables
Neutral
249
-
3,809
2,520
2,883
12.2
12.0
12.7
14.2
19.7
17.5
2.7
2.4
13.6
13.5
1.3
1.1
Goodyear India*
Accumulate
568
622
1,311
1,888
1,680
12.1
11.9
62.2
56.6
9.1
10.1
2.1
1.8
25.9
19.7
0.5
0.5
Hitachi
Neutral
1,366
-
3,713
1,779
2,081
7.8
8.8
21.8
33.4
62.6
40.8
10.1
8.2
17.4
22.1
2.2
1.8
Jyothy Laboratories
Neutral
300
-
5,442
1,620
1,847
11.5
11.5
7.3
8.5
41.2
35.5
5.3
4.9
13.3
14.4
3.2
2.7
MRF
Accumulate
39,766
45,575
16,865
20,316
14,488
21.4
21.1
5,488.0
3,798.0
7.3
10.5
2.5
2.0
41.1
21.2
0.8
1.0
Page Industries
Neutral
13,100
-
14,611
1,929
2,450
19.8
20.1
229.9
299.0
57.0
43.8
25.1
17.5
52.1
47.1
7.6
6.0
Relaxo Footwears
Neutral
507
-
6,089
1,767
2,152
12.3
12.5
19.3
25.1
26.4
20.2
6.5
5.0
27.7
27.8
3.5
2.9
Siyaram Silk Mills
Accumulate
1,211
1,354
1,135
1,636
1,815
11.5
11.5
89.9
104.1
13.5
11.6
2.2
1.9
17.9
17.8
0.9
0.8
Styrolution ABS India*
Neutral
750
-
1,319
1,271
1,440
8.6
9.2
32.0
41.1
23.4
18.3
2.4
2.1
10.7
12.4
1.0
0.9
TVS Srichakra
Buy
2,796
3,240
2,141
2,101
2,338
15.7
15.0
248.6
270.0
11.2
10.4
4.9
3.5
43.6
34.0
1.1
0.9
Stock Watch
December 31, 2015
Company Name
Reco
CMP
Target
Mkt Cap
Sales ( Čcr )
OPM(%)
EPS (Č)
PER(x)
P/BV(x)
RoE(%)
EV/Sales(x)
(Č)
Price ( Č)
( Č cr )
FY16E
FY17E
FY16E
FY17E
FY16E
FY17E
FY16E
FY17E
FY16E
FY17E
FY16E
FY17E
FY16E
FY17E
zOthers
HSIL
Neutral
300
-
2,169
2,123
2,384
16.1
16.5
15.0
18.9
19.9
15.9
1.6
1.4
8.0
9.4
1.4
1.2
Kirloskar Engines India
Neutral
242
-
3,494
2,471
2,826
8.8
10.4
9.1
13.3
26.5
18.1
2.5
2.3
9.7
13.4
1.1
0.9
Ltd
M M Forgings
Buy
510
614
615
511
615
21.7
21.6
43.1
55.8
11.8
9.1
2.2
1.8
19.9
21.2
1.4
1.1
Banco Products (India) Neutral
142
-
1,016
1,208
1,353
11.0
12.3
10.8
14.5
13.2
9.8
1.5
1.4
11.9
14.5
0.8
0.7
Competent Automobiles Neutral
149
-
92
1,040
1,137
3.2
3.1
25.7
28.0
5.8
5.3
0.9
0.8
15.0
14.3
0.1
0.1
Nilkamal
Neutral
1,264
-
1,886
1,910
2,083
10.5
10.3
63.3
69.2
20.0
18.3
3.3
2.8
17.6
16.5
1.0
0.9
Visaka Industries
Buy
124
144
197
1,086
1,197
9.9
10.3
21.5
28.8
5.8
4.3
0.6
0.5
9.6
11.6
0.4
0.3
Transport Corporation of
Neutral
297
-
2,259
2,830
3,350
8.8
9.0
14.4
18.3
20.7
16.2
3.2
2.8
15.4
17.1
0.9
0.8
India
Elecon Engineering
Neutral
83
-
909
1,369
1,533
13.7
14.9
3.3
6.1
25.1
13.8
1.6
1.5
6.6
11.4
1.0
0.9
Surya Roshni
Buy
142
183
623
2,992
3,223
8.1
8.4
14.7
18.3
9.7
7.8
0.9
0.8
9.7
11.0
0.5
0.5
MT Educare
Neutral
185
-
735
286
366
18.3
17.7
7.7
9.4
23.9
19.7
5.0
4.4
20.2
21.1
2.5
1.9
Radico Khaitan
Buy
115
156
1,531
1,565
1,687
12.2
13.0
5.7
7.1
20.2
16.2
1.7
1.6
8.3
9.6
1.4
1.3
Garware Wall Ropes
Accumulate
426
473
933
861
967
10.9
10.9
24.0
28.2
17.8
15.1
2.6
2.3
14.6
14.9
1.1
0.9
Wonderla Holidays
Neutral
398
-
2,249
206
308
44.0
43.6
9.0
12.9
44.2
30.9
6.0
5.5
13.7
17.8
10.8
7.2
Linc Pen & Plastics
Neutral
217
-
321
340
371
8.3
8.9
10.8
13.2
20.1
16.4
3.2
2.8
16.0
17.1
1.0
0.9
The Byke Hospitality
Neutral
152
-
609
222
287
20.5
20.5
5.6
7.6
26.9
20.1
5.1
4.2
18.9
20.8
2.8
2.1
Interglobe Aviation
Neutral
1,193
-
43,000
17,022
21,122
20.7
14.5
63.9
53.7
18.7
22.2
28.0
22.9
149.9
103.2
2.6
2.1
Coffee Day Enterprises
Neutral
285
-
5,865
2,692
2,964
17.0
18.6
-
4.7
-
60.1
3.5
3.3
0.2
5.5
2.6
2.4
Ltd
Navneet Education
Neutral
96
-
2,298
998
1,062
24.1
24.0
5.8
6.1
16.8
15.8
3.7
3.3
22.0
20.6
2.4
2.2
Source: Company, Angel Research; Note: *December year end; #September year end; &October year end; Price as on December 30, 2015
Market Outlook
December 31, 2015
Research Team Tel: 022 - 39357800
DISCLAIMER
Angel Broking Private Limited (hereinafter referred to as “Angel”) is a registered Member of National Stock Exchange of India Limited,
Bombay Stock Exchange Limited and Metropolitian Stock Exchange of India Limited. It is also registered as a Depository Participant with
CDSL and Portfolio Manager with SEBI. It also has registration with AMFI as a Mutual Fund Distributor. Angel Broking Private Limited is a
registered entity with SEBI for Research Analyst in terms of SEBI (Research Analyst) Regulations, 2014 vide registration number
INH000000164. Angel or its associates has not been debarred/ suspended by SEBI or any other regulatory authority for accessing
/dealing in securities Market. Angel or its associates including its relatives/analyst do not hold any financial interest/beneficial ownership
of more than 1% in the company covered by Analyst. Angel or its associates/analyst has not received any compensation / managed or co
-managed public offering of securities of the company covered by Analyst during the past twelve months. Angel/analyst has not served as
an officer, director or employee of company covered by Analyst and has not been engaged in market making activity of the company
covered by Analyst.
This document is solely for the personal information of the recipient, and must not be singularly used as the basis of any investment
decision. Nothing in this document should be construed as investment or financial advice. Each recipient of this document should make
such investigations as they deem necessary to arrive at an independent evaluation of an investment in the securities of the companies
referred to in this document (including the merits and risks involved), and should consult their own advisors to determine the merits and
risks of such an investment.
Reports based on technical and derivative analysis center on studying charts of a stock's price movement, outstanding positions and
trading volume, as opposed to focusing on a company's fundamentals and, as such, may not match with a report on a company's
fundamentals.
The information in this document has been printed on the basis of publicly available information, internal data and other reliable sources
believed to be true, but we do not represent that it is accurate or complete and it should not be relied on as such, as this document is for
general guidance only. Angel Broking Pvt. Limited or any of its affiliates/ group companies shall not be in any way responsible for any
loss or damage that may arise to any person from any inadvertent error in the information contained in this report. Angel Broking Pvt.
Limited has not independently verified all the information contained within this document. Accordingly, we cannot testify, nor make any
representation or warranty, express or implied, to the accuracy, contents or data contained within this document. While Angel Broking
Pvt. Limited endeavors to update on a reasonable basis the information discussed in this material, there may be regulatory, compliance,
or other reasons that prevent us from doing so.
This document is being supplied to you solely for your information, and its contents, information or data may not be reproduced,
redistributed or passed on, directly or indirectly.
Neither Angel Broking Pvt. Limited, nor its directors, employees or affiliates shall be liable for any loss or damage that may arise from or
in connection with the use of this information.
Note: Please refer to the important ‘Stock Holding Disclosure' report on the Angel website (Research Section). Also, please refer to the
latest update on respective stocks for the disclosure status in respect of those stocks. Angel Broking Pvt. Limited and its affiliates may have
investment positions in the stocks recommended in this report.