Market Outlook
August 31, 2015
Dealer’s Diary
Domestic Indices
Chg (%)
(Pts)
(Close)
BSE Sensex
0.6
161
26,392
Indian markets are expected to open in the red tracking the SGX Nifty and weak
Asian markets.
Nifty
0.7
53
8,002
MID CAP
0.2
21
10,759
US markets closed flat as traders took a breather following volatile swings in earlier
SMALL CAP
0.1
7
10,993
sessions.
BSE HC
(0.3)
(53)
17,646
European markets ended on a mixed note after a volatile week of trading. Investors
BSE PSU
0.7
45
6,911
booked profits following the bounce back in recent sessions after the sharp declines
BANKEX
(0.2)
(46)
19,703
last week.
AUTO
1.0
180
18,004
Indian markets opened sharply higher but closed off their day’s high on the back of
METAL
0.8
57
7,402
profit booking and weak European cues.
OIL & GAS
0.9
80
8,854
BSE IT
1.5
167
11,189
News & Result Analysis
Global Indices
Chg (%)
(Pts)
(Close)
Sun Pharma faces class action suit in US over closure of arm
Refer detailed news analysis on the following page
Dow Jones
(0.1)
(12)
16,643
NASDAQ
0.3
16
4,828
Markets Today
FTSE
0.9
56
6,248
The trend deciding level for the day is 26,450 / 8,018 levels. If NIFTY trades above
Nikkei
3.0
562
19,136
this level during the first half-an-hour of trade then we may witness a further rally up
Hang Sang
(1.0)
226
21,612
to 26,630 - 26,867 / 8,075 - 8,149 levels. However, if NIFTY trades below
Straits Times
0.4
11
2,956
26,450 / 8,018 levels for the first half-an-hour of trade then it may correct towards
Shanghai Com
4.8
149
3,232
26,213 - 26,033 / 7,945 - 7,888 levels.
Indices
S2
S1
PIVOT
R1
R2
Indian ADR
Chg (%)
(Pts)
(Close)
SENSEX
26,033
26,213
26,450
26,630
26,867
INFY
1.4
0.2
$17.5
NIFTY
7,888
7,945
8,018
8,075
8,149
WIT
1.0
0.1
$11.8
IBN
0.2
0.0
$8.9
Net Inflows (August 28, 2015)
HDB
1.0
0.6
$58.4
` cr
Purch
Sales
Net
MTD
YTD
FII
7,548
10,681
(3,134)
(16,711)
124,259
Advances / Declines
BSE
NSE
MFs
3,644
1,524
2,121
9,490
67,438
Advances
1,296
768
Declines
1,419
737
FII Derivatives (August 31, 2015)
` cr
Purch
Sales
Net
Open Interest
Unchanged
100
68
Index Futures
3,859
1,347
2,512
18,555
Volumes (` cr)
Stock Futures
2,710
2,279
432
43,882
BSE
3,591
Gainers / Losers
NSE
18,880
Gainer
Loser
Company
Price (`)
chg (%)
Company
Price (`)
chg (%)
VAKRANGEE
118
9.9
SUNASIAN
261
(10.0)
UNITDSPR
361
7.3
IOB
35
(5.4)
GATI
146
7.1
IBREALEST
63
(5.0)
ABAN
255
6.6
HDIL
60
(5.0)
NATIONALUM
31
6.0
GMRINFRA
12
(4.9)
Market Outlook
August 31, 2015
Sun Pharma faces class action suit in US over closure of arm
Sun Pharma is facing a class action suit over the closure of the unit's wholly-owned
subsidiary, Caraco Pharmaceutical Laboratories in Michigan six years ago. The US
Circuit Court of Appeals ruled that Caraco did not comply with norms while
closing two of its units in Detroit and Farmington Hills. The case is based on the
fact that Caraco did not issue a Federal Worker Adjustment and Retraining
Notification Act (WARN) notice to its employees until 11 days after the plants were
closed. While the company claimed it had "extraordinary circumstances" as its
reason for filing the notice late, former employees sued the company arguing that
the plant was facing issues for years and had been informed by the FDA that a
seizure could take place if it didn't mend ways with respect to its manufacturing. In
case the lawsuit is not settled in favour of Sun Pharma, the company could face
some penalties. However, since the subsidiary is non-operational, we do not
expect any significant impact on the operational or financial performance of the
company. We retain our ‘Accumulate’ rating on the stock.
Economic and Political News
India's external debt rises marginally to 23.8% of GDP
India's foreign exchange reserves rise $921 million to $355.35 billion
Oil Ministry to publish premium gas formula soon
India's trade-GDP ratio higher than US, China's
Corporate News
Brigade Hospitality plans 1,200 hotel rooms in South India
ONGC, partners to invest $24bn in Mozambique gas field
GMR plans to export power from its Nepal plants to Bangladesh
Market Outlook
August 31, 2015
Top Picks
Large Cap
Market Cap
CMP
Target
Upside
Company
Sector
Rating
(` Cr)
(`)
(`)
(%)
Axis Bank
Financials
1,20,740
Buy
508
716
40.9
ICICI Bank
Financials
1,64,616
Buy
284
370
30.5
Infosys
IT
2,55,122
Buy
1,111
1,306
17.6
Inox Wind
Capital Goods
7,967
Buy
359
505
40.7
LIC HFL
Financials
22,119
Buy
438
570
30.0
Power Grid
Power
70,417
Buy
135
170
26.3
TCS
IT
5,03,520
Buy
2,571
3,168
23.3
Tech Mahindra IT
49,638
Buy
516
646
25.2
Yes Bank
Financials
28,286
Buy
676
989
46.3
Source: Angel Research, Bloomberg
Mid Cap
Market Cap
CMP
Target
Upside
Company
Sector
Rating
(` Cr)
(`)
(`)
(%)
Bajaj Electricals
Others
2,509
Buy
249
341
37.0
Garware Wall Ropes Others
652
Buy
298
390
31.0
HMVL
Media
1,568
Buy
214
292
36.7
JK Tyre
Auto Ancillary
2,484
Buy
110
129
17.8
MBL Infrastructures Construction
975
Buy
235
360
53.0
Minda Industries
Auto Ancillary
833
Buy
525
652
24.2
MT Educare
Others
544
Buy
137
169
23.6
Radico Khaitan
Others
1,213
Buy
91
112
22.8
Surya Roshni
Others
565
Buy
129
183
42.1
Source: Angel Research, Bloomberg
Market Outlook
August 31, 2015
Global economic events release calendar
Date
Time
Country Event Description
Unit
Period
Bloomberg Data
Last Reported Estimated
September 1, 2015
1:25PM
Germany PMI Manufacturing
Value
Aug F
53.20
53.20
1:25PM
Germany Unemployment change (000's)
Thousands
Aug
9.00
(2.00)
6:30AM
China
PMI Manufacturing
Value
Aug
50.00
49.70
2:00PM
UK
PMI Manufacturing
Value
Aug
51.90
51.90
September 3, 2015
6:00PM
US
Initial Jobless claims
Thousands
Aug 29
271.00
--
1:25PM
Germany PMI Services
Value
Aug F
53.60
53.60
5:15PM
Euro Zone ECB announces interest rates
%
Sep 3
0.05
0.05
September 4, 2015
6:00PM
US
Change in Nonfarm payrolls
Thousands
Aug
215.00
218.00
6:00PM
US
Unnemployment rate
%
Aug
5.30
5.30
September 8, 2015
2:30PM
Euro Zone Euro-Zone GDP s.a. (QoQ)
% Change
2Q P
0.30
0.30
China
Exports YoY%
% Change
Aug
(8.30)
--
September 9, 2015
2:00PM
UK
Industrial Production (YoY)
% Change
Jul
1.50
--
September 10, 2015
India
Imports YoY%
% Change
Aug
(10.28)
--
India
Exports YoY%
% Change
Aug
(10.30)
--
7:00AM
China
Consumer Price Index (YoY)
% Change
Aug
1.60
--
4:30PM
UK
BOE Announces rates
% Ratio
Sep 10
0.50
0.50
September 11, 2015
5:30PM
India
Industrial Production YoY
% Change
Jul
3.80
--
September 13, 2015
11:00AM
China
Industrial Production (YoY)
% Change
Aug
6.00
--
September 14, 2015
12:00PM
India
Monthly Wholesale Prices YoY%
% Change
Aug
(4.05)
--
September 15, 2015
6:45PM
US
Industrial Production
%
Aug
0.56
--
2:00PM
UK
CPI (YoY)
% Change
Aug
0.10
--
Source: Bloomberg, Angel Research
Market Outlook
August 31, 2015
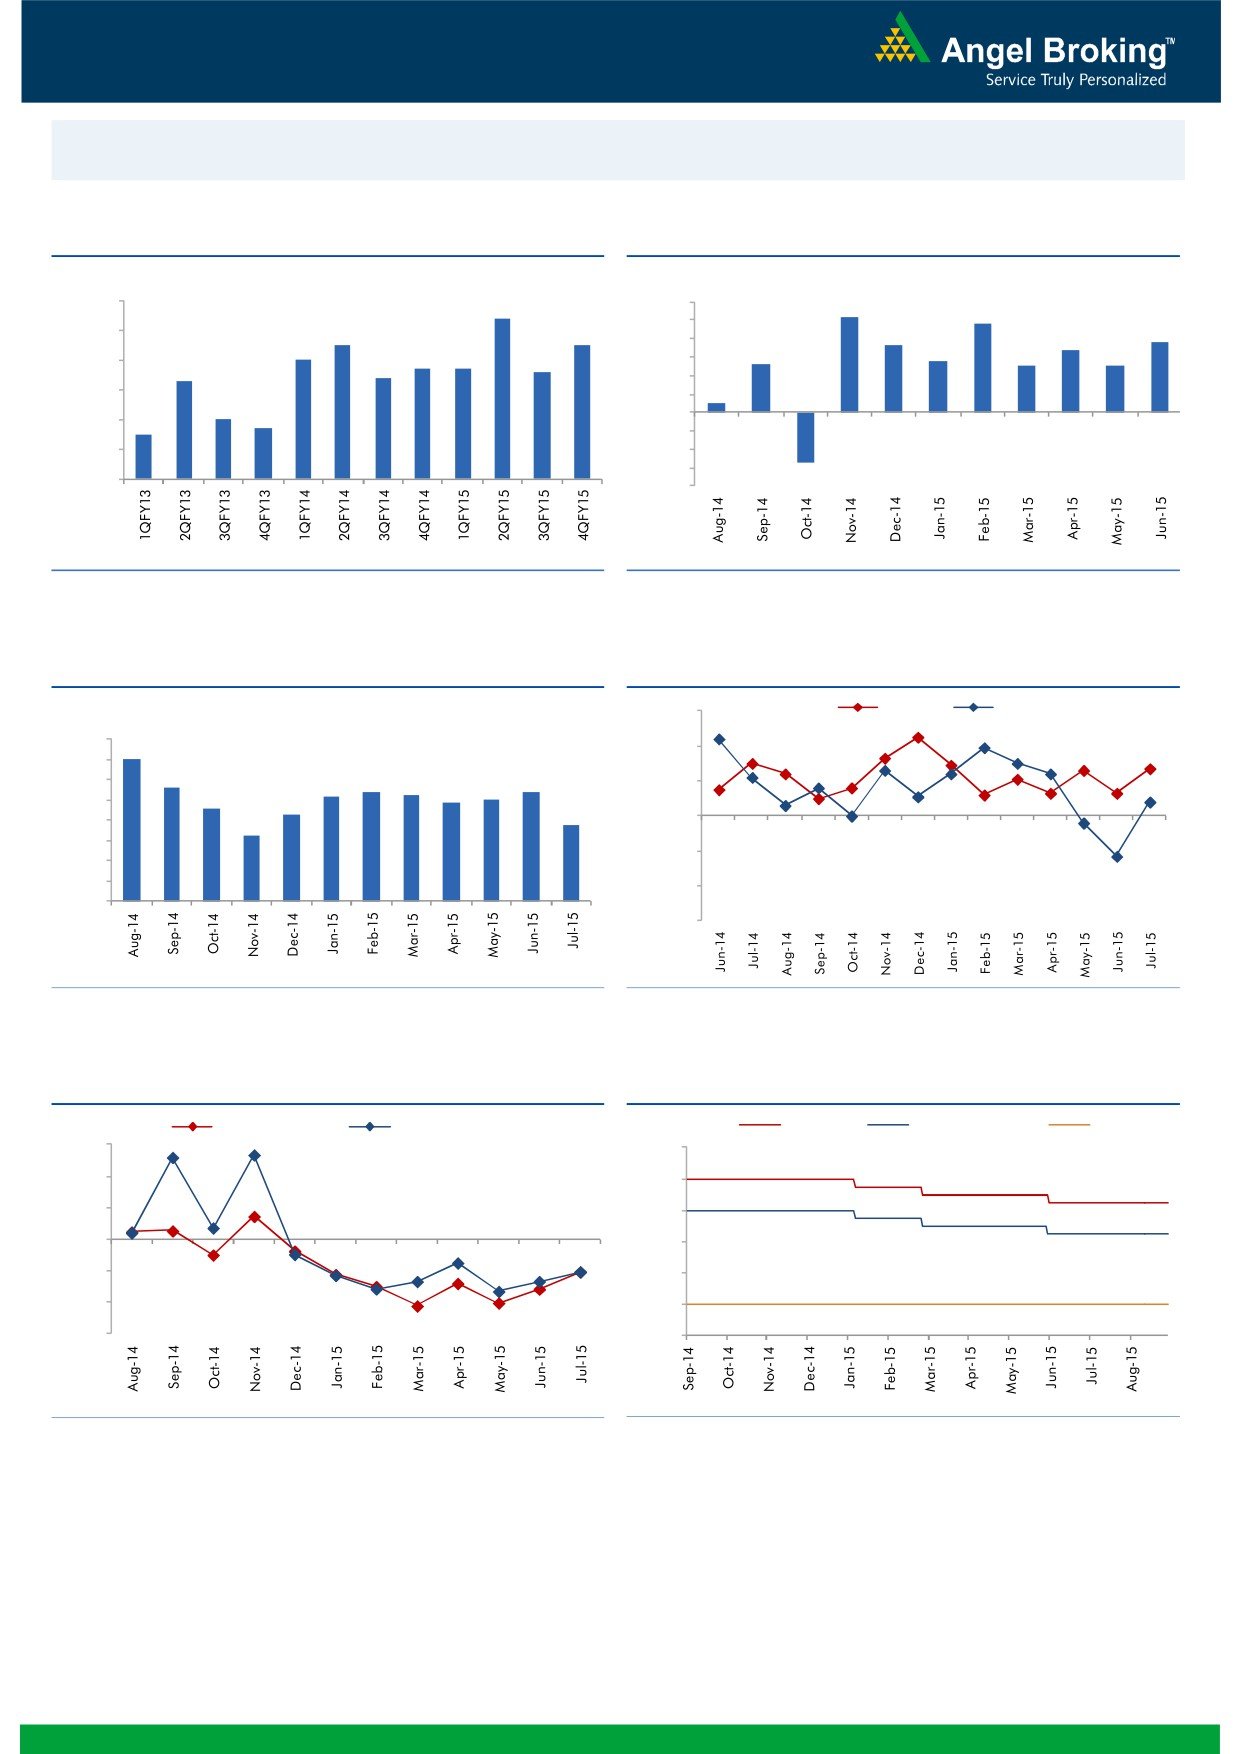
Macro watch
Exhibit 1: Quarterly GDP trends
Exhibit 2: IIP trends
(%)
(%)
9.0
8.4
6.0
5.2
4.8
7.5
7.5
5.0
3.8
8.0
3.6
3.4
7.0
4.0
2.8
6.7
6.7
2.6
2.5
2.5
7.0
6.3
6.4
6.6
3.0
2.0
6.0
0.5
1.0
5.0
4.7
-
5.0
4.5
(1.0)
4.0
(2.0)
(3.0)
3.0
(2.7)
(4.0)
Source: CSO, Angel Research
Source: MOSPI, Angel Research
Exhibit 3: Monthly CPI inflation trends
Exhibit 4: Manufacturing and services PMI
(%)
56.0
Mfg. PMI
Services PMI
8.0
7.0
54.0
7.0
5.6
5.4
6.0
5.2
5.4
5.3
5.0
52.0
4.6
4.9
5.0
4.3
3.8
4.0
3.3
50.0
3.0
48.0
2.0
1.0
46.0
-
44.0
Source: MOSPI, Angel Research
Source: Market, Angel Research; Note: Level above 50 indicates expansion
Exhibit 5: Exports and imports growth trends
Exhibit 6: Key policy rates
(%)
Exports yoy growth
Imports yoy growth
(%)
Repo rate
Reverse Repo rate
CRR
30.0
9.00
20.0
8.00
10.0
7.00
0.0
6.00
(10.0)
5.00
(20.0)
4.00
(30.0)
3.00
Source: Bloomberg, Angel Research
Source: RBI, Angel Research
Market Outlook
August 31, 2015
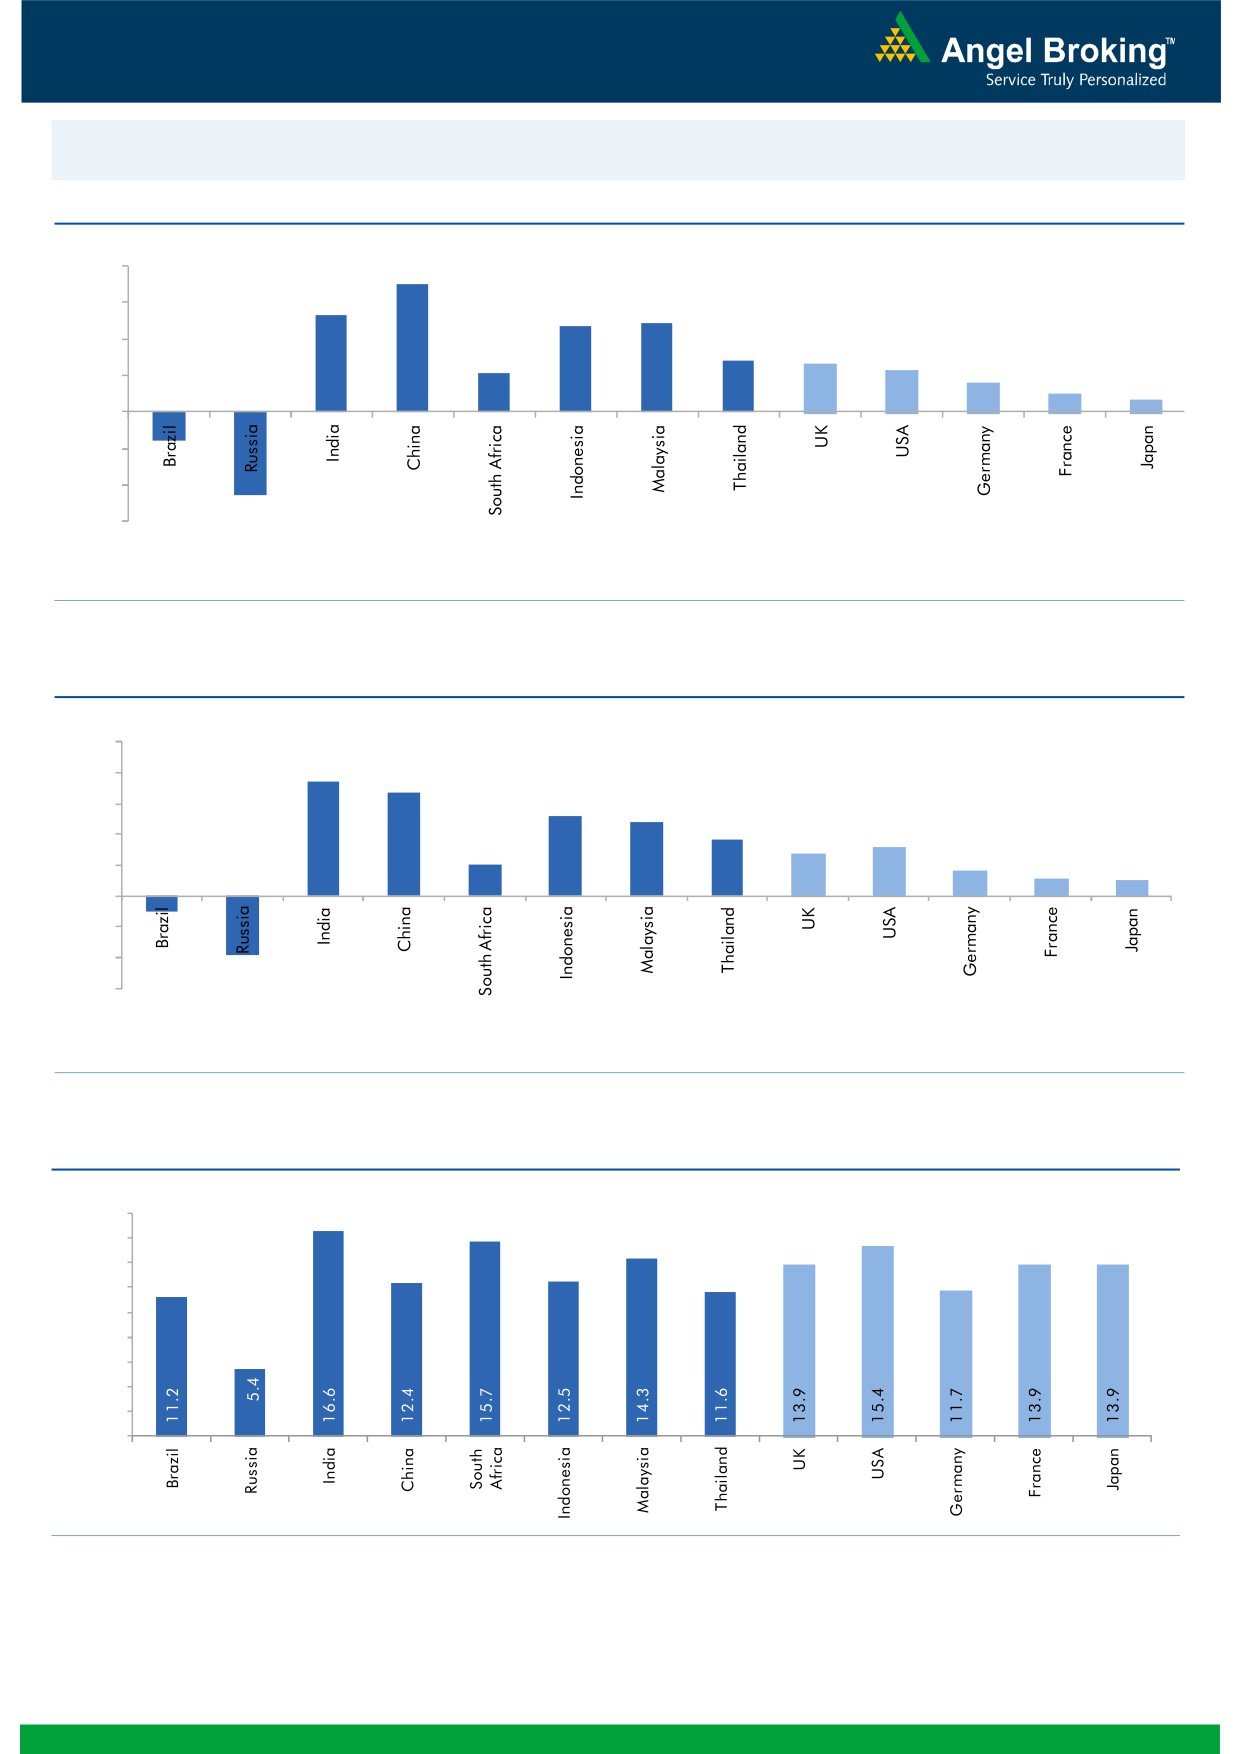
Global watch
Exhibit 1: Latest quarterly GDP Growth (%, yoy) across select developing and developed countries
(%)
8.0
7.0
6.0
5.3
4.9
4.7
4.0
2.8
2.6
2.1
2.3
1.6
2.0
1.0
(1.6)
0.7
(4.6)
-
(2.0)
(4.0)
(6.0)
Source: Bloomberg, Angel Research
Exhibit 2: 2015 GDP Growth projection by IMF (%, yoy) across select developing and developed countries
(%)
10.0
7.5
8.0
6.8
5.2
6.0
4.8
3.7
3.1
4.0
2.7
2.0
1.6
1.2
1.0
2.0
(3.8)
(1.0)
-
(2.0)
(4.0)
(6.0)
Source: IMF, Angel Research
Exhibit 3: One year forward P-E ratio across select developing and developed countries
(x)
18.0
16.0
14.0
12.0
10.0
8.0
6.0
4.0
2.0
-
Source: Bloomberg, Angel Research
Market Outlook
August 31, 2015
Exhibit 4: Relative performance of indices across globe
Returns (%)
Country
Name of index
Closing price
1M
3M
1YR
Brazil
Bovespa
47,154
(3.8)
(12.0)
(20.1)
Russia
Micex
3,021
5.7
2.3
17.5
India
Nifty
8,002
(4.7)
(5.7)
0.9
China
Shanghai Composite
3,232
(17.7)
(32.4)
39.2
South Africa
Top 40
44,384
(4.7)
(7.0)
(6.1)
Mexico
Mexbol
43,291
(1.7)
(2.8)
(4.7)
Indonesia
LQ45
757
(6.6)
(18.6)
(15.2)
Malaysia
KLCI
1,613
(5.1)
(7.8)
(13.4)
Thailand
SET 50
894
(6.0)
(11.0)
(14.7)
USA
Dow Jones
16,643
(5.5)
(8.1)
(2.5)
UK
FTSE
6,248
(5.5)
(11.3)
(9.3)
Japan
Nikkei
19,136
(6.4)
(7.6)
22.9
Germany
DAX
10,299
(7.7)
(9.6)
7.8
France
CAC
4,675
(6.4)
(7.0)
6.4
Source: Bloomberg, Angel Research
Market Outlook
August 31, 2015
Stock Watch
Company Name
Reco
CMP
Target
Mkt Cap
Sales ( Čcr )
OPM(%)
EPS (Č)
PER(x)
P/BV(x)
RoE(%)
EV/Sales(x)
(Č)
Price ( Č)
( Č cr )
FY16E FY17E
FY16E
FY17E
FY16E
FY17E
FY16E
FY17E
FY16E
FY17E
FY16E
FY17E
FY16E
FY17E
Agri / Agri Chemical
Rallis
Neutral
214
-
4,159
2,075
2,394
14.4
14.4
9.5
11.0
22.5
19.4
4.5
3.9
21.1
21.3
2.0
1.8
United Phosphorus
Neutral
521
-
22,315
13,698
15,752
17.6
17.6
32.1
38.5
16.2
13.5
3.2
2.6
21.4
21.3
1.7
1.4
Auto & Auto Ancillary
Ashok Leyland
Neutral
92
-
26,239
17,850
20,852
10.6
11.1
3.2
4.3
28.8
21.4
4.8
4.4
16.4
20.8
1.4
1.2
Bajaj Auto
Accumulate
2,269
2,454
65,663
23,842
27,264
19.8
19.6
128.4
144.4
17.7
15.7
5.4
4.6
30.5
29.5
2.3
2.0
Eicher Motors
Buy
18,919
22,859
51,351
11,681
15,550
15.3
16.9
358.5
564.3
52.8
33.5
15.9
11.8
29.8
34.9
4.3
3.2
Hero Motocorp
Accumulate
2,401
2,660
47,944
28,500
33,028
13.8
14.1
144.2
166.3
16.7
14.4
6.1
5.2
36.7
36.0
1.5
1.3
L G Balakrishnan & Bros Neutral
491
-
771
1,254
1,394
11.6
11.8
35.9
41.7
13.7
11.8
1.9
1.6
13.5
13.8
0.7
0.6
Mahindra and Mahindra Buy
1,233
1,493
76,565
40,088
45,176
13.8
14.0
59.6
70.4
20.7
17.5
3.4
3.0
16.6
17.2
1.6
1.3
Maruti
Accumulate
4,205
4,735
127,023
58,102
68,587
16.7
16.9
182.0
225.5
23.1
18.7
4.6
3.9
19.9
21.0
2.0
1.6
Minda Industries
Buy
525
652
833
2,567
2,965
7.3
8.0
38.8
54.3
13.5
9.7
2.0
1.6
14.4
16.8
0.4
0.4
Rane Brake Lining
Buy
303
366
240
454
511
11.1
11.4
23.8
28.1
12.7
10.8
1.8
1.6
14.2
15.3
0.7
0.6
Setco Automotive
Neutral
229
-
613
594
741
12.7
13.7
8.4
15.8
27.3
14.5
2.8
2.5
10.4
16.9
1.5
1.2
Tata Motors
Buy
340
432
98,280
267,464
307,211
13.7
13.7
34.6
40.7
9.8
8.4
1.2
1.1
13.2
13.6
0.6
0.5
TVS Motor
Buy
220
255
10,471
11,839
13,985
7.0
8.0
10.8
15.9
20.4
13.9
5.2
4.1
25.5
29.7
0.8
0.7
Amara Raja Batteries
Neutral
1,022
-
17,459
5,101
6,224
17.8
17.6
31.1
39.2
32.9
26.1
8.2
6.5
24.8
24.8
3.4
2.7
Exide Industries
Neutral
155
-
13,201
7,363
8,247
13.7
14.5
6.6
7.7
23.5
20.2
3.0
2.7
12.6
13.3
1.5
1.4
Apollo Tyres
Neutral
181
-
9,236
12,576
12,978
16.8
16.1
22.3
19.9
8.1
9.1
1.4
1.2
17.2
13.4
0.8
0.8
Ceat
Accumulate
1,099
1,166
4,445
6,041
6,597
14.3
14.2
101.5
116.6
10.8
9.4
2.2
1.8
20.0
19.1
0.9
0.8
JK Tyres
Buy
110
129
2,484
7,446
7,669
15.2
14.0
19.6
18.4
5.6
6.0
1.4
1.2
25.2
19.5
0.7
0.6
Swaraj Engines
Neutral
882
-
1,095
593
677
14.5
14.8
51.2
60.8
17.2
14.5
4.0
3.6
23.3
24.8
1.7
1.4
Subros
Neutral
78
-
469
1,268
1,488
11.6
11.9
3.7
6.6
21.1
11.9
1.4
1.3
6.8
11.4
0.7
0.6
Indag Rubber
Neutral
180
-
473
283
329
17.0
17.2
13.0
15.4
13.9
11.7
3.0
2.5
21.8
21.6
1.4
1.1
Capital Goods
ACE
Neutral
42
-
412
660
839
4.7
8.2
1.0
3.9
41.6
10.7
1.3
1.2
3.2
11.3
0.8
0.6
BEML
Neutral
1,263
-
5,260
3,277
4,006
6.0
8.9
29.2
64.3
43.3
19.6
2.4
2.2
5.7
11.7
1.7
1.3
BGR Energy
Neutral
110
-
794
3,615
3,181
9.5
9.4
16.7
12.4
6.6
8.9
0.6
0.6
10.0
7.0
0.6
0.8
BHEL
Neutral
235
-
57,421
33,722
35,272
10.8
11.7
10.5
14.2
22.3
16.5
1.7
1.6
7.0
9.0
1.8
1.7
Blue Star
Accumulate
350
387
3,144
3,649
4,209
5.0
5.9
9.2
14.7
38.2
23.7
6.9
6.5
9.1
17.5
1.0
0.8
Crompton Greaves
Accumulate
178
204
11,131
13,484
14,687
4.9
6.2
4.5
7.1
39.5
25.0
2.8
2.6
7.2
10.8
1.0
0.9
Inox Wind
Buy
359
505
7,967
4,980
5,943
17.0
17.5
26.6
31.6
13.5
11.4
4.0
3.0
35.0
30.0
1.7
1.4
Market Outlook
August 31, 2015
Stock Watch
Company Name
Reco
CMP
Target
Mkt Cap
Sales ( Čcr )
OPM(%)
EPS (Č)
PER(x)
P/BV(x)
RoE(%)
EV/Sales(x)
(Č)
Price ( Č)
( Č cr )
FY16E
FY17E
FY16E
FY17E
FY16E
FY17E
FY16E
FY17E
FY16E
FY17E
FY16E
FY17E
FY16E
FY17E
Capital Goods
KEC International
Neutral
132
-
3,383
8,791
9,716
6.1
6.8
5.4
8.2
24.4
16.1
2.4
2.2
10.0
14.0
0.6
0.6
Thermax
Neutral
980
-
11,671
6,413
7,525
7.4
8.5
30.5
39.3
32.1
24.9
5.0
4.3
15.0
17.0
1.8
1.5
Cement
ACC
Accumulate
1,363
1,548
25,593
11,856
14,092
14.5
17.8
47.6
76.1
28.6
17.9
2.9
2.7
10.6
15.7
2.0
1.6
Ambuja Cements
Accumulate
206
233
31,985
10,569
12,022
20.7
22.2
8.7
10.7
23.7
19.3
3.0
2.8
13.0
15.2
2.6
2.3
India Cements
Buy
74
112
2,287
4,716
5,133
15.9
16.9
3.7
7.5
20.1
9.9
0.7
0.7
3.8
7.3
0.8
0.7
JK Cement
Buy
625
767
4,372
4,056
4,748
14.5
17.0
22.6
41.1
27.7
15.2
2.5
2.2
9.3
15.3
1.5
1.3
J K Lakshmi Cement
Buy
356
430
4,194
2,947
3,616
16.7
19.9
11.5
27.2
31.0
13.1
2.9
2.5
9.8
20.8
1.8
1.5
Mangalam Cements
Neutral
227
-
606
1,053
1,347
10.5
13.3
8.4
26.0
27.0
8.7
1.1
1.1
4.3
12.5
1.0
0.7
Orient Cement
Accumulate
167
183
3,420
1,854
2,524
21.2
22.2
7.7
11.1
21.7
15.0
3.1
2.7
13.3
15.7
2.6
1.8
Ramco Cements
Accumulate
323
350
7,690
4,036
4,545
20.8
21.3
15.1
18.8
21.4
17.2
2.6
2.3
12.9
14.3
2.4
2.1
Shree Cement^
Neutral
11,010
-
38,357
7,150
8,742
26.7
28.6
228.0
345.5
48.3
31.9
7.1
6.0
15.7
20.3
5.1
4.1
UltraTech Cement
Accumulate
2,945
3,282
80,807
27,562
31,548
20.4
22.3
111.9
143.3
26.3
20.6
3.7
3.2
15.2
16.8
3.0
2.6
Construction
ITNL
Neutral
91
-
2,256
7,360
8,825
34.0
35.9
1.0
5.0
91.5
18.3
0.4
0.4
0.3
1.4
3.7
3.6
KNR Constructions
Neutral
573
-
1,612
915
1,479
14.3
13.9
20.3
37.2
28.2
15.4
2.6
2.2
9.6
15.6
1.9
1.2
Larsen & Toubro
Buy
1,617
2,013
150,459
68,920
82,446
10.9
11.5
57.0
73.0
28.4
22.2
2.6
2.4
13.6
15.5
2.4
2.0
Gujarat Pipavav Port
Neutral
184
-
8,907
740
843
53.1
53.6
8.0
10.0
23.0
18.4
3.6
2.9
20.4
19.4
11.6
9.8
MBL Infrastructures
Buy
235
360
975
2,313
2,797
12.2
14.6
19.0
20.0
12.4
11.8
1.3
1.2
11.3
10.6
1.1
1.0
Nagarjuna Const.
Neutral
74
74
4,117
7,892
8,842
8.3
9.1
2.4
5.3
30.9
14.0
1.2
1.2
4.2
8.6
0.8
0.6
PNC Infratech
Neutral
489
-
2,509
1,798
2,132
13.2
13.5
22.0
30.0
22.2
16.3
2.0
1.8
11.5
11.4
1.5
1.3
Simplex Infra
Neutral
307
307
1,519
6,241
7,008
10.4
10.7
20.0
36.0
15.4
8.5
1.3
1.1
6.8
11.1
0.7
0.6
Financials
Allahabad Bank
Neutral
84
-
4,777
8,859
9,817
3.0
3.0
23.7
30.1
3.5
2.8
0.4
0.4
10.6
12.3
-
-
Axis Bank
Buy
508
716
120,740
26,522
31,625
3.6
3.6
36.2
45.4
14.0
11.2
2.8
2.4
18.2
19.6
-
-
Bank of Baroda
Neutral
185
-
40,957
18,934
21,374
2.0
2.0
13.2
15.1
14.0
12.3
1.0
1.0
7.1
7.7
-
-
Bank of India
Neutral
142
-
9,408
17,402
20,003
2.0
2.1
40.3
50.7
3.5
2.8
0.4
0.3
9.0
10.4
-
-
Canara Bank
Neutral
281
-
14,451
15,805
17,745
2.0
2.2
64.3
73.5
4.4
3.8
0.5
0.4
10.8
11.3
-
-
Dena Bank
Neutral
43
-
2,430
3,580
4,040
2.1
2.2
8.4
10.9
5.2
4.0
0.5
0.4
6.8
8.4
-
-
Federal Bank
Neutral
63
-
10,730
3,522
4,045
3.2
3.2
12.2
14.1
5.1
4.4
0.6
0.6
12.9
13.4
-
-
HDFC
Neutral
1,201
-
189,268
11,198
13,321
3.5
3.5
45.1
53.7
26.6
22.4
5.5
4.9
27.2
28.2
-
-
HDFC Bank
Buy
1,028
1,255
258,363
38,629
47,500
4.5
4.7
52.6
66.4
19.5
15.5
3.6
3.0
19.6
21.2
-
-
Market Outlook
August 31, 2015
Stock Watch
Company Name
Reco
CMP
Target
Mkt Cap
Sales ( Čcr )
OPM(%)
EPS (Č)
PER(x)
P/BV(x)
RoE(%)
EV/Sales(x)
(Č)
Price ( Č)
( Č cr )
FY16E FY17E
FY16E
FY17E
FY16E
FY17E
FY16E
FY17E
FY16E
FY17E
FY16E
FY17E
FY16E
FY17E
Financials
ICICI Bank
Buy
284
370
164,616
36,037
41,647
3.5
3.6
22.9
26.7
12.4
10.6
2.1
1.8
15.7
15.9
-
-
IDBI Bank
Neutral
59
-
9,391
9,806
11,371
1.7
1.9
10.0
16.3
5.9
3.6
0.4
0.4
6.8
10.4
-
-
Indian Bank
Neutral
135
-
6,460
6,454
7,321
2.5
2.6
26.4
33.3
5.1
4.0
0.4
0.4
8.1
9.6
-
-
LIC Housing Finance
Buy
438
570
22,119
2,934
3,511
2.3
2.3
30.9
36.8
14.2
11.9
2.3
2.0
16.8
17.5
-
-
Oriental Bank
Neutral
133
-
3,997
7,930
8,852
2.5
2.5
51.8
57.1
2.6
2.3
0.3
0.3
9.3
9.5
-
-
Punjab Natl.Bank
Neutral
143
-
26,557
24,160
27,777
2.9
3.0
18.5
24.6
7.7
5.8
0.8
0.6
8.8
10.8
-
-
South Ind.Bank
Neutral
21
-
2,815
1,999
2,249
2.4
2.4
3.5
4.0
6.0
5.2
0.8
0.7
12.6
13.1
-
-
St Bk of India
Buy
249
309
188,588
86,900
100,550
3.1
3.1
22.1
27.7
11.3
9.0
1.4
1.2
12.7
14.3
-
-
Union Bank
Neutral
175
-
11,123
12,995
14,782
2.4
2.4
32.3
40.9
5.4
4.3
0.7
0.5
10.7
12.3
-
-
Vijaya Bank
Neutral
36
-
3,127
3,474
3,932
1.8
1.9
5.9
7.2
6.2
5.1
0.5
0.5
8.1
9.3
-
-
Yes Bank
Buy
676
989
28,286
7,006
8,825
3.1
3.3
61.4
77.1
11.0
8.8
2.1
1.7
20.1
21.3
-
-
FMCG
Asian Paints
Neutral
856
-
82,136
16,553
19,160
16.0
16.2
17.7
21.5
48.5
39.8
12.9
11.6
29.4
31.2
4.8
4.1
Britannia
Neutral
2,972
-
35,651
8,065
9,395
9.6
10.2
47.2
65.5
62.9
45.4
20.9
19.8
38.3
41.2
4.3
3.7
Colgate
Neutral
1,945
-
26,457
4,836
5,490
19.5
19.7
48.5
53.2
40.1
36.6
29.4
25.6
99.8
97.5
5.4
4.7
Dabur India
Neutral
281
-
49,358
9,370
10,265
17.1
17.2
7.3
8.1
38.3
34.7
11.6
9.4
33.7
30.6
5.2
4.7
GlaxoSmith Con*
Neutral
6,249
-
26,279
4,919
5,742
17.2
17.4
168.3
191.2
37.1
32.7
10.5
9.0
28.8
28.9
4.9
4.2
Godrej Consumer
Neutral
1,306
-
44,458
10,168
12,886
16.1
16.1
32.1
38.4
40.7
34.0
8.3
7.6
19.7
21.0
4.5
3.5
HUL
Neutral
857
-
185,421
34,940
38,957
17.5
17.7
20.8
24.7
41.2
34.7
45.8
36.6
110.5
114.2
5.1
4.6
ITC
Buy
328
409
262,807
41,068
45,068
37.8
37.4
13.9
15.9
23.5
20.6
7.9
6.9
34.1
33.8
6.0
5.5
Marico
Neutral
411
-
26,494
6,551
7,766
15.7
16.0
10.4
12.5
39.6
32.9
11.5
9.6
33.2
32.4
4.0
3.4
Nestle*
Accumulate
6,095
6,646
58,762
11,291
12,847
22.2
22.3
158.9
184.6
38.4
33.0
20.1
18.0
55.0
57.3
5.0
4.4
Tata Global
Buy
118
152
7,451
8,635
9,072
9.8
9.9
6.5
7.6
18.2
15.6
1.8
1.7
6.8
7.4
0.8
0.8
IT
HCL Tech^
Buy
950
1,132
133,581
42,038
47,503
23.5
23.5
56.4
62.9
16.8
15.1
3.9
3.0
23.2
19.8
2.8
2.3
Infosys
Buy
1,111
1,306
255,122
60,250
66,999
28.0
28.0
58.3
63.7
19.1
17.4
4.0
3.4
20.9
19.7
3.6
3.0
TCS
Buy
2,571
3,168
503,520
108,420
123,559
28.8
28.7
127.2
143.9
20.2
17.9
8.1
7.5
39.9
41.8
4.2
3.7
Tech Mahindra
Buy
516
646
49,638
25,566
28,890
16.0
17.0
26.3
31.9
19.6
16.2
3.5
3.0
17.9
18.6
1.7
1.4
Wipro
Buy
563
719
139,053
52,414
58,704
23.7
23.8
38.4
42.3
14.7
13.3
2.9
2.6
19.5
18.0
2.2
1.8
Media
D B Corp
Buy
309
356
5,678
2,241
2,495
27.8
27.9
21.8
25.6
14.2
12.1
3.7
3.3
26.7
28.5
2.5
2.2
HT Media
Neutral
83
-
1,923
2,495
2,603
11.2
11.2
7.3
8.6
11.3
9.6
0.9
0.8
7.4
8.1
0.3
0.3
Market Outlook
August 31, 2015
Stock Watch
Company Name
Reco
CMP
Target
Mkt Cap
Sales ( Čcr )
OPM(%)
EPS (Č)
PER(x)
P/BV(x)
RoE(%)
EV/Sales(x)
(Č)
Price ( Č)
( Č cr )
FY16E FY17E
FY16E
FY17E
FY16E
FY17E
FY16E
FY17E
FY16E
FY17E
FY16E
FY17E
FY16E
FY17E
Media
Jagran Prakashan
Buy
134
156
4,381
1,939
2,122
26.0
26.0
8.3
9.2
16.1
14.6
2.8
2.5
17.5
17.1
2.2
2.0
Sun TV Network
Neutral
334
-
13,174
2,779
3,196
70.2
70.5
22.8
27.3
14.7
12.3
3.6
3.3
26.7
28.3
4.5
3.9
Hindustan Media
Buy
214
292
1,568
920
1,031
20.0
20.0
19.2
20.9
11.1
10.2
1.8
1.6
16.4
15.3
1.2
1.1
Ventures
Metals & Mining
Coal India
Accumulate
357
400
225,747
72,015
78,415
21.2
21.5
21.7
25.3
16.5
14.2
5.6
5.5
33.1
39.1
2.4
2.2
Hind. Zinc
Neutral
132
-
55,732
15,546
16,821
47.5
49.0
19.7
20.3
6.7
6.5
1.1
1.0
17.2
16.6
1.3
0.9
Hindalco
Neutral
82
-
16,881
112,328
119,817
7.7
7.9
16.3
20.1
5.0
4.1
0.4
0.3
8.0
8.5
0.6
0.5
JSW Steel
Neutral
927
-
22,399
48,125
53,595
18.8
21.0
46.9
97.5
19.8
9.5
1.0
0.9
4.4
9.5
1.3
1.1
NMDC
Neutral
101
-
39,925
12,544
13,330
59.5
59.7
16.3
16.5
6.2
6.1
1.1
1.0
5.1
9.9
1.9
1.9
SAIL
Neutral
52
-
21,518
56,365
63,383
6.9
8.0
7.1
8.2
7.3
6.4
0.5
0.4
7.0
7.1
0.9
0.9
Vedanta
Neutral
97
-
28,624
81,842
88,430
30.6
32.8
20.2
25.7
4.8
3.8
0.4
0.3
7.5
8.5
0.7
0.5
Tata Steel
Neutral
229
-
22,192
136,805
149,228
11.3
11.9
26.4
36.8
8.7
6.2
0.7
0.6
6.0
8.0
0.7
0.6
Oil & Gas
Cairn India
Neutral
145
-
27,232
12,617
14,513
33.7
40.0
25.5
27.7
5.7
5.2
0.4
0.4
7.4
7.7
0.8
0.7
GAIL
Neutral
290
-
36,760
75,595
85,554
8.6
8.0
31.8
36.1
9.1
8.0
1.0
0.9
10.7
11.4
0.6
0.5
ONGC
Neutral
244
-
208,369
174,773
192,517
22.7
24.8
34.6
38.2
7.0
6.4
1.0
0.9
14.2
14.9
1.3
1.1
Petronet LNG
Buy
176
210
13,178
39,007
40,785
3.8
4.2
9.2
11.0
19.2
16.0
2.1
2.0
11.6
12.7
0.4
0.4
Indian Oil Corp
Accumulate
405
455
98,393
359,607
402,760
5.9
6.1
42.5
48.7
9.6
8.3
1.3
1.1
14.1
14.4
0.4
0.3
Reliance Industries
Buy
871
1,050
282,107
339,083
384,014
7.8
9.5
75.7
94.5
11.5
9.2
1.1
1.1
10.7
12.2
1.2
1.0
Pharmaceuticals
Alembic Pharma
Neutral
704
-
13,269
2,601
3,115
21.2
20.2
20.8
23.9
33.8
29.5
10.9
8.2
37.2
31.8
5.1
4.2
Aurobindo Pharma
Accumulate
755
824
44,075
14,435
16,600
22.6
22.6
36.1
41.2
20.9
18.3
6.2
4.7
34.5
29.3
3.4
2.9
Aventis*
Neutral
3,977
-
9,160
2,156
2,455
15.1
16.8
109.7
133.9
36.3
29.7
5.0
4.1
18.4
22.5
4.0
3.3
Cadila Healthcare
Neutral
1,925
-
39,414
10,224
11,840
20.0
21.0
71.0
85.6
27.1
22.5
7.3
5.7
30.1
28.5
3.9
3.3
Cipla
Neutral
660
-
52,985
14,051
16,515
20.4
18.7
26.6
28.4
24.8
23.2
4.2
3.6
18.2
16.5
3.8
3.1
Dr Reddy's
Neutral
4,179
-
71,241
17,903
20,842
22.7
22.8
160.5
189.5
26.0
22.1
5.3
4.4
22.2
21.7
3.9
3.3
Dishman Pharma
Buy
210
294
1,694
1,716
1,888
20.2
20.2
16.3
21.6
12.9
9.7
1.2
1.1
9.7
11.7
1.2
0.9
GSK Pharma*
Neutral
3,375
-
28,590
2,870
3,158
20.0
22.1
59.5
68.3
56.7
49.4
16.7
17.2
28.5
34.3
9.5
8.7
Indoco Remedies
Neutral
332
-
3,063
1,088
1,262
18.2
18.2
13.1
15.5
25.4
21.5
5.0
4.1
21.2
21.1
2.9
2.5
Ipca labs
Neutral
786
-
9,915
3,507
4,078
17.6
18.6
25.8
32.0
30.5
24.6
3.9
3.4
13.8
14.9
3.1
2.6
Lupin
Neutral
1,863
-
83,837
14,864
17,244
26.9
26.9
62.1
71.1
30.0
26.2
7.3
5.8
27.4
24.6
5.4
4.5
Sun Pharma
Accumulate
885
950
212,958
28,163
32,610
25.8
30.7
17.4
26.9
50.9
32.9
4.8
4.2
13.0
16.6
7.0
5.9
Market Outlook
August 31, 2015
Stock Watch
Company Name
Reco
CMP
Target
Mkt Cap
Sales ( Čcr )
OPM(%)
EPS (Č)
PER(x)
P/BV(x)
RoE(%)
EV/Sales(x)
(Č)
Price ( Č)
( Č cr )
FY16E FY17E
FY16E
FY17E
FY16E
FY17E
FY16E
FY17E
FY16E
FY17E
FY16E
FY17E
FY16E
FY17E
Power
Tata Power
Neutral
61
-
16,512
38,302
38,404
14.1
13.1
5.1
6.0
11.9
10.2
1.1
1.1
9.2
10.3
1.3
1.3
NTPC
Buy
122
157
100,265
87,064
98,846
23.5
23.5
11.7
13.2
10.4
9.2
1.2
1.1
11.4
12.1
2.2
1.9
Power Grid
Buy
135
170
70,417
20,702
23,361
86.7
86.4
12.1
13.2
11.1
10.2
1.6
1.5
15.6
15.1
8.3
7.8
Telecom
Bharti Airtel
Neutral
362
-
144,806
101,748
109,191
32.1
31.7
12.0
12.5
30.2
29.0
2.1
2.0
6.9
6.7
2.1
1.9
Idea Cellular
Neutral
154
-
55,330
34,282
36,941
32.0
31.5
5.9
6.2
26.1
24.8
2.4
2.2
9.9
9.3
2.2
2.1
zOthers
Abbott India
Neutral
4,785
-
10,168
2,715
3,153
14.5
14.1
134.3
152.2
35.6
31.4
8.9
7.3
27.4
25.6
3.5
2.9
Bajaj Electricals
Buy
249
341
2,509
4,719
5,287
5.2
5.8
8.6
12.7
29.1
19.7
3.3
2.9
11.4
14.8
0.5
0.5
Finolex Cables
Neutral
244
-
3,726
2,728
3,036
10.8
11.0
14.4
16.8
16.9
14.5
2.6
2.2
15.2
15.3
1.1
0.9
Goodyear India*
Buy
562
655
1,296
1,953
1,766
12.4
12.0
67.4
59.6
8.3
9.4
2.1
1.8
27.7
20.2
0.4
0.4
Hitachi
Neutral
1,383
-
3,760
1,806
2,112
9.0
9.2
28.6
29.1
48.4
47.6
12.0
9.7
28.1
22.6
2.2
1.8
Jyothy Laboratories
Neutral
318
-
5,748
1,620
1,847
11.5
11.5
7.3
8.5
43.6
37.5
5.6
5.2
13.3
14.4
3.4
2.9
MRF
Accumulate
40,966
43,575
17,374
20,727
14,841
19.3
18.6
4,905.8
3,351.9
8.4
12.2
2.7
2.2
37.6
19.6
0.8
1.1
Page Industries
Neutral
14,263
-
15,909
1,929
2,450
19.8
20.1
229.9
299.0
62.0
47.7
27.4
19.0
52.1
47.1
8.3
6.5
Relaxo Footwears
Neutral
531
-
6,369
1,767
2,152
12.3
12.5
19.3
25.1
27.6
21.2
6.8
5.2
27.7
27.8
3.7
3.0
Siyaram Silk Mills
Buy
1,048
1,221
982
1,653
1,873
11.7
12.2
99.3
122.1
10.6
8.6
1.9
1.6
19.5
20.2
0.8
0.7
Styrolution ABS India*
Neutral
763
-
1,341
1,271
1,440
8.6
9.2
32.0
41.1
23.8
18.6
2.4
2.2
10.7
12.4
1.0
0.9
Tree House
Accumulate
395
449
1,671
259
324
56.8
56.8
17.0
21.7
23.2
18.2
2.3
2.1
10.1
11.5
6.4
5.3
TVS Srichakra
Buy
2,552
3,210
1,954
2,127
2,388
15.2
14.9
237.7
267.5
10.7
9.5
4.6
3.2
51.7
39.8
1.0
0.8
HSIL
Buy
267
434
1,927
2,085
2,436
18.5
18.6
21.7
28.9
12.3
9.2
1.2
1.1
10.0
12.1
1.1
0.8
Kirloskar Engines India
Accumulate
280
297
4,049
2,634
3,252
10.1
12.0
10.9
17.4
25.7
16.1
2.9
2.6
11.4
16.8
1.2
0.9
Ltd
M M Forgings
Buy
630
797
760
563
671
22.1
22.9
51.0
66.5
12.4
9.5
2.6
2.1
23.1
24.1
1.5
1.2
Banco Products (India)
Neutral
126
-
901
1,208
1,353
11.0
12.3
10.8
14.5
11.7
8.7
1.3
1.2
11.9
14.5
0.7
0.6
Competent Automobiles Neutral
163
-
100
1,007
1,114
3.1
3.1
23.7
28.2
6.9
5.8
1.0
0.8
13.9
14.6
0.1
0.1
Nilkamal
Neutral
994
-
1,483
1,948
2,147
10.6
10.3
60.0
67.0
16.6
14.8
2.6
2.2
16.8
16.1
0.8
0.7
Visaka Industries
Accumulate
153
166
242
1,158
1,272
8.6
9.5
23.7
32.7
6.4
4.7
0.7
0.6
10.1
12.5
0.4
0.3
Transport Corporation of
Accumulate
273
293
2,078
2,830
3,350
8.8
9.0
14.4
18.3
19.0
14.9
2.9
2.6
15.4
17.1
0.9
0.7
India
Elecon Engineering
Buy
70
87
767
1,452
1,596
14.0
14.7
4.4
6.2
15.9
11.3
1.3
1.2
8.6
11.2
0.8
0.7
Surya Roshni
Buy
129
183
565
2,992
3,223
8.3
8.5
14.7
18.3
8.8
7.1
0.8
0.7
9.8
11.0
0.5
0.4
MT Educare
Buy
137
169
544
286
366
18.3
17.7
7.7
9.4
17.7
14.6
3.7
3.3
20.2
21.1
1.8
1.4
Market Outlook
August 31, 2015
Stock Watch
Company Name
Reco
CMP
Target Mkt Cap
Sales ( Čcr )
OPM(%)
EPS (Č)
PER(x)
P/BV(x)
RoE(%)
EV/Sales(x)
(Č)
Price ( Č)
( Č cr )
FY16E FY17E FY16E FY17E FY16E FY17E FY16E FY17E FY16E FY17E FY16E FY17E FY16E FY17E
zOthers
Radico Khaitan
Buy
91
112
1,213
1,565
1,687
11.9
12.4
5.4
6.6
16.9
13.9
1.4
1.3
8.0
9.0
1.3
1.2
Garware Wall Ropes
Buy
298
390
652
875
983
10.4
10.6
23.1
27.8
12.9
10.7
1.8
1.6
14.1
14.8
0.8
0.6
Source: Company, Angel Research; Note: *December year end; #September year end; &October year end; Price as on August 28, 2015
Market Outlook
August 31, 2015
Research Team Tel: 022 - 39357800
DISCLAIMER
Angel Broking Private Limited (hereinafter referred to as “Angel”) is a registered Member of National Stock Exchange of India Limited,
Bombay Stock Exchange Limited and MCX Stock Exchange Limited. It is also registered as a Depository Participant with CDSL and
Portfolio Manager with SEBI. It also has registration with AMFI as a Mutual Fund Distributor. Angel Broking Private Limited is a registered
entity with SEBI for Research Analyst in terms of SEBI (Research Analyst) Regulations, 2014 vide registration number INH000000164.
Angel or its associates has not been debarred/ suspended by SEBI or any other regulatory authority for accessing /dealing in securities
Market. Angel or its associates including its relatives/analyst do not hold any financial interest/beneficial ownership of more than 1% in
the company covered by Analyst. Angel or its associates/analyst has not received any compensation / managed or co-managed public
offering of securities of the company covered by Analyst during the past twelve months. Angel/analyst has not served as an officer,
director or employee of company covered by Analyst and has not been engaged in market making activity of the company covered by
Analyst.
This document is solely for the personal information of the recipient, and must not be singularly used as the basis of any investment
decision. Nothing in this document should be construed as investment or financial advice. Each recipient of this document should make
such investigations as they deem necessary to arrive at an independent evaluation of an investment in the securities of the companies
referred to in this document (including the merits and risks involved), and should consult their own advisors to determine the merits and
risks of such an investment.
Reports based on technical and derivative analysis center on studying charts of a stock's price movement, outstanding positions and
trading volume, as opposed to focusing on a company's fundamentals and, as such, may not match with a report on a company's
fundamentals.
The information in this document has been printed on the basis of publicly available information, internal data and other reliable sources
believed to be true, but we do not represent that it is accurate or complete and it should not be relied on as such, as this document is for
general guidance only. Angel Broking Pvt. Limited or any of its affiliates/ group companies shall not be in any way responsible for any
loss or damage that may arise to any person from any inadvertent error in the information contained in this report. Angel Broking Pvt.
Limited has not independently verified all the information contained within this document. Accordingly, we cannot testify, nor make any
representation or warranty, express or implied, to the accuracy, contents or data contained within this document. While Angel Broking
Pvt. Limited endeavors to update on a reasonable basis the information discussed in this material, there may be regulatory, compliance,
or other reasons that prevent us from doing so.
This document is being supplied to you solely for your information, and its contents, information or data may not be reproduced,
redistributed or passed on, directly or indirectly.
Neither Angel Broking Pvt. Limited, nor its directors, employees or affiliates shall be liable for any loss or damage that may arise from or
in connection with the use of this information.
Note: Please refer to the important ‘Stock Holding Disclosure' report on the Angel website (Research Section). Also, please refer to the
latest update on respective stocks for the disclosure status in respect of those stocks. Angel Broking Pvt. Limited and its affiliates may have
investment positions in the stocks recommended in this report.