Market Outlook
December 30, 2015
Market Cues
Domestic Indices
Chg (%)
(Pts)
(Close)
Indian markets are expected to open flat tracking the SGX Nifty and Asian peers.
BSE Sensex
0.2
45
26,079
U.S. markets closed sharply higher led by better than expected consumer confidence
Nifty
0.0
4
7,929
data for December. Volumes were however low ahead of the New year’s day
Mid Cap
0.4
47
11,081
holiday with many traders remaining on the sidelines.
Small Cap
(0.1)
(15)
11,770
European markets bounced back after a pull back in the previous session to close
Bankex
0.2
47
19,431
firmly in the green. Trading activity remained light in Europe as well ahead of
Friday's New Year's Day holiday.
Global Indices
Chg (%)
(Pts)
(Close)
Indian markets had a choppy session with markets managing to close barely in the
Dow Jones
1.1
193
17,721
positive. The late recovery was on account of positive European cues. Volumes
Nasdaq
1.3
67
5,108
continued to remain low led on account of the holiday season.
FTSE
1.0
60
6,315
News & Result Analysis
Nikkei
0.6
109
18,982
Airtel acquires 74% in Augere to expand 4G play
Hang Seng
0.4
80
22,000
Detailed analysis on Pg2
Shanghai Com
0.8
30
3,564
Investor’s Ready Reckoner
Key Domestic & Global Indicators
Advances / Declines
BSE
NSE
Stock Watch: Latest investment recommendations on 150+ stocks
Advances
1,163
650
Refer P4 onwards
Declines
1,514
916
Unchanged
246
51
Top Picks
CMP
Target
Upside
Company
Sector
Rating
(`)
(`)
(%)
Volumes (` Cr)
Axis Bank
Financials
Buy
458
630
37.6
BSE
2,541
HCL Tech
IT
Buy
855
1,132
32.5
NSE
14,474
ICICI Bank
Financials
Buy
265
354
33.5
Ashok Leyland
Automobiles
Buy
90
111
23.8
Net Inflows (` Cr)
Net
Mtd
Ytd
Larsen & Toubro
Construction
Buy
1,289
1,646
27.7
More Top Picks on Pg3
FII
590
(943)
16,916
MFs
162
3,148
66,414
Key Upcoming Events
Previous
Consensus
Date
Region
Event Description
Reading
Expectations
Top Gainers
Price (`)
Chg (%)
Dec 31
USA
Initial Jobless claims - Dec 26 (in `000s)
267
270
Sreinfra
59
13.4
Jan 1
China
PMI Manufacturing
49.6
49.8
J&Kbank
83
10.0
Jan 8
India
Imports YoY% - Dec (% change)
(30.30)
-
Ttkprestig
4,776
7.6
Jan 8
India
Exports YoY% - Dec (% change)
(24.43)
-
Naukri
899
7.2
Carerating
1,365
6.1
Top Losers
Price (`)
Chg (%)
Pipavavdoc
89
(9.4)
Pmcfin
1
(7.1)
Gppl
139
(4.6)
Shriramcit
1,524
(4.4)
Kscl
353
(4.4)
As on December 29, 2015
Market Outlook
December 30, 2015
Airtel acquires 74% in Augere to expand 4G play
Bharti Airtel has bought a 74% stake in Augere Wireless Broadband India,
consolidating its 4G footprint ahead of the launch of similar high-speed
broadband services by Reliance Jio Infocomm. Airtel didn't disclose the financial
terms of the acquisition.
Previously, sources with knowledge of the deal had put the value of Augere's
airwaves at close to `150cr. Bharti Airtel said on August 26 that it had signed a
definitive pact to acquire 100% equity stake in Augere. Airtel will gradually
increase its stake to 100% as per a person familiar with the matter.
Augere had won a block of 20 MHz of 4G spectrum in the 2300 MHz band in the
Madhya Pradesh-Chhattisgarh circle for `122.46cr in the 2010 auction. The
company, owned by France Telecom and private equity funds such as Harbinger
Capital and New Silk Route, planned to roll out 4G services in late 2011, although
it decided not to go ahead, citing uncertain regulatory conditions. It had been
looking to sell its permit ever since.
Airtel's latest move will allow it to expand its 4G high-speed broadband footprint
ahead of the commercial 4G launch by Reliance Jio, expected in March-April.
Rivals Vodafone and Idea have also started 4G services in some circles, while
Airtel has already launched in over 350 towns and cities.
Airtel had bought airwaves in the 2300 MHz band in Kolkata, Maharashtra,
Punjab and Karnataka in 2010 and later acquired chipmaker Qualcomm's
airwaves in Delhi, Mumbai, Kerala and Haryana. It later purchased spectrum in
the 1800 MHz band through auctions. Through a mix of the two bands, Airtel now
holds 4G airwaves in 15 circles. In March, Airtel entered into a partnership with
China Mobile to jointly source devices and equipment as well as develop 4G
technology and standards. China Mobile uses the TDD LTE (2300 MHz) standard
for its 4G services, which is similar to Airtel's, although globally, use of the 1800
MHz band for 4G is more widespread. We retain our neutral view on the stock.
Economic and Political News
FIPB clears 4 FDI proposals worth `1,810cr
India likely to grow at 7-7.5% in 2016: Kaushik Basu
FDI flow into India jumped by 35% in last 17 months: DIPP Secretary Amitabh
Kant
Corporate News
HDFC Bank cuts lending rate by 0.05%
USL to declare sick, refers to BIFR due to net worth erosion by 86%
BNP Paribas to acquire 5% in Srei Infrastructure
SpiceJet gets nod to raise up to `5,000cr
Market Outlook
December 30, 2015
Top Picks HHHHH
Large Cap
Market Cap
CMP
Target
Upside
Company
Rationale
(` Cr)
(`)
(`)
(%)
To outpace battery industry growth due to better technological
Amara Raja Batteries
14,767
865
1,040
20.3
products leading to market share gains in both the automotive
OEM and replacement segments.
Earnings to grow strongly given the MHCV cyclical upturn.
Ashok Leyland
25,513
90
111
23.8
Focus on exports and LCV's provides additional growth
avenue.
Healthy pace of branch expansion, backed by distribution
Axis Bank
1,08,876
458
630
37.6
network, will be the driving force for the bank’s retail business
and overall earnings.
The stock is trading at attractive valuations and is factoring all
HCL Tech
1,20,416
855
1,132
32.5
the bad news.
Strong visibility for a robust 20% earnings trajectory, coupled
HDFC Bank
2,72,004
1,078
1,262
17.1
with high quality of earnings on account of high quality retail
business and strategic focus on highly rated corporates.
Due to its robust franchise and capital adequacy position, the
bank is well positioned to grow by at least a few percentage
ICICI Bank
1,54,135
265
354
33.5
points higher than the average industry growth rate from a
structural point of view.
Back on the growth trend, expect a long term growth of 14%
Infosys
2,53,525
1,104
1,306
18.3
to be a US$20bn in FY2020.
Well positioned to benefit from such expected gradual
recovery in the overall domestic capex cycle, given its presence
Larsen & Toubro
1,20,062
1,289
1,646
27.7
across various infrastructure segments, its execution
capabilities, and its strong balance sheet.
LICHF continues to grow its retail loan book at a healthy pace
with improvement in asset quality. We expect the company to
LIC Housing Finance
25,357
502
571
13.6
post a healthy loan book which is likely to reflect in a strong
earnings growth.
Source: Company, Angel Research
Mid Cap
Market Cap
CMP
Target
Upside
Company
Rationale
(` Cr)
(`)
(`)
(%)
Favourable outlook for the AC industry to augur well for
Cooling products business which is out pacing the market
Blue Star
3,422
380
429
12.8
growth. EMPPAC division's profitability to improve once
operating environment turns around.
Change in business focus towards high-margin chronic &
Ipca labs
9,431
747
900
20.4
lifestyle segments and increasing penetration in Europe and
US
Economic recovery to have favourable impact on advertising &
circulation revenue growth. Further, the acquisition of a radio
Jagran Prakashan
5,137
157
169
7.5
business (Radio City) would also boost the company's revenue
growth.
Earnings boost on back of stable material prices and
Radico Khaitan
1,485
112
156
39.7
favourable pricing environment. Valuation discount to peers
provides additional comfort
Strong brands and distribution network would boost growth
Siyaram Silk Mills
1,111
1,185
1,354
14.2
going ahead. Stock currently trades at an inexpensive
valuation.
Structural shift in the Lighting industry towards LED lighting will
Surya Roshni
629
144
183
27.4
drive growth.
Source: Company, Angel Research
Market Outlook
December 30, 2015
Key Upcoming Events
Global economic events release calendar
Date
Time
Country
Event Description
Unit
Period
Bloomberg Data
Last Reported Estimated
Dec 31, 2015
7:00PM
US
Initial Jobless claims
Thousands
Dec 26
267.00
270.00
Jan 1, 2016
6:30AM
China
PMI Manufacturing
Value
Dec
49.60
49.80
Jan 4, 2016
2:25PM
Germany
PMI Manufacturing
Value
Dec F
53.00
53.00
3:00PM
UK
PMI Manufacturing
Value
Dec
52.70
52.90
Jan 5, 2016
2:25PM
Germany
Unemployment change (000's)
Thousands
Dec
(13.00)
(8.00)
Jan 6, 2016
2:25PM
Germany
PMI Services
Value
Dec F
55.40
55.40
Jan 7, 2016
3:30PM
Euro Zone
Euro-Zone Consumer Confidence
Value
Dec F
(5.70)
(5.70)
Jan 8, 2016
India
Imports YoY%
% Change
Dec
(30.30)
--
India
Exports YoY%
% Change
Dec
(24.43)
--
7:00PM
US
Change in Nonfarm payrolls
Thousands
Dec
211.00
200.00
7:00PM
US
Unnemployment rate
%
Dec
5.00
5.00
Jan 9, 2016
7:00AM
China
Consumer Price Index (YoY)
% Change
Dec
1.50
1.50
Jan 12, 2016
5:30PM
India
Industrial Production YoY
% Change
Nov
9.80
--
3:00PM
UK
Industrial Production (YoY)
% Change
Nov
1.70
--
Jan 14, 2016
12:00PM
India
Monthly Wholesale Prices YoY%
% Change
Dec
(1.99)
--
5:30PM
UK
BOE Announces rates
% Ratio
Jan 14
0.50
0.50
Jan 15, 2016
7:45PM
US
Industrial Production
%
Dec
(0.56)
--
US
Producer Price Index (mom)
% Change
Dec
0.10
--
Jan 19, 2016
3:00PM
UK
CPI (YoY)
% Change
Dec
0.10
--
7:30AM
China
Industrial Production (YoY)
% Change
Dec
6.20
--
7:30AM
China
Real GDP (YoY)
% Change
4Q
6.90
--
Jan 20, 2016
7:00PM
US
Housing Starts
Thousands
Dec
1,173.00
--
7:00PM
US
Building permits
Thousands
Dec
1,282.00
--
3:00PM
UK
Jobless claims change
% Change
Dec
3.90
--
7:00PM
US
Consumer price index (mom)
% Change
Dec
--
--
Jan 21, 2016
3:30PM
Euro Zone
Euro-Zone CPI (YoY)
%
Dec F
0.20
--
6:15PM
Euro Zone
ECB announces interest rates
%
Jan 21
0.05
--
Jan 22, 2016
8:30PM
US
Existing home sales
Million
Dec
4.76
--
Jan 27, 2016
8:30PM
US
New home sales
Thousands
Dec
490.00
--
Jan 28, 2016
3:00PM
UK
GDP (YoY)
% Change
4Q A
2.10
--
12:30AM
US
FOMC rate decision
%
Jan 27
0.50
0.50
Jan 29, 2016
7:00PM
US
GDP Qoq (Annualised)
% Change
4Q A
2.00
--
Source: Bloomberg, Angel Research
Market Outlook
December 30, 2015
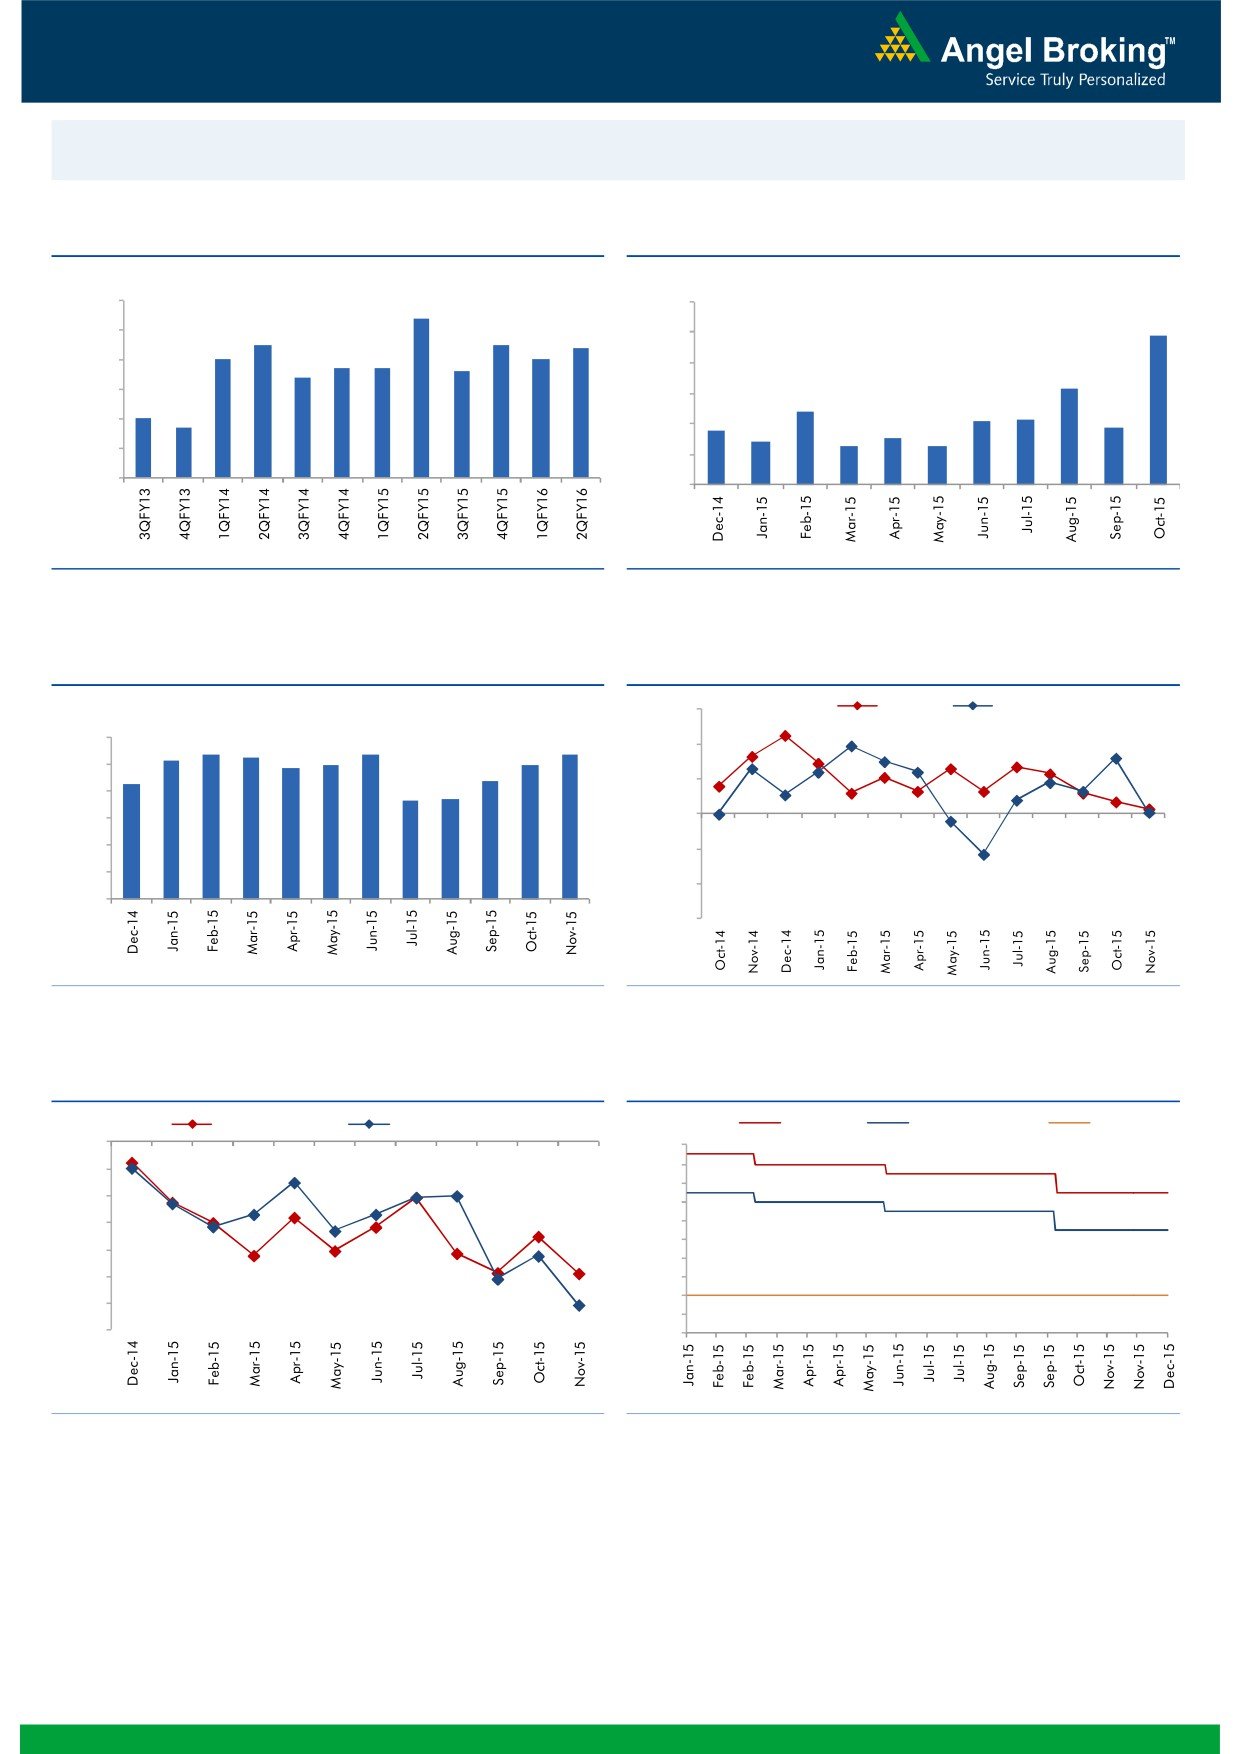
Macro watch
Exhibit 1: Quarterly GDP trends
Exhibit 2: IIP trends
(%)
(%)
9.0
8.4
12.0
9.8
8.0
7.5
7.5
7.4
10.0
7.0
7.0
6.7
6.7
6.6
7.0
6.4
8.0
6.3
6.0
6.0
4.8
5.0
4.2
4.3
4.7
3.6
3.8
5.0
4.0
2.8
3.0
2.5
2.5
4.0
2.0
3.0
-
Source: CSO, Angel Research
Source: MOSPI, Angel Research
Exhibit 3: Monthly CPI inflation trends
Exhibit 4: Manufacturing and services PMI
(%)
56.0
Mfg. PMI
Services PMI
6.0
5.4
5.3
5.4
5.4
5.2
5.0
5.0
54.0
4.9
5.0
4.3
4.4
3.7
3.7
52.0
4.0
3.0
50.0
2.0
48.0
1.0
46.0
-
44.0
Source: MOSPI, Angel Research
Source: Market, Angel Research; Note: Level above 50 indicates expansion
Exhibit 5: Exports and imports growth trends
Exhibit 6: Key policy rates
(%)
Exports yoy growth
Imports yoy growth
(%)
Repo rate
Reverse Repo rate
CRR
0.0
8.00
(5.0)
7.50
7.00
(10.0)
6.50
(15.0)
6.00
5.50
(20.0)
5.00
(25.0)
4.50
4.00
(30.0)
3.50
(35.0)
3.00
Source: Bloomberg, Angel Research
Source: RBI, Angel Research
Market Outlook
December 30, 2015
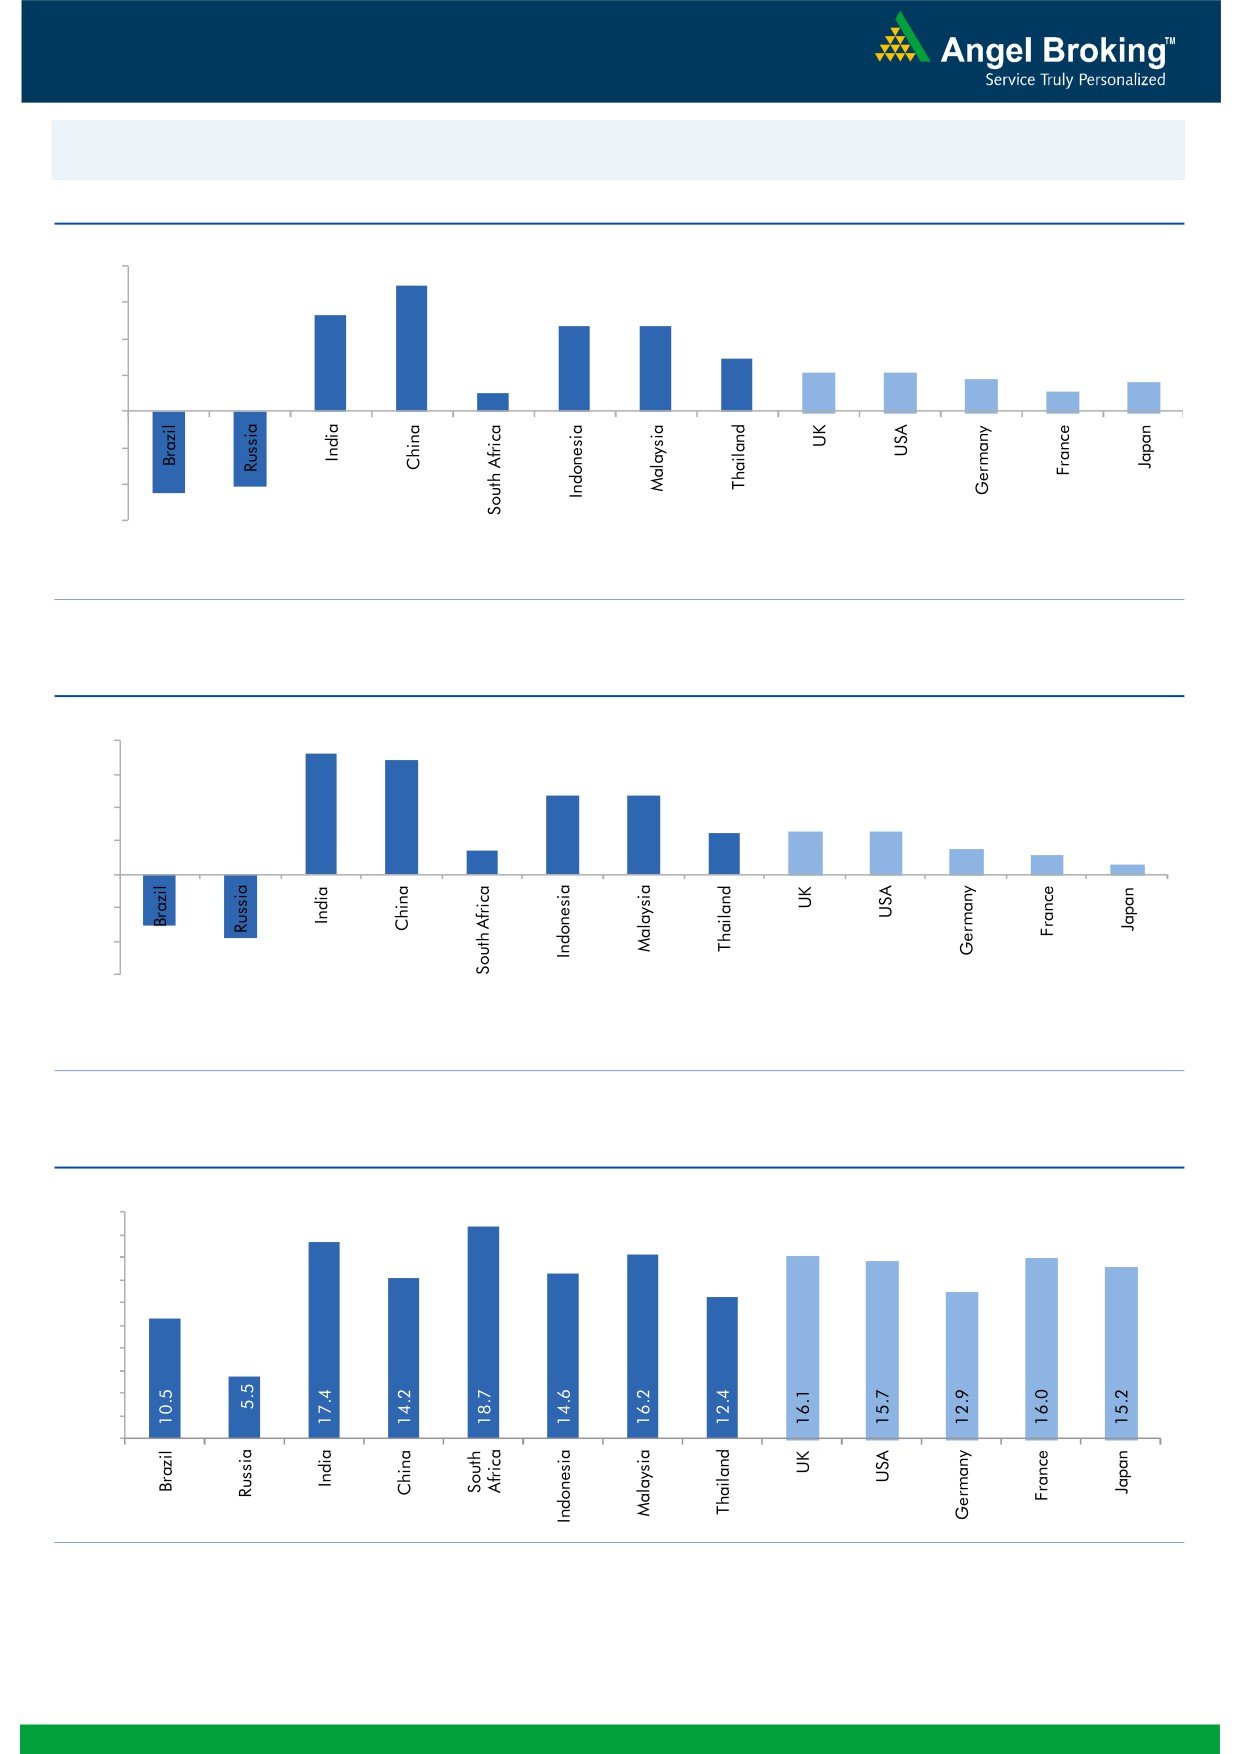
Global watch
Exhibit 1: Latest quarterly GDP Growth (%, yoy) across select developing and developed countries
(%)
8.0
6.9
6.0
5.3
4.7
4.7
4.0
2.9
2.1
2.1
1.8
2.0
1.0
1.1
1.6
-
(2.0)
(4.0)
(4.1)
(4.5)
(6.0)
Source: Bloomberg, Angel Research
Exhibit 2: 2015 GDP Growth projection by IMF (%, yoy) across select developing and developed countries
(%)
7.3
8.0
6.8
6.0
4.7
4.7
4.0
2.5
2.5
2.6
1.4
1.5
2.0
1.2
0.6
(3.8)
-
(2.0)
(4.0)
(3.0)
(6.0)
Source: IMF, Angel Research
Exhibit 3: One year forward P-E ratio across select developing and developed countries
(x)
20.0
18.0
16.0
14.0
12.0
10.0
8.0
6.0
4.0
2.0
-
Source: IMF, Angel Research
Market Outlook
December 30, 2015
Exhibit 4: Relative performance of indices across globe
Returns (%)
Country
Name of index
Closing price
1M
3M
1YR
Brazil
Bovespa
43,654
(6.9)
(3.7)
(10.0)
Russia
Micex
1,763
(1.8)
8.1
24.4
India
Nifty
7,929
0.6
1.5
(4.1)
China
Shanghai Composite
3,564
3.5
13.4
14.7
South Africa
Top 40
45,997
(1.4)
4.0
3.4
Mexico
Mexbol
43,392
(2.2)
2.3
0.5
Indonesia
LQ45
788
0.8
11.3
(8.6)
Malaysia
KLCI
1,685
0.1
4.5
(1.8)
Thailand
SET 50
812
(8.4)
(8.8)
(17.6)
USA
Dow Jones
17,721
(0.5)
10.7
(1.5)
UK
FTSE
6,315
(0.4)
6.0
(3.8)
Japan
Nikkei
18,982
(4.8)
8.0
12.9
Germany
DAX
10,860
(2.8)
14.5
11.2
France
CAC
4,701
(4.9)
8.2
15.1
Source: Bloomberg, Angel Research
Stock Watch
December 30, 2015
Company Name
Reco
CMP
Target
Mkt Cap
Sales ( Čcr )
OPM(%)
EPS (Č)
PER(x)
P/BV(x)
RoE(%)
EV/Sales(x)
(Č)
Price ( Č)
( Č cr )
FY16E FY17E
FY16E
FY17E
FY16E
FY17E
FY16E
FY17E
FY16E
FY17E
FY16E
FY17E
FY16E
FY17E
Agri / Agri Chemical
Rallis
Neutral
179
-
3,482
2,075
2,394
14.4
14.4
9.5
11.0
18.9
16.3
3.8
3.2
21.1
21.3
1.7
1.5
United Phosphorus
Buy
433
510
18,554
13,698
15,752
17.6
17.6
32.1
38.5
13.5
11.2
2.6
2.2
21.4
21.3
1.5
1.2
Auto & Auto Ancillary
Ashok Leyland
Buy
90
111
25,513
17,995
21,544
11.4
11.6
3.4
4.7
26.4
19.1
4.6
4.3
17.7
22.2
1.4
1.1
Bajaj Auto
Accumulate
2,531
2,728
73,243
23,695
27,298
21.3
20.4
134.6
151.5
18.8
16.7
6.0
5.1
31.8
30.6
2.6
2.3
Bharat Forge
Accumulate
893
943
20,794
7,867
8,881
20.0
20.3
34.4
41.0
26.0
21.8
5.0
4.2
21.1
20.9
2.8
2.4
Eicher Motors
Accumulate
16,703
19,036
45,356
15,379
16,498
15.6
16.6
473.2
574.8
35.3
29.1
13.1
9.7
36.7
33.2
2.9
2.6
Gabriel India
Accumulate
96
101
1,379
1,415
1,544
8.7
9.0
4.6
5.4
20.9
17.8
3.8
3.4
18.1
18.9
1.0
0.8
Hero Motocorp
Neutral
2,734
-
54,600
28,561
31,559
14.7
14.7
151.1
163.2
18.1
16.8
7.0
6.0
38.7
35.6
1.8
1.6
Jamna Auto Industries Neutral
141
-
1,126
1,292
1,486
9.3
9.8
6.0
7.5
23.5
18.8
4.9
4.1
20.7
21.8
0.9
0.8
L G Balakrishnan & Bros Neutral
519
-
815
1,254
1,394
11.6
11.8
35.9
41.7
14.5
12.5
2.0
1.7
13.5
13.8
0.8
0.7
Mahindra and Mahindra Accumulate
1,265
1,449
78,568
39,031
44,440
13.8
13.9
57.9
67.6
21.9
18.7
3.5
3.1
16.1
16.6
1.7
1.4
Maruti
Neutral
4,639
-
140,123
57,865
68,104
16.4
16.7
176.3
225.5
26.3
20.6
5.1
4.4
19.4
21.2
2.2
1.8
Minda Industries
Neutral
903
-
1,432
2,567
2,965
8.0
8.3
46.1
57.8
19.6
15.6
3.3
2.7
16.7
17.3
0.7
0.6
Motherson Sumi
Accumulate
297
313
39,232
39,343
45,100
8.8
9.1
10.1
12.5
29.4
23.7
9.3
7.3
35.3
34.4
1.1
0.9
Rane Brake Lining
Accumulate
347
366
274
454
511
11.1
11.4
23.8
28.1
14.6
12.3
2.1
1.9
14.2
15.3
0.7
0.7
Setco Automotive
Neutral
43
-
578
594
741
12.7
13.7
1.7
3.2
25.5
13.5
2.7
2.3
10.4
16.9
1.4
1.2
Tata Motors
Neutral
391
-
112,846
255,254
301,772
12.9
13.4
23.7
37.3
16.5
10.5
2.0
1.7
7.4
12.1
0.6
0.6
TVS Motor
Buy
293
338
13,934
11,569
13,648
7.3
8.7
10.3
16.1
28.5
18.2
7.1
5.5
24.8
30.5
1.2
1.0
Amara Raja Batteries
Buy
865
1,040
14,767
4,892
5,871
17.4
17.6
28.8
37.1
30.0
23.3
7.0
5.6
23.4
24.1
3.0
2.4
Exide Industries
Accumulate
147
162
12,453
6,950
7,784
14.4
14.8
6.6
7.3
22.2
20.1
2.8
2.6
12.6
12.8
1.5
1.4
Apollo Tyres
Accumulate
157
171
7,987
12,146
12,689
16.8
16.0
21.2
19.0
7.4
8.3
1.2
1.1
16.5
13.0
0.7
0.8
Ceat
Accumulate
1,054
1,119
4,264
6,041
6,597
14.1
13.7
99.5
111.9
10.6
9.4
2.1
1.7
19.6
18.5
0.9
0.7
JK Tyres
Neutral
109
-
2,481
7,446
7,669
15.2
14.0
19.6
18.4
5.6
6.0
1.4
1.2
25.2
19.5
0.7
0.6
Swaraj Engines
Neutral
957
-
1,188
552
630
14.2
14.7
44.6
54.1
21.5
17.7
5.0
4.5
23.2
25.6
2.0
1.7
Subros
Neutral
110
-
661
1,268
1,488
11.6
11.9
3.7
6.6
29.8
16.7
2.0
1.8
6.8
11.4
0.8
0.7
Indag Rubber
Neutral
209
-
547
283
329
17.0
17.2
13.0
15.4
16.1
13.5
3.5
2.9
21.8
21.6
1.7
1.4
Capital Goods
ACE
Neutral
46
-
457
660
839
4.7
8.2
1.0
3.9
46.2
11.8
1.4
1.3
3.2
11.3
0.8
0.7
BEML
Neutral
1,295
-
5,392
3,277
4,006
6.0
8.9
29.2
64.3
44.3
20.1
2.5
2.3
5.7
11.7
1.7
1.4
Bharat Electronics
Accumulate
1,344
1,414
32,246
7,737
8,634
16.8
17.2
54.0
61.0
24.9
22.0
3.6
3.2
39.3
45.6
3.3
2.8
Stock Watch
December 30, 2015
Company Name
Reco
CMP
Target
Mkt Cap
Sales ( Čcr )
OPM(%)
EPS (Č)
PER(x)
P/BV(x)
RoE(%)
EV/Sales(x)
(Č)
Price ( Č)
( Č cr )
FY16E
FY17E
FY16E
FY17E
FY16E
FY17E
FY16E
FY17E
FY16E
FY17E
FY16E
FY17E
FY16E
FY17E
Capital Goods
Voltas
Accumulate
312
353
10,330
5,363
5,963
8.0
9.1
11.0
13.8
28.4
22.6
4.4
3.8
16.2
17.9
1.9
1.7
BGR Energy
Neutral
133
-
959
3,615
3,181
9.5
9.4
16.7
12.4
8.0
10.7
0.8
0.7
10.0
7.0
0.7
0.8
BHEL
Neutral
169
-
41,279
33,722
35,272
10.8
11.7
10.5
14.2
16.1
11.9
1.2
1.1
7.0
9.0
1.3
1.2
Blue Star
Accumulate
380
429
3,422
3,548
3,977
6.3
6.9
13.7
17.2
27.8
22.2
7.0
4.5
26.1
25.4
1.1
0.9
Crompton Greaves
Accumulate
193
204
12,115
13,484
14,687
4.9
6.2
4.5
7.1
43.0
27.2
3.0
2.8
7.2
10.8
1.0
0.9
Inox Wind
Buy
360
458
7,984
4,980
5,943
17.0
17.5
26.6
31.6
13.5
11.4
4.0
3.0
35.0
30.0
1.8
1.4
KEC International
Neutral
158
-
4,050
8,791
9,716
6.1
6.8
5.4
8.2
29.2
19.2
2.9
2.7
10.0
14.0
0.7
0.6
Thermax
Neutral
926
-
11,032
6,413
7,525
7.4
8.5
30.5
39.3
30.4
23.6
4.7
4.1
15.0
17.0
1.7
1.4
Cement
ACC
Buy
1,350
1,630
25,350
13,151
14,757
16.4
18.3
63.9
83.4
21.1
16.2
2.7
2.5
13.3
16.1
1.8
1.5
Ambuja Cements
Accumulate
205
233
31,884
11,564
12,556
19.4
20.7
8.9
10.1
23.1
20.3
2.9
2.7
12.8
13.8
2.4
2.2
HeidelbergCement
Neutral
78
-
1,768
1,772
1,926
13.3
15.4
1.0
3.0
78.0
26.0
2.0
1.8
2.6
7.9
1.6
1.4
India Cements
Buy
90
112
2,769
4,216
4,840
18.0
19.5
4.0
9.9
22.5
9.1
0.9
0.8
4.0
9.5
1.0
0.8
JK Cement
Buy
615
744
4,299
3,661
4,742
10.1
15.8
18.0
61.0
34.2
10.1
2.5
2.2
7.5
22.9
1.6
1.2
J K Lakshmi Cement
Buy
327
430
3,843
2,947
3,616
16.7
19.9
11.5
27.2
28.4
12.0
2.7
2.3
9.8
20.8
1.7
1.4
Mangalam Cements
Neutral
196
-
524
1,053
1,347
10.5
13.3
8.4
26.0
23.4
7.6
1.0
0.9
4.3
12.5
0.9
0.6
Orient Cement
Buy
148
183
3,023
1,854
2,524
21.2
22.2
7.7
11.1
19.2
13.3
2.8
2.4
13.3
15.7
2.4
1.7
Ramco Cements
Neutral
374
-
8,915
4,036
4,545
20.8
21.3
15.1
18.8
24.8
19.9
3.0
2.7
12.9
14.3
2.7
2.3
Shree Cement^
Neutral
11,160
-
38,878
7,150
8,742
26.7
28.6
228.0
345.5
48.9
32.3
7.2
6.0
15.7
20.3
5.2
4.2
UltraTech Cement
Buy
2,819
3,282
77,367
25,021
30,023
19.1
21.6
89.0
132.0
31.7
21.4
3.7
3.2
12.2
15.9
3.2
2.6
Construction
ITNL
Neutral
87
-
2,852
7,360
8,825
34.0
35.9
7.0
9.0
12.4
9.6
0.4
0.4
3.2
3.7
3.7
3.6
KNR Constructions
Buy
570
673
1,603
937
1,470
14.3
14.0
33.5
38.6
17.0
14.8
2.6
2.2
15.4
15.4
1.8
1.2
Larsen & Toubro
Buy
1,289
1,646
120,062
65,065
77,009
11.5
11.7
61.5
65.6
21.0
19.7
2.1
1.9
13.4
14.0
2.0
1.7
Gujarat Pipavav Port
Neutral
139
-
6,737
629
684
51.0
52.2
6.4
5.9
21.8
23.6
2.9
2.6
15.9
12.7
10.4
9.3
MBL Infrastructures
Buy
219
285
909
2,313
2,797
12.2
14.6
19.0
20.0
11.5
11.0
1.2
1.1
11.3
10.6
1.1
1.0
Nagarjuna Const.
Neutral
78
-
4,339
7,892
8,842
8.8
9.1
3.0
5.3
26.0
14.7
1.3
1.2
5.0
8.5
0.8
0.7
PNC Infratech
Neutral
533
-
2,735
1,873
2,288
13.2
13.5
24.0
32.0
22.2
16.7
2.2
1.9
12.1
12.3
1.6
1.3
Simplex Infra
Neutral
316
-
1,561
5,955
6,829
10.3
10.5
16.0
31.0
19.7
10.2
1.0
1.0
5.3
9.9
0.8
0.7
Power Mech Projects
Neutral
658
-
968
1,539
1,801
12.8
12.7
59.0
72.1
11.2
9.1
1.7
1.4
18.6
16.8
0.6
0.5
Sadbhav Engineering
Neutral
345
-
5,923
3,481
4,219
10.7
10.8
8.0
12.0
43.2
28.8
4.0
3.5
10.3
13.5
2.0
1.6
Stock Watch
December 30, 2015
Company Name
Reco
CMP
Target
Mkt Cap
Sales ( Čcr )
OPM(%)
EPS (Č)
PER(x)
P/BV(x)
RoE(%)
EV/Sales(x)
(Č)
Price ( Č)
( Č cr )
FY16E
FY17E
FY16E
FY17E
FY16E
FY17E
FY16E
FY17E
FY16E
FY17E
FY16E
FY17E
FY16E
FY17E
Construction
NBCC
Accumulate
992
1,089
11,906
7,382
9,506
7.7
8.6
39.8
54.4
24.9
18.2
6.0
4.8
26.7
29.1
1.4
1.0
MEP Infra
Neutral
47
-
767
1,956
1,876
28.1
30.5
1.3
3.0
36.3
15.7
7.6
5.1
21.2
32.8
1.8
1.8
SIPL
Neutral
98
-
3,436
675
1,042
62.4
64.7
-
-
3.7
4.2
-
-
16.8
11.3
Financials
Allahabad Bank
Neutral
70
-
4,174
8,569
9,392
2.8
2.9
16.3
27.5
4.3
2.5
0.4
0.3
7.6
11.9
-
-
Axis Bank
Buy
458
630
108,876
26,473
31,527
3.5
3.6
35.7
43.5
12.8
10.5
2.5
2.2
17.9
18.9
-
-
Bank of Baroda
Neutral
158
-
36,314
18,485
21,025
1.9
2.0
13.5
21.1
11.7
7.5
0.9
0.8
7.3
10.6
-
-
Bank of India
Neutral
117
-
9,246
15,972
17,271
1.9
2.0
15.3
33.4
7.6
3.5
0.3
0.3
3.6
7.6
-
-
Canara Bank
Neutral
241
-
13,067
15,441
16,945
2.0
2.1
46.6
70.4
5.2
3.4
0.5
0.4
8.0
11.2
-
-
Dena Bank
Neutral
41
-
2,646
3,440
3,840
2.1
2.3
7.3
10.0
5.7
4.1
0.4
0.4
6.1
7.9
-
-
Federal Bank
Neutral
57
-
9,772
3,477
3,999
3.0
3.0
5.0
6.2
11.3
9.1
1.1
1.0
10.6
11.9
-
-
HDFC
Neutral
1,234
-
194,775
10,358
11,852
3.3
3.3
41.1
47.0
30.0
26.2
5.7
5.2
24.7
24.9
-
-
HDFC Bank
Buy
1,078
1,262
272,004
38,309
47,302
4.3
4.3
49.3
61.1
21.9
17.7
3.8
3.3
18.5
19.7
-
-
ICICI Bank
Buy
265
354
154,135
34,279
39,262
3.3
3.3
21.0
24.4
12.6
10.9
2.1
1.8
14.4
14.7
-
-
IDBI Bank
Neutral
90
-
14,404
9,625
10,455
1.8
1.8
8.5
14.2
10.5
6.3
0.7
0.6
5.9
9.3
-
-
Indian Bank
Neutral
115
-
5,511
6,160
6,858
2.5
2.5
24.5
29.8
4.7
3.9
0.4
0.3
7.7
8.6
-
-
LIC Housing Finance
Accumulate
502
571
25,357
3,101
3,745
2.5
2.5
33.0
40.2
15.2
12.5
2.8
2.4
19.7
20.5
-
-
Oriental Bank
Neutral
138
-
4,144
7,643
8,373
2.4
2.4
37.2
45.4
3.7
3.0
0.3
0.3
8.2
9.4
-
-
Punjab Natl.Bank
Neutral
120
-
23,593
23,638
26,557
2.8
2.8
17.9
27.2
6.7
4.4
0.7
0.6
8.5
12.0
-
-
South Ind.Bank
Neutral
20
-
2,640
1,965
2,185
2.5
2.5
2.5
3.3
7.9
5.9
0.8
0.7
9.5
11.7
-
-
St Bk of India
Buy
229
283
177,379
82,520
93,299
2.7
2.8
20.0
24.5
11.4
9.3
1.2
1.1
11.5
12.8
-
-
Union Bank
Neutral
151
-
10,394
12,646
14,129
2.3
2.4
31.0
39.1
4.9
3.9
0.5
0.4
9.8
11.4
-
-
Vijaya Bank
Neutral
34
-
2,925
3,536
3,827
1.9
1.9
5.5
6.7
6.2
5.1
0.5
0.5
7.8
8.8
-
-
Yes Bank
Buy
732
921
30,694
7,190
9,011
3.2
3.3
58.2
69.7
12.6
10.5
2.2
1.9
19.2
19.6
-
-
FMCG
Asian Paints
Neutral
880
-
84,395
16,553
19,160
16.0
16.2
17.7
21.5
49.8
40.9
13.2
11.9
29.4
31.2
4.9
4.3
Britannia
Neutral
2,970
-
35,628
8,065
9,395
9.6
10.2
47.2
65.5
62.9
45.3
20.9
19.8
38.3
41.2
4.3
3.7
Colgate
Neutral
973
-
26,451
4,836
5,490
19.5
19.7
48.5
53.2
20.1
18.3
14.7
12.8
99.8
97.5
5.4
4.7
Dabur India
Neutral
278
-
48,878
9,370
10,265
17.1
17.2
7.3
8.1
37.9
34.3
11.4
9.3
33.7
30.6
5.1
4.7
GlaxoSmith Con*
Neutral
6,359
-
26,745
4,919
5,742
17.2
17.4
168.3
191.2
37.8
33.3
10.7
9.1
28.8
28.9
5.0
4.2
Godrej Consumer
Neutral
1,300
-
44,285
10,168
12,886
16.1
16.1
32.1
38.4
40.5
33.9
8.2
7.6
19.7
21.0
4.5
3.5
Stock Watch
December 30, 2015
Company Name
Reco
CMP
Target
Mkt Cap
Sales ( Čcr )
OPM(%)
EPS (Č)
PER(x)
P/BV(x)
RoE(%)
EV/Sales(x)
(Č)
Price ( Č)
( Č cr )
FY16E FY17E
FY16E
FY17E
FY16E
FY17E
FY16E
FY17E
FY16E
FY17E
FY16E
FY17E
FY16E
FY17E
FMCG
HUL
Neutral
858
-
185,714
34,940
38,957
17.5
17.7
20.8
24.7
41.3
34.8
45.9
36.7
110.5
114.2
5.1
4.6
ITC
Buy
325
382
261,152
41,068
45,068
37.8
37.4
13.9
15.9
23.4
20.4
7.8
6.9
34.1
33.8
6.0
5.4
Marico
Buy
224
363
28,848
6,551
7,766
15.7
16.0
10.4
12.5
21.5
17.9
6.3
5.2
33.2
32.4
4.3
3.7
Nestle*
Accumulate
5,835
6,646
56,255
11,291
12,847
22.2
22.3
158.9
184.6
36.7
31.6
19.2
17.3
55.0
57.3
4.8
4.2
Tata Global
Neutral
142
-
8,956
8,635
9,072
9.8
9.9
6.5
7.6
21.8
18.7
2.2
2.1
6.8
7.4
1.0
0.9
IT
HCL Tech^
Buy
855
1,132
120,416
42,038
47,503
23.2
23.5
55.8
62.9
15.3
13.6
3.5
2.7
23.0
19.8
2.5
2.0
Infosys
Buy
1,104
1,306
253,525
60,250
66,999
28.0
28.0
58.3
63.7
18.9
17.3
4.0
3.4
20.9
19.7
3.5
3.0
TCS
Buy
2,452
3,165
483,139
111,274
126,852
28.4
28.7
125.4
143.9
19.6
17.0
7.7
7.1
39.9
42.2
3.9
3.4
Tech Mahindra
Buy
518
646
50,114
25,566
28,890
16.0
17.0
26.3
31.9
19.7
16.3
3.5
3.0
17.9
18.6
1.7
1.5
Wipro
Buy
564
719
139,218
52,414
58,704
23.7
23.8
38.4
42.3
14.7
13.3
2.9
2.6
19.5
18.0
2.2
1.8
Media
D B Corp
Accumulate
327
356
6,003
2,241
2,495
27.8
27.9
21.8
25.6
15.0
12.8
3.9
3.5
26.7
28.5
2.6
2.3
HT Media
Neutral
92
-
2,132
2,495
2,603
11.2
11.2
7.3
8.6
12.6
10.7
1.0
0.9
7.4
8.1
0.4
0.3
Jagran Prakashan
Accumulate
157
169
5,137
2,170
2,355
27.2
26.2
8.9
9.9
17.7
15.9
3.7
3.2
20.9
20.5
2.3
2.1
Sun TV Network
Neutral
414
-
16,307
2,779
3,196
70.2
70.5
22.8
27.3
18.2
15.2
4.5
4.0
26.7
28.3
5.6
4.9
Hindustan Media
Neutral
291
-
2,137
920
1,031
20.0
20.0
19.2
20.9
15.2
14.0
2.5
2.1
16.4
15.3
1.9
1.6
Ventures
Metals & Mining
Coal India
Buy
321
380
203,008
76,167
84,130
19.9
22.3
22.4
25.8
14.3
12.4
5.2
5.0
35.5
41.0
2.0
1.8
Hind. Zinc
Buy
146
175
61,584
14,641
14,026
50.4
50.4
17.7
16.0
8.3
9.1
1.3
1.2
16.2
13.2
1.8
1.7
Hindalco
Neutral
84
-
17,418
104,356
111,186
8.7
9.5
6.7
11.1
12.6
7.6
0.5
0.4
3.5
5.9
0.7
0.6
JSW Steel
Neutral
1,036
-
25,048
42,308
45,147
16.4
20.7
(10.3)
49.5
20.9
1.2
1.1
(1.0)
5.6
1.6
1.5
NMDC
Neutral
91
-
36,119
8,237
10,893
46.6
44.5
10.0
11.7
9.2
7.8
1.0
0.9
12.5
13.0
4.2
3.2
SAIL
Neutral
48
-
19,762
45,915
53,954
7.2
10.5
1.5
4.4
31.8
10.9
0.5
0.5
2.3
4.1
1.1
1.0
Vedanta
Neutral
92
-
27,260
71,445
81,910
26.2
26.3
12.9
19.2
7.1
4.8
0.5
0.4
7.2
8.9
0.8
0.6
Tata Steel
Neutral
255
-
24,781
126,760
137,307
8.9
11.3
6.4
23.1
40.1
11.1
0.8
0.8
2.0
7.1
0.8
0.7
Oil & Gas
Cairn India
Neutral
138
-
25,845
11,323
12,490
49.4
51.0
20.7
20.7
6.7
6.7
0.4
0.4
6.4
6.1
1.4
0.7
GAIL
Neutral
366
-
46,426
64,856
70,933
9.1
9.6
24.0
28.9
15.3
12.7
1.3
1.2
8.8
9.6
0.9
0.8
ONGC
Neutral
240
-
205,332
154,564
167,321
36.8
37.4
28.6
32.5
8.4
7.4
1.1
1.0
12.7
13.5
1.5
1.4
Petronet LNG
Neutral
248
-
18,611
29,691
31,188
5.8
6.2
12.8
13.4
19.4
18.5
2.9
2.6
15.8
14.8
0.7
0.7
Indian Oil Corp
Accumulate
430
455
104,499
359,607
402,760
5.9
6.1
42.5
48.7
10.1
8.8
1.4
1.2
14.1
14.4
0.4
0.3
Reliance Industries
Neutral
1,015
-
328,829
304,775
344,392
12.6
13.4
91.3
102.6
11.1
9.9
1.3
1.1
11.8
12.0
1.0
0.8
Stock Watch
December 30, 2015
Company Name
Reco
CMP
Target
Mkt Cap
Sales ( Čcr )
OPM(%)
EPS (Č)
PER(x)
P/BV(x)
RoE(%)
EV/Sales(x)
(Č)
Price ( Č)
( Č cr )
FY16E FY17E
FY16E
FY17E
FY16E
FY17E
FY16E
FY17E
FY16E
FY17E
FY16E
FY17E
FY16E
FY17E
Pharmaceuticals
Alembic Pharma
Neutral
705
-
13,291
2,658
3,112
24.1
20.2
24.6
23.9
28.7
29.5
10.3
7.9
42.5
30.2
5.0
4.2
Aurobindo Pharma
Neutral
887
-
51,812
14,923
17,162
23.0
23.0
38.2
43.6
23.2
20.4
7.2
5.4
36.0
30.2
3.8
3.3
Aventis*
Neutral
4,390
-
10,111
2,082
2,371
17.4
20.8
118.2
151.5
37.1
29.0
5.4
4.4
19.9
25.5
4.5
3.8
Cadila Healthcare
Neutral
387
-
39,624
10,224
11,840
21.0
22.0
14.6
17.6
26.5
22.0
7.3
5.7
30.8
29.0
3.9
3.3
Cipla
Neutral
653
-
52,459
14,211
16,611
20.6
19.0
27.0
28.9
24.2
22.6
4.1
3.5
18.4
16.8
3.7
3.1
Dr Reddy's
Buy
3,102
3,933
52,905
16,838
19,575
25.0
23.1
167.5
178.8
18.5
17.4
3.9
3.3
23.1
20.4
3.1
2.6
Dishman Pharma
Neutral
319
-
2,573
1,733
1,906
21.5
21.5
17.0
19.9
18.8
16.0
1.9
1.7
10.5
11.2
2.0
1.7
GSK Pharma*
Neutral
3,295
-
27,908
2,870
3,158
20.0
22.1
59.5
68.3
55.4
48.2
16.3
16.8
28.5
34.3
9.2
8.4
Indoco Remedies
Neutral
331
-
3,051
1,033
1,199
15.9
18.2
9.4
13.6
35.2
24.3
5.2
4.4
15.7
19.7
3.0
2.6
Ipca labs
Buy
747
900
9,431
3,363
3,909
12.9
18.6
13.4
28.0
55.8
26.7
4.0
3.5
7.4
14.0
3.1
2.7
Lupin
Neutral
1,844
-
83,069
13,092
16,561
25.0
27.0
50.4
68.3
36.6
27.0
7.6
6.0
22.8
24.7
6.1
4.7
Sun Pharma
Buy
811
950
195,140
28,163
32,610
25.8
30.7
17.4
26.9
46.6
30.1
4.4
3.8
13.0
16.6
6.4
5.3
Power
Tata Power
Neutral
67
-
18,148
35,923
37,402
22.6
22.8
4.1
5.2
16.6
13.0
1.3
1.2
7.5
9.3
1.5
1.3
NTPC
Accumulate
145
157
119,147
87,064
98,846
23.5
23.5
11.7
13.2
12.4
11.0
1.4
1.3
11.4
12.1
2.4
2.1
Power Grid
Buy
141
170
73,661
20,702
23,361
86.7
86.4
12.1
13.2
11.7
10.7
1.7
1.5
15.6
15.1
8.5
7.9
Telecom
Bharti Airtel
Neutral
334
-
133,693
101,748
109,191
32.1
31.7
12.0
12.5
27.9
26.8
1.9
1.8
6.9
6.7
2.0
1.8
Idea Cellular
Neutral
140
-
50,562
34,282
36,941
32.0
31.5
5.9
6.2
23.8
22.7
2.2
2.0
9.9
9.3
2.1
1.9
zOthers
Abbott India
Neutral
5,700
-
12,112
2,715
3,153
14.5
14.1
134.3
152.2
42.5
37.4
10.6
8.7
27.4
25.6
4.2
3.5
Bajaj Electricals
Buy
211
290
2,132
4,719
5,287
5.2
5.8
8.6
12.7
24.7
16.7
2.8
2.5
11.4
14.8
0.5
0.4
Finolex Cables
Neutral
251
-
3,832
2,520
2,883
12.2
12.0
12.7
14.2
19.8
17.7
2.7
2.4
13.6
13.5
1.3
1.1
Goodyear India*
Accumulate
561
622
1,294
1,888
1,680
12.1
11.9
62.2
56.6
9.0
9.9
2.1
1.8
25.9
19.7
0.5
0.5
Hitachi
Neutral
1,332
-
3,622
1,779
2,081
7.8
8.8
21.8
33.4
61.1
39.9
9.9
8.0
17.4
22.1
2.1
1.8
Jyothy Laboratories
Neutral
298
-
5,397
1,620
1,847
11.5
11.5
7.3
8.5
40.9
35.2
5.3
4.9
13.3
14.4
3.2
2.7
MRF
Accumulate
39,765
45,575
16,865
20,316
14,488
21.4
21.1
5,488.0
3,798.0
7.3
10.5
2.5
2.0
41.1
21.2
0.8
1.0
Page Industries
Neutral
13,073
-
14,582
1,929
2,450
19.8
20.1
229.9
299.0
56.9
43.7
25.1
17.4
52.1
47.1
7.6
6.0
Relaxo Footwears
Neutral
509
-
6,111
1,767
2,152
12.3
12.5
19.3
25.1
26.5
20.3
6.5
5.0
27.7
27.8
3.5
2.9
Siyaram Silk Mills
Accumulate
1,185
1,354
1,111
1,636
1,815
11.5
11.5
89.9
104.1
13.2
11.4
2.2
1.9
17.9
17.8
0.8
0.7
Styrolution ABS India*
Neutral
756
-
1,329
1,271
1,440
8.6
9.2
32.0
41.1
23.6
18.4
2.4
2.2
10.7
12.4
1.0
0.9
TVS Srichakra
Buy
2,804
3,240
2,147
2,101
2,338
15.7
15.0
248.6
270.0
11.3
10.4
4.9
3.5
43.6
34.0
1.1
0.9
Stock Watch
December 30, 2015
Company Name
Reco
CMP
Target
Mkt Cap
Sales ( Čcr )
OPM(%)
EPS (Č)
PER(x)
P/BV(x)
RoE(%)
EV/Sales(x)
(Č)
Price ( Č)
( Č cr )
FY16E
FY17E
FY16E
FY17E
FY16E
FY17E
FY16E
FY17E
FY16E
FY17E
FY16E
FY17E
FY16E
FY17E
zOthers
HSIL
Neutral
296
-
2,139
2,123
2,384
16.1
16.5
15.0
18.9
19.7
15.7
1.5
1.4
8.0
9.4
1.4
1.2
Kirloskar Engines India
Neutral
241
-
3,482
2,471
2,826
8.8
10.4
9.1
13.3
26.4
18.1
2.5
2.3
9.7
13.4
1.1
0.9
Ltd
M M Forgings
Buy
513
614
619
511
615
21.7
21.6
43.1
55.8
11.9
9.2
2.2
1.8
19.9
21.2
1.4
1.1
Banco Products (India) Neutral
144
-
1,028
1,208
1,353
11.0
12.3
10.8
14.5
13.3
9.9
1.5
1.4
11.9
14.5
0.8
0.7
Competent Automobiles Neutral
149
-
91
1,040
1,137
3.2
3.1
25.7
28.0
5.8
5.3
0.9
0.8
15.0
14.3
0.1
0.1
Nilkamal
Neutral
1,275
-
1,903
1,910
2,083
10.5
10.3
63.3
69.2
20.1
18.4
3.3
2.8
17.6
16.5
1.1
0.9
Visaka Industries
Buy
123
144
196
1,086
1,197
9.9
10.3
21.5
28.8
5.7
4.3
0.6
0.5
9.6
11.6
0.4
0.3
Transport Corporation of
Neutral
300
-
2,281
2,830
3,350
8.8
9.0
14.4
18.3
20.9
16.4
3.2
2.8
15.4
17.1
0.9
0.8
India
Elecon Engineering
Neutral
85
-
929
1,369
1,533
13.7
14.9
3.3
6.1
25.7
14.1
1.7
1.6
6.6
11.4
1.0
0.9
Surya Roshni
Buy
144
183
629
2,992
3,223
8.1
8.4
14.7
18.3
9.8
7.8
0.9
0.8
9.7
11.0
0.5
0.5
MT Educare
Neutral
187
-
744
286
366
18.3
17.7
7.7
9.4
24.2
19.9
5.1
4.5
20.2
21.1
2.5
1.9
Radico Khaitan
Buy
112
156
1,485
1,565
1,687
12.2
13.0
5.7
7.1
19.6
15.7
1.7
1.5
8.3
9.6
1.4
1.3
Garware Wall Ropes
Accumulate
434
473
949
861
967
10.9
10.9
24.0
28.2
18.1
15.4
2.6
2.3
14.6
14.9
1.1
1.0
Wonderla Holidays
Neutral
403
-
2,275
206
308
44.0
43.6
9.0
12.9
44.7
31.2
6.1
5.5
13.7
17.8
10.9
7.3
Linc Pen & Plastics
Neutral
219
-
323
340
371
8.3
8.9
10.8
13.2
20.3
16.6
3.2
2.8
16.0
17.1
1.0
0.9
The Byke Hospitality
Neutral
151
-
604
222
287
20.5
20.5
5.6
7.6
26.7
20.0
5.0
4.1
18.9
20.8
2.8
2.1
Interglobe Aviation
Neutral
1,186
-
42,755
17,022
21,122
20.7
14.5
63.9
53.7
18.6
22.1
27.8
22.8
149.9
103.2
2.5
2.0
Coffee Day Enterprises
Neutral
285
-
5,870
2,692
2,964
17.0
18.6
-
4.7
-
60.1
3.5
3.3
0.2
5.5
2.6
2.4
Ltd
Navneet Education
Neutral
99
-
2,367
998
1,062
24.1
24.0
5.8
6.1
17.3
16.3
3.8
3.4
22.0
20.6
2.5
2.3
Source: Company, Angel Research; Note: *December year end; #September year end; &October year end; Price as on December 29, 2015
Market Outlook
December 30, 2015
Research Team Tel: 022 - 39357800
DISCLAIMER
Angel Broking Private Limited (hereinafter referred to as “Angel”) is a registered Member of National Stock Exchange of India Limited,
Bombay Stock Exchange Limited and Metropolitian Stock Exchange of India Limited. It is also registered as a Depository Participant with
CDSL and Portfolio Manager with SEBI. It also has registration with AMFI as a Mutual Fund Distributor. Angel Broking Private Limited is a
registered entity with SEBI for Research Analyst in terms of SEBI (Research Analyst) Regulations, 2014 vide registration number
INH000000164. Angel or its associates has not been debarred/ suspended by SEBI or any other regulatory authority for accessing
/dealing in securities Market. Angel or its associates including its relatives/analyst do not hold any financial interest/beneficial ownership
of more than 1% in the company covered by Analyst. Angel or its associates/analyst has not received any compensation / managed or co
-managed public offering of securities of the company covered by Analyst during the past twelve months. Angel/analyst has not served as
an officer, director or employee of company covered by Analyst and has not been engaged in market making activity of the company
covered by Analyst.
This document is solely for the personal information of the recipient, and must not be singularly used as the basis of any investment
decision. Nothing in this document should be construed as investment or financial advice. Each recipient of this document should make
such investigations as they deem necessary to arrive at an independent evaluation of an investment in the securities of the companies
referred to in this document (including the merits and risks involved), and should consult their own advisors to determine the merits and
risks of such an investment.
Reports based on technical and derivative analysis center on studying charts of a stock's price movement, outstanding positions and
trading volume, as opposed to focusing on a company's fundamentals and, as such, may not match with a report on a company's
fundamentals.
The information in this document has been printed on the basis of publicly available information, internal data and other reliable sources
believed to be true, but we do not represent that it is accurate or complete and it should not be relied on as such, as this document is for
general guidance only. Angel Broking Pvt. Limited or any of its affiliates/ group companies shall not be in any way responsible for any
loss or damage that may arise to any person from any inadvertent error in the information contained in this report. Angel Broking Pvt.
Limited has not independently verified all the information contained within this document. Accordingly, we cannot testify, nor make any
representation or warranty, express or implied, to the accuracy, contents or data contained within this document. While Angel Broking
Pvt. Limited endeavors to update on a reasonable basis the information discussed in this material, there may be regulatory, compliance,
or other reasons that prevent us from doing so.
This document is being supplied to you solely for your information, and its contents, information or data may not be reproduced,
redistributed or passed on, directly or indirectly.
Neither Angel Broking Pvt. Limited, nor its directors, employees or affiliates shall be liable for any loss or damage that may arise from or
in connection with the use of this information.
Note: Please refer to the important ‘Stock Holding Disclosure' report on the Angel website (Research Section). Also, please refer to the
latest update on respective stocks for the disclosure status in respect of those stocks. Angel Broking Pvt. Limited and its affiliates may have
investment positions in the stocks recommended in this report.