Market Outlook
November 30, 2015
Market Cues
Domestic Indices
Chg (%)
(Pts)
(Close)
Indian markets are expected to open on a Negative note tracking the SGX Nifty and
BSE Sensex
0.7
170
26,128
most Asian markets.
Nifty
0.8
59
7,943
U.S. markets ended little changed in light trading on Friday, with consumer stocks
Mid Cap
0.5
50
10,985
falling as investors fretted over early reports on the U.S. holiday shopping season
Small Cap
0.3
37
11,546
and Disney's subscriber losses weighed on the market.
Bankex
1.9
363
19,858
The majority of the European markets ended Friday's session with modest losses. The
sharp sell-off in China dampened the mood among investors.
Global Indices
Chg (%)
(Pts)
(Close)
The Indian markets rose for a second consecutive session Friday on renewed hopes
Dow Jones
(0.1)
(15)
17,798
that the government will be able to build consensus to pass the Goods and Services
Nasdaq
0.2
11
5,128
Tax (GST) bill in the ongoing winter session of Parliament.
FTSE
(0.3)
(18)
6,375
News & Result Analysis
Nikkei
(0.3)
(60)
19,884
PVR to add 23 screens, take total to 500 this fiscal
Hang Seng
(421)
(1.9)
22,068
SpiceJet plans more flights from Dubai
Shanghai Com
(5.5)
(199)
3,436
Detailed analysis on Pg2
Investor’s Ready Reckoner
Advances / Declines
BSE
NSE
Key Domestic & Global Indicators
Advances
1,383
787
Stock Watch: Latest investment recommendations on 150+ stocks
Declines
1,275
721
Refer P3 onwards
Unchanged
210
69
Top Picks
CMP
Target
Upside
Volumes (` Cr)
Company
Sector
Rating
(`)
(`)
(%)
BSE
2,719
Axis Bank
Financials
Buy
471
630
33.7
NSE
16,236
HCL Tech
IT
Buy
870
1,132
30.2
ICICI Bank
Financials
Buy
270
357
32.3
Net Inflows (` Cr)
Net
Mtd
Ytd
Ashok Leyland
Automobiles
Buy
98
111
13.8
Larsen & Toubro
Construction
Buy
1,364
1,646
20.7
FII
(519)
(7,986)
(19,813)
More Top Picks on Pg3
MFs
900
7,898
55,444
Key Upcoming Events
Previous
Consensus
Top Gainers
Price (`)
Chg (%)
Date
Region
Event Description
Reading
Expectations
Welcorp
107
9.5
Nov 30
US
Pending Home Sales (MoM)
-2.3%
1.0%
Sadbhav
346
7.9
Dec 1
China
Manufacturing PMI (Nov)
49.8
-
Sksmicro
456
7.6
Dec 1
Germany
Manufacturing PMI (Nov)
52.6
-
Orientbank
155
6.7
Dec 1
India
RBI Repo Rate
6.75%
-
Iifl
206
6.5
Top Losers
Price (`)
Chg (%)
Pmcfin
1
(7.8)
Videoind
131
(3.6)
Gmdcltd
86
(3.5)
Gvkpil
9
(3.4)
J&kbank
87
(3.2)
As on November 27, 2015
Market Outlook
November 30, 2015
PVR to add 23 screens, take total to 500 this fiscal
Multiplex chain operator PVR expects to add at least 23 screens in the current
financial year to take the total to
500 in the same fiscal. According to
management, the company’s target is to reach 1,000 screens quickly. The shorter
target is to get to 500 screens in this financial year and then look at going to
1,000 screens.
PVR currently operates 477 screens across 44 cities in the country. It has four
brands across different price points - PVR Talkies, PVR Cinemas, PVR Premium and
newly launched PVR Icon. The company has a capex of `200cr this fiscal, which
includes `135-140cr for new projects and the remaining for renovation and the
cost of each new screen is around `2-2.5cr.
The company would be spending `60-70 lakh on marketing for the new brand
PVR Icon. PVR enjoys an occupancy rate of 35-37%, with a reported footfall of 66
million. Online sales contribute around 35-36% of the total ticket earnings. Food
and beverages contribute 25% of the revenues, while advertising accounts for 12%
of the income.
SpiceJet plans more flights from Dubai
SpiceJet announced that it would operate more number of flights from here to
various Indian cities. Celebrating UAE's 44th National Day, the low cost carrier
SpiceJet has announced special one-way ticket offers for its flights from Dubai,
starting from base fare of AED 244 (over `4,400).The airline would enhance its
connectivity from Dubai to a host of Indian cities by increasing frequencies on
multiple routes.
The special fare would be for travel from Dubai to Mumbai, Kochi and Kozhikode.
While, base fares starting from AED 344 (over `6,250) would be for travel from
Dubai to Delhi, Ahmedabad, Amritsar, Madurai and Pune. Statutory taxes would
be as applicable. SpiceJet operates 291 daily flights to 40 destinations, including
34 domestic and 6 overseas.
Economic and Political News
Global events to weigh on RBI credit policy review: ASSOCHAM
FinMin to meet banks on Dec 1 to make gold scheme attractive
Indian banks' loans rise 9.7% y-o-y in two weeks to Nov 13: RBI
Corporate News
SpiceJet to choose between Airbus and Boeing for plane order
Emami to hike paperboard investment to `2,000cr in 3 yrs
Mahindra to open 200 car-servicing workshops in tier II cities
Market Outlook
November 30, 2015
Top Picks ★★★★★
Large Cap
Market Cap
CMP
Target
Upside
Company
Rationale
(` Cr)
(`)
(`)
(%)
To outpace battery industry growth due to better technological
Amara Raja Batteries
14,946
875
1,040
18.9
products leading to market share gains in both the automotive
OEM and replacement segments.
Earnings to grow strongly given the MHCV cyclical upturn.
Ashok Leyland
27,747
98
111
13.8
Focus on exports and LCV's provides additional growth
avenue.
Healthy pace of branch expansion, backed by distribution
Axis Bank
1,11,973
471
630
33.7
network, will be the driving force for the bank’s retail business
and overall earnings.
The stock is trading at attractive valuations and is factoring all
HCL Tech
1,22,298
870
1,132
30.2
the bad news.
Strong visibility for a robust 20% earnings trajectory, coupled
HDFC Bank
2,71,625
1,079
1,262
17.0
with high quality of earnings on account of high quality retail
business and strategic focus on highly rated corporates.
Due to its robust franchise and capital adequacy position, the
bank is well positioned to grow by at least a few percentage
ICICI Bank
1,56,575
270
357
32.3
points higher than the average industry growth rate from a
structural point of view.
Back on the growth trend, expect a long term growth of 14%
Infosys
2,44,923
1,066
1,306
22.5
to be a US$20bn in FY2020.
Well positioned to benefit from such expected gradual
recovery in the overall domestic capex cycle, given its presence
Larsen & Toubro
1,26,924
1,364
1,646
20.7
across various infrastructure segments, its execution
capabilities, and its strong balance sheet.
LICHF continues to grow its retail loan book at a healthy pace
with improvement in asset quality. We expect the company to
LIC Housing Finance
24,315
482
571
18.5
post a healthy loan book which is likely to reflect in a strong
earnings growth.
Source: Company, Angel Research
Mid Cap
Market Cap
CMP
Target
Upside
Company
Rationale
(` Cr)
(`)
(`)
(%)
Government thrust on Renewable sector and strong order
Inox Wind
8,009
361
505
39.9
book would drive future growth.
Change in business focus towards high-margin chronic and
Ipca labs
9,667
766
900
17.5
lifestyle segments and increasing penetration in Europe and
US
Economic recovery to have favourable impact on advertising &
circulation revenue growth. Further, the acquisition of a radio
Jagran Prakashan
4,771
146
169
15.8
business (Radio City) would also boost the company's revenue
growth.
Strong brand & quality teaching with innovative technologies
MT Educare
581
146
169
15.9
& higher government educational spending to boost growth
Earnings boost on back of stable material prices and
Radico Khaitan
1,525
115
156
36.1
favourable pricing environment. Valuation discount to peers
provides additional comfort
Strong brands and distribution network would boost growth
Siyaram Silk Mills
868
926
1,145
23.7
going ahead. Stock currently trades at an inexpensive
valuation.
Structural shift in the Lighting industry towards LED lighting will
Surya Roshni
602
137
183
33.2
drive growth.
Source: Company, Angel Research
Market Outlook
November 30, 2015
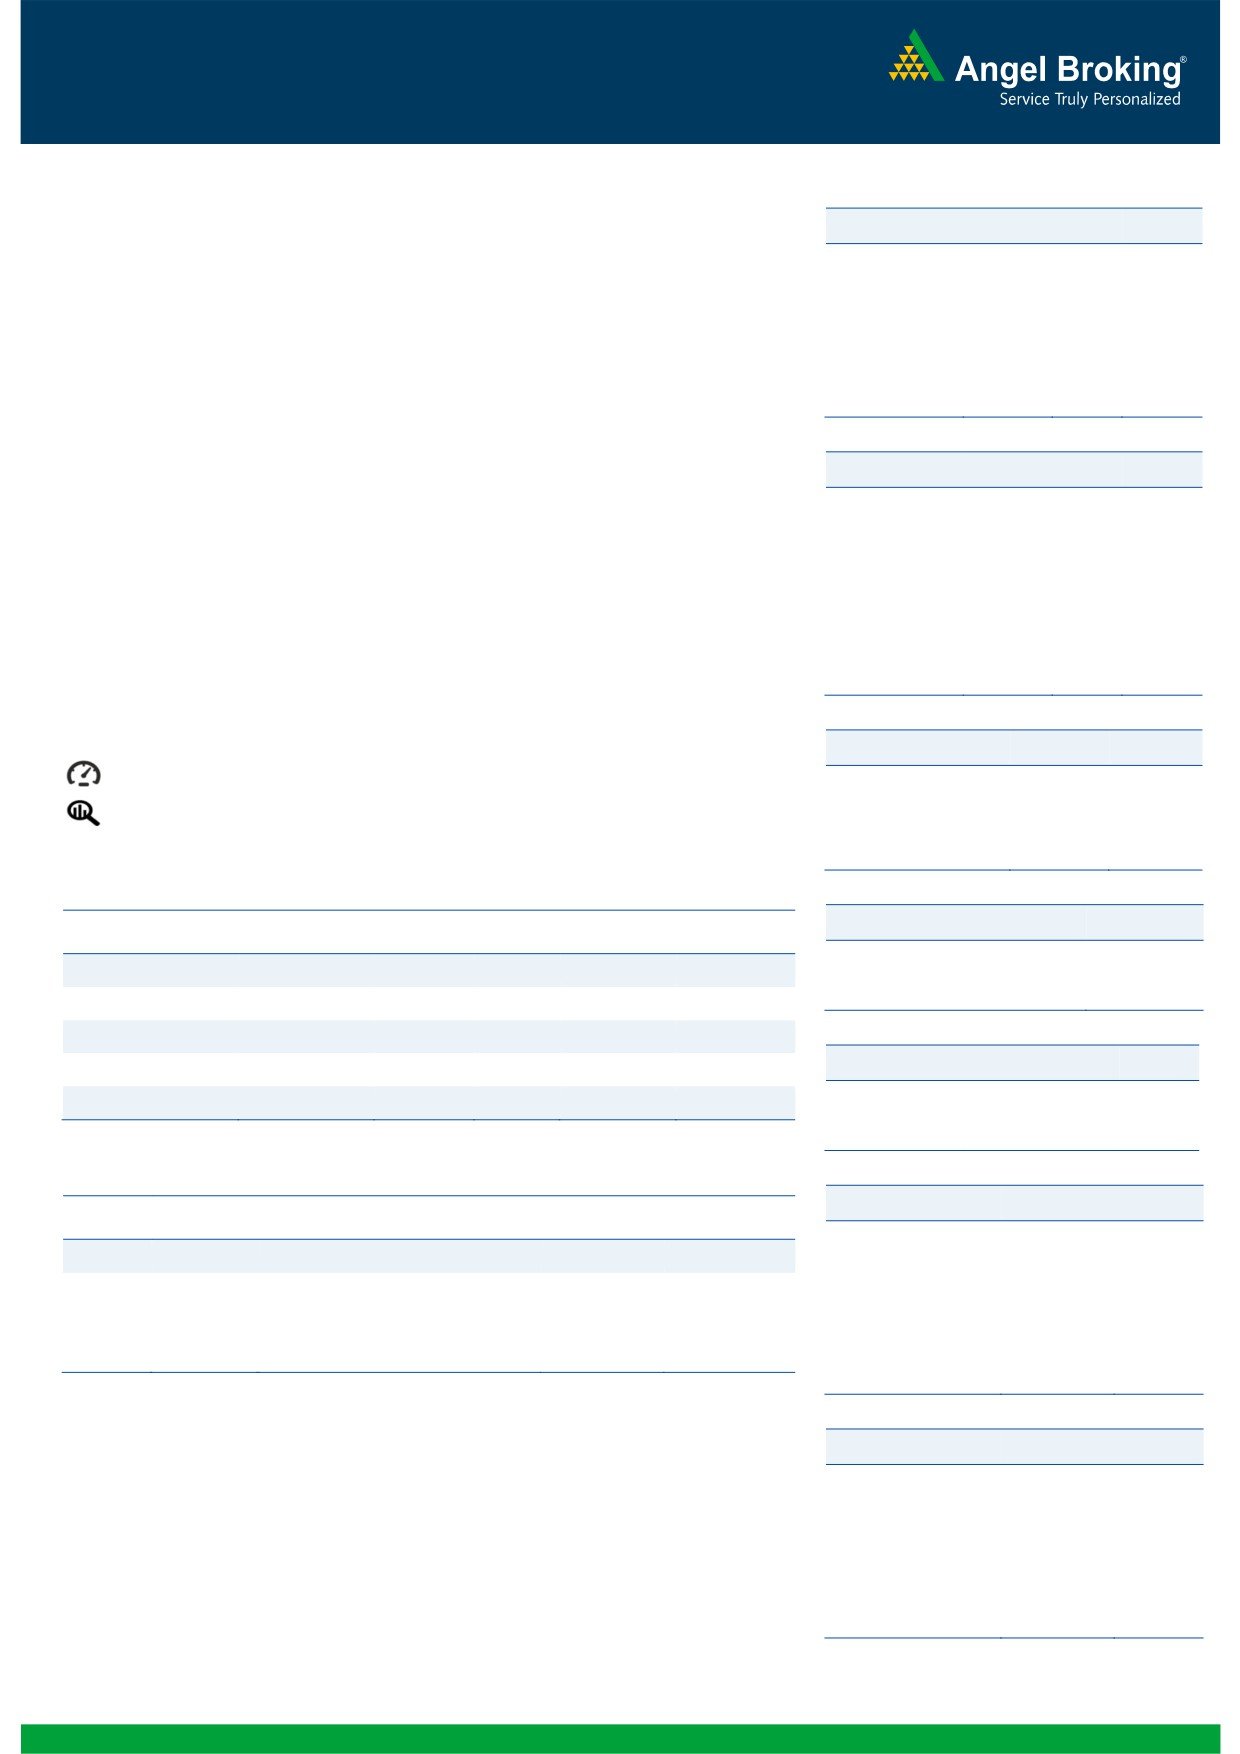
Macro watch
Exhibit 1: Quarterly GDP trends
Exhibit 2: IIP trends
(%)
(%)
9.0
8.4
7.0
6.3
8.0
7.5
7.5
6.0
5.2
7.0
7.0
4.8
6.7
6.7
5.0
7.0
6.4
6.6
4.2
4.1
6.3
3.6
3.6
4.0
6.0
2.8
3.0
2.5
2.5
5.0
3.0
4.7
5.0
2.0
4.0
1.0
3.0
-
Source: CSO, Angel Research
Source: MOSPI, Angel Research
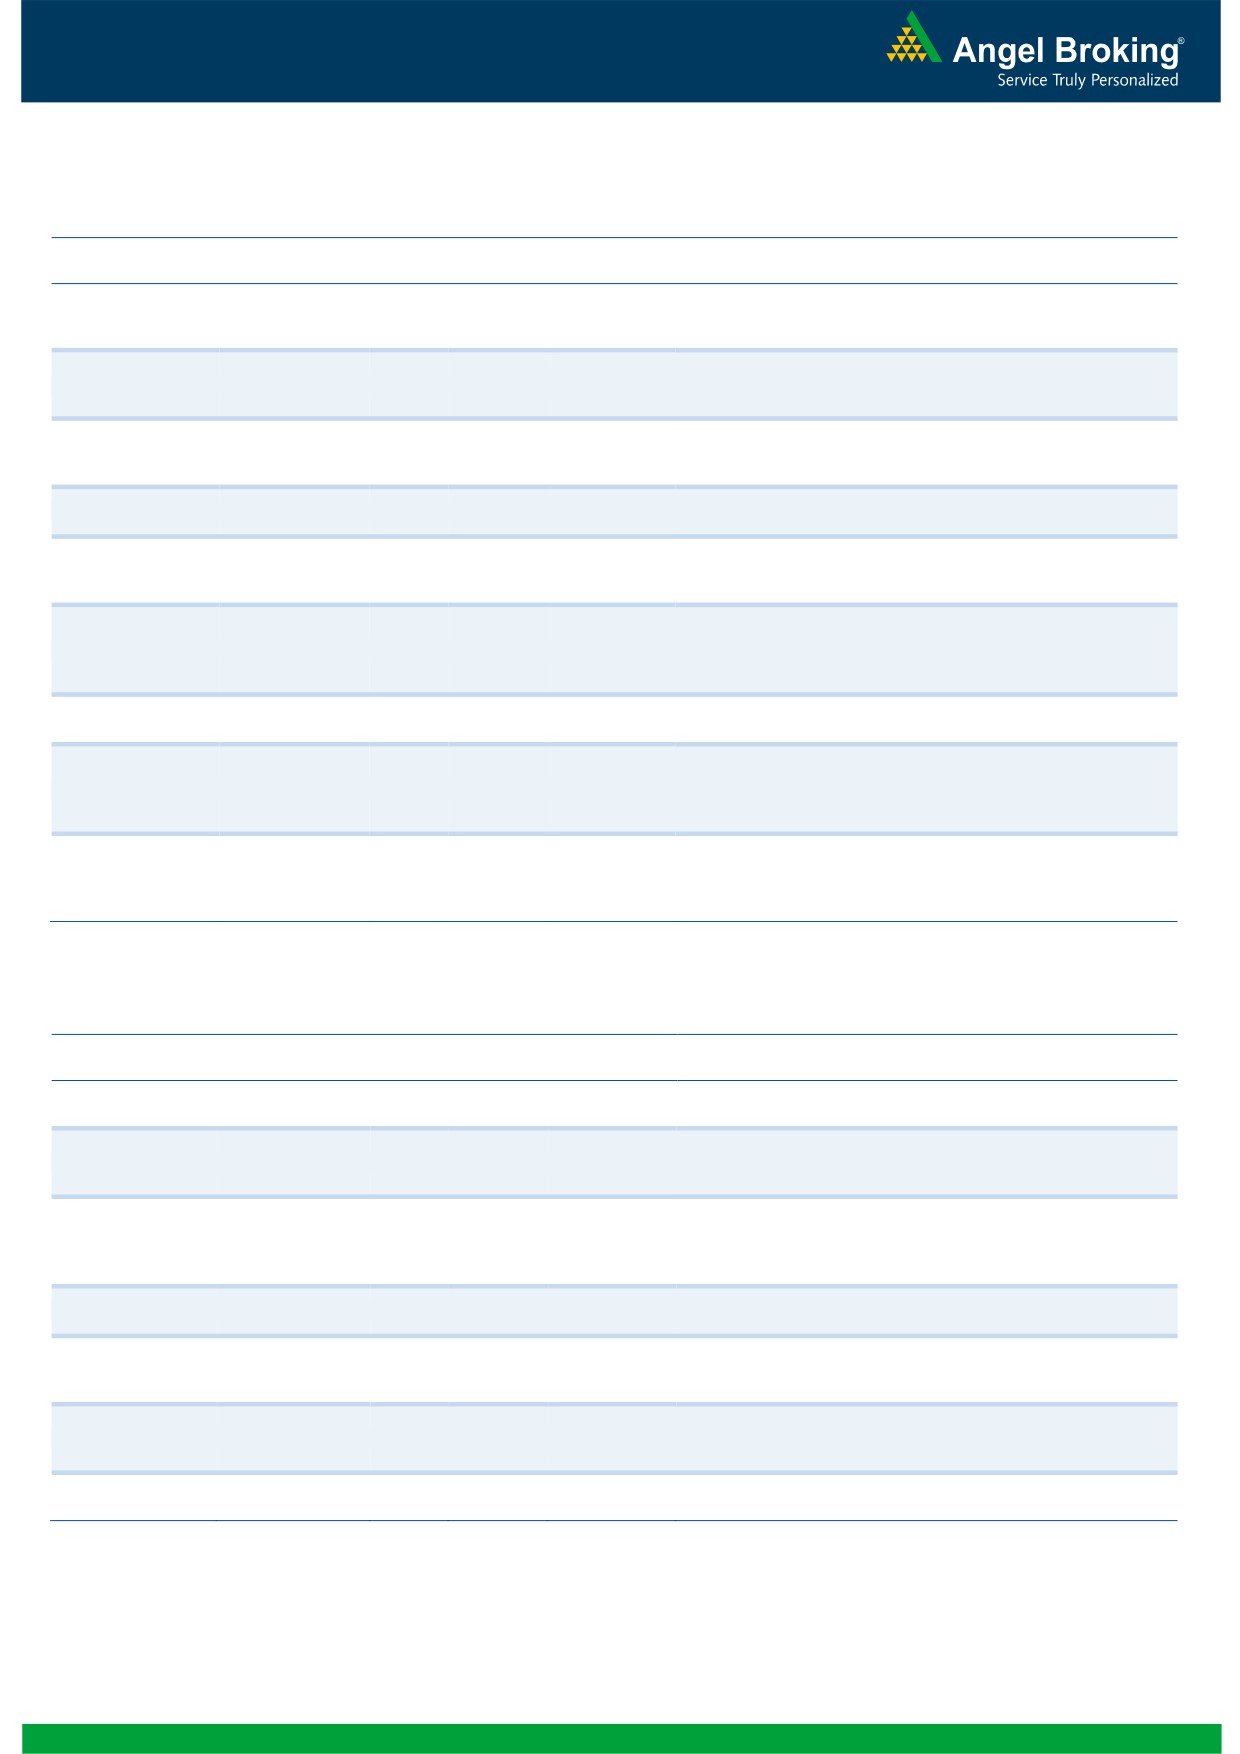
Exhibit 3: Monthly CPI inflation trends
Exhibit 4: Manufacturing and services PMI
(%)
56.0
Mfg. PMI
Services PMI
6.0
5.4
5.3
5.4
5.2
5.0
5.0
54.0
4.9
5.0
4.3
4.4
3.7
3.7
52.0
4.0
3.3
50.0
3.0
2.0
48.0
1.0
46.0
-
44.0
Source: MOSPI, Angel Research
Source: Market, Angel Research; Note: Level above 50 indicates expansion
Exhibit 5: Exports and imports growth trends
Exhibit 6: Key policy rates
(%)
Exports yoy growth
Imports yoy growth
(%)
Repo rate
Reverse Repo rate
CRR
30.0
9.00
20.0
8.00
10.0
7.00
0.0
6.00
(10.0)
5.00
(20.0)
4.00
(30.0)
3.00
Source: Bloomberg, Angel Research
Source: RBI, Angel Research
Market Outlook
November 30, 2015
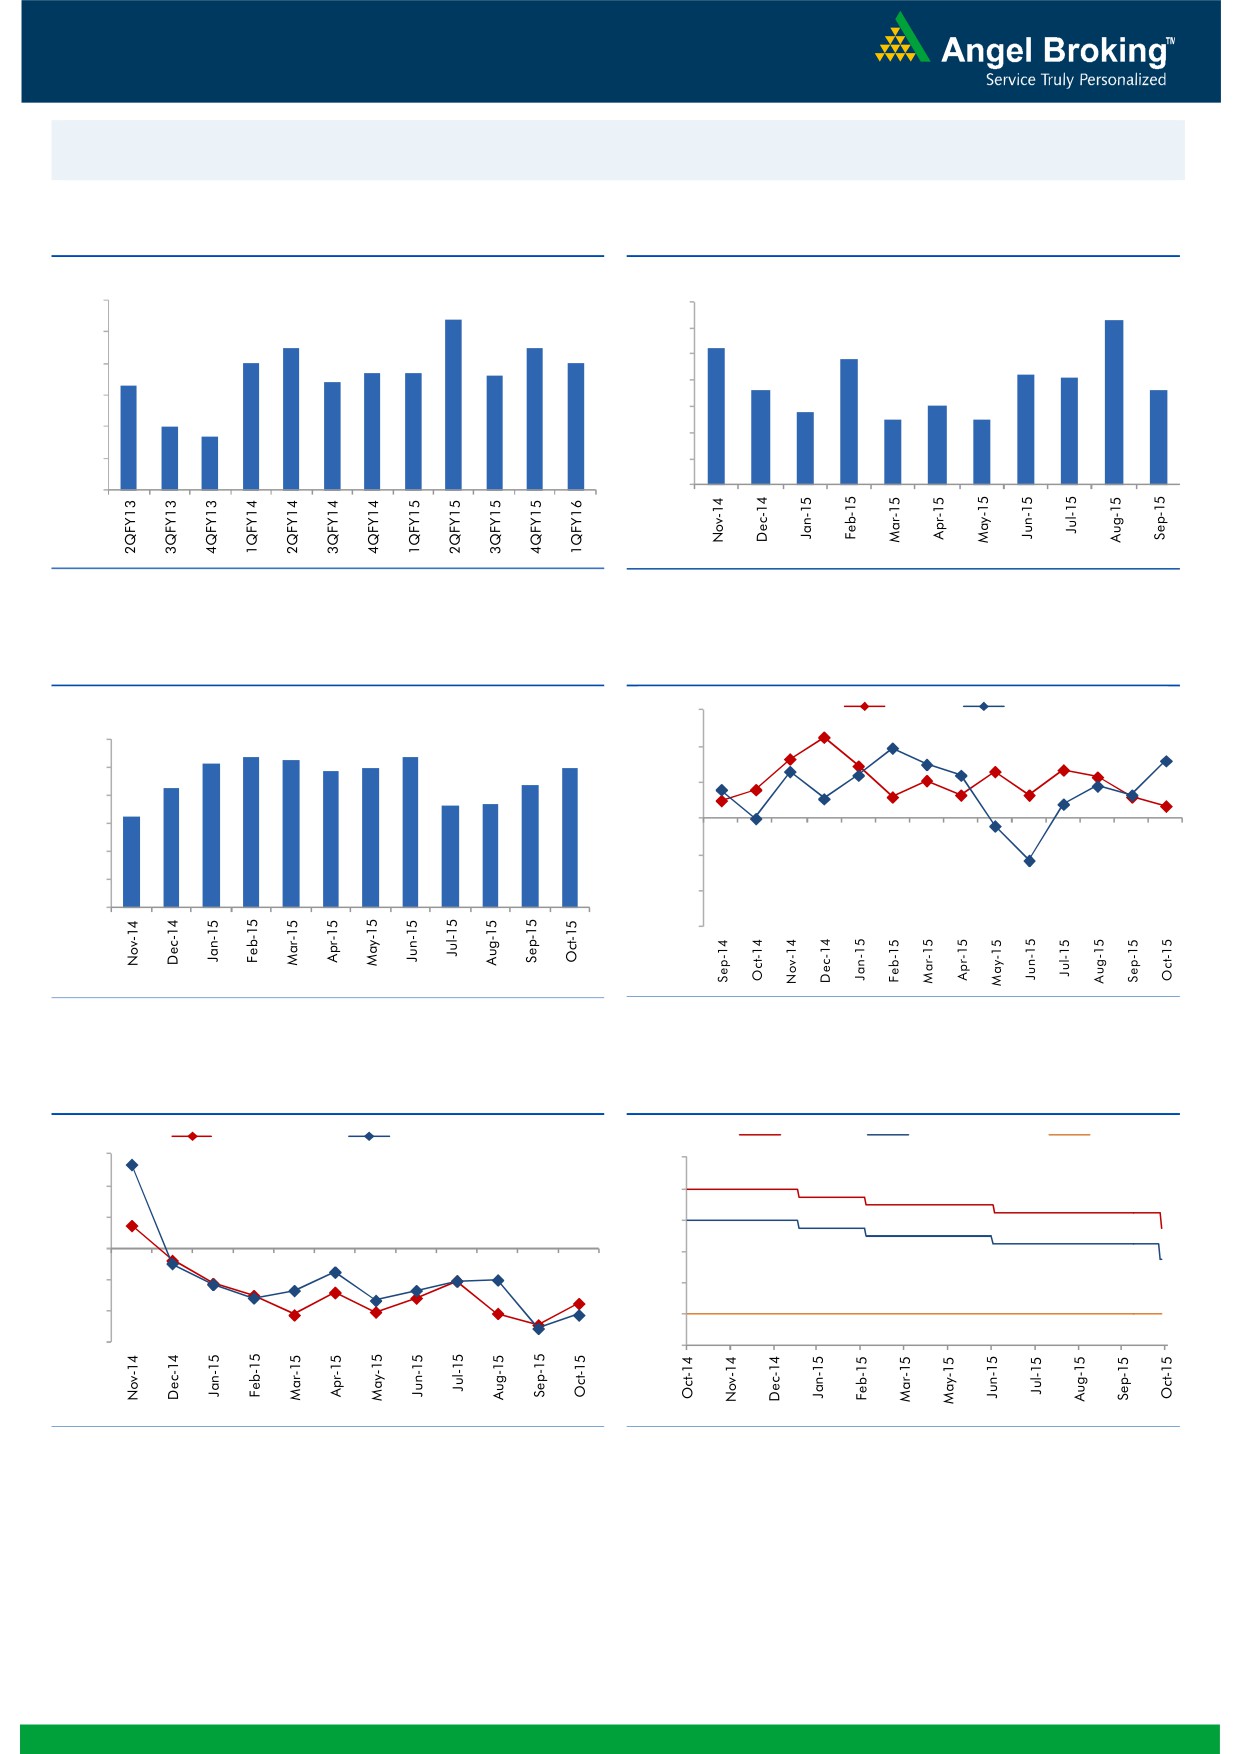
Global watch
Exhibit 1: Latest quarterly GDP Growth (%, yoy) across select developing and developed countries
(%)
8.0
6.9
6.0
5.3
4.9
4.7
4.0
2.8
2.3
2.0
1.6
2.0
1.2
1.1
0.8
(2.6)
-
(2.0)
(4.0)
(4.6)
(6.0)
Source: Bloomberg, Angel Research
Exhibit 2: 2015 GDP Growth projection by IMF (%, yoy) across select developing and developed countries
(%)
10.0
7.5
8.0
6.8
5.2
6.0
4.8
3.7
3.1
4.0
2.7
2.0
1.6
1.2
1.0
2.0
-
(2.0)
(4.0)
(1.0)
(3.8)
(6.0)
Source: IMF, Angel Research
Exhibit 3: One year forward P-E ratio across select developing and developed countries
(x)
20.0
18.0
16.0
14.0
12.0
10.0
8.0
6.0
4.0
2.0
-
Source: IMF, Angel Research
Market Outlook
November 30, 2015
Exhibit 4: Relative performance of indices across globe
Country
Name of index
Closing price
1M
1YR
Brazil
Bovespa
45,873
0.0
(16.2)
Russia
Micex
1,796
4.9
17.1
India
Nifty
7,973
(1.5)
(7.5)
China
Shanghai Composite
3,436
1.6
28.0
South Africa
Top 40
46,328
(4.2)
4.8
Mexico
Mexbol
44,248
(0.7)
0.1
Indonesia
LQ45
787
3.4
(11.2)
Malaysia
KLCI
1,671
0.3
(8.2)
Thailand
SET 50
873
(3.0)
(18.4)
USA
Dow Jones
17,798
0.8
(0.2)
UK
FTSE
6,375
0.2
(5.2)
Japan
Nikkei
19,884
4.0
15.8
Germany
DAX
11,294
4.1
13.2
France
CAC
4,930
0.7
12.3
Source: Bloomberg, Angel Research
Stock Watch
November 30, 2015
Company Name
Reco
CMP
Target
Mkt Cap
Sales ( Čcr )
OPM(%)
EPS (Č)
PER(x)
P/BV(x)
RoE(%)
EV/Sales(x)
(Č)
Price ( Č)
( Č cr )
FY16E FY17E
FY16E
FY17E
FY16E
FY17E
FY16E
FY17E
FY16E
FY17E
FY16E
FY17E
FY16E
FY17E
Agri / Agri Chemical
Rallis
Neutral
185
-
3,604
2,075
2,394
14.4
14.4
9.5
11.0
19.5
16.9
3.9
3.4
21.1
21.3
1.8
1.5
United Phosphorus
Buy
421
510
18,057
13,698
15,752
17.6
17.6
32.1
38.5
13.1
10.9
2.6
2.1
21.4
21.3
1.4
1.2
Auto & Auto Ancillary
Ashok Leyland
Accumulate
98
111
27,747
18,763
22,357
11.1
11.2
3.6
4.8
27.1
20.3
5.0
4.6
18.7
22.6
1.4
1.2
Bajaj Auto
Accumulate
2,449
2,672
70,862
24,115
27,600
21.3
21.0
136.8
157.2
17.9
15.6
5.8
4.9
32.2
31.5
2.5
2.2
Bharat Forge
Buy
854
1,016
19,870
8,013
9,250
20.0
20.3
35.2
43.1
24.3
19.8
4.8
3.9
21.6
21.8
2.6
2.2
Eicher Motors
Accumulate
16,568
19,036
44,969
15,379
16,498
15.6
16.6
473.2
574.8
35.0
28.8
13.0
9.6
36.7
33.2
2.8
2.6
Hero Motocorp
Neutral
2,704
-
53,999
28,561
31,559
14.7
14.7
151.1
163.2
17.9
16.6
6.9
5.9
38.7
35.6
1.7
1.5
Jamna Auto Industries Accumulate
232
258
4,635
1,292
1,486
9.3
9.8
12.0
15.0
19.3
15.5
4.0
3.4
20.7
21.8
3.7
3.2
L G Balakrishnan & Bros Neutral
495
-
776
1,254
1,394
11.6
11.8
35.9
41.7
13.8
11.9
1.9
1.6
13.5
13.8
0.7
0.7
Mahindra and Mahindra Neutral
1,348
-
83,736
38,513
43,579
13.6
13.7
56.1
65.1
24.0
20.7
3.8
3.4
15.7
16.2
1.8
1.5
Maruti
Accumulate
4,580
4,960
138,356
57,865
68,104
16.4
16.7
176.3
225.5
26.0
20.3
5.0
4.3
19.4
21.2
2.2
1.8
Minda Industries
Neutral
880
-
1,397
2,567
2,965
8.0
8.3
46.1
57.8
19.1
15.2
3.2
2.6
16.7
17.3
0.6
0.5
Motherson Sumi
Accumulate
292
313
38,630
39,343
45,100
8.8
9.1
10.1
12.5
28.9
23.4
9.2
7.2
35.3
34.4
1.1
0.9
Rane Brake Lining
Accumulate
345
366
273
454
511
11.1
11.4
23.8
28.1
14.5
12.3
2.1
1.9
14.2
15.3
0.7
0.7
Setco Automotive
Neutral
219
-
585
594
741
12.7
13.7
8.4
15.8
26.1
13.9
2.7
2.3
10.4
16.9
1.4
1.2
Tata Motors
Neutral
418
-
120,555
255,254
301,772
12.9
13.4
23.7
37.3
17.6
11.2
2.1
1.8
7.4
12.1
0.7
0.6
TVS Motor
Neutral
305
-
14,512
11,845
14,040
7.2
9.0
10.4
17.4
29.4
17.6
7.3
5.6
25.1
32.0
1.2
1.0
Amara Raja Batteries
Buy
875
1,040
14,946
4,892
5,871
17.4
17.6
28.8
37.1
30.4
23.6
7.1
5.7
23.4
24.1
3.0
2.5
Exide Industries
Accumulate
148
162
12,614
6,950
7,784
14.4
14.8
6.6
7.3
22.5
20.3
2.8
2.6
12.6
12.8
1.5
1.4
Apollo Tyres
Neutral
163
-
8,295
12,146
12,689
16.8
16.0
21.2
19.0
7.7
8.6
1.3
1.1
16.5
13.0
0.8
0.8
Ceat
Accumulate
1,017
1,119
4,114
6,041
6,597
14.1
13.7
99.5
111.9
10.2
9.1
2.0
1.7
19.6
18.5
0.8
0.7
JK Tyres
Neutral
97
-
2,189
7,446
7,669
15.2
14.0
19.6
18.4
4.9
5.2
1.2
1.0
25.2
19.5
0.7
0.6
Swaraj Engines
Neutral
916
-
1,138
552
630
14.2
14.7
44.6
54.1
20.5
16.9
4.8
4.3
23.2
25.6
1.9
1.6
Subros
Neutral
92
-
554
1,268
1,488
11.6
11.9
3.7
6.6
25.0
14.0
1.7
1.5
6.8
11.4
0.7
0.6
Indag Rubber
Neutral
197
-
516
283
329
17.0
17.2
13.0
15.4
15.2
12.8
3.3
2.8
21.8
21.6
1.5
1.3
Capital Goods
ACE
Neutral
44
-
431
660
839
4.7
8.2
1.0
3.9
43.6
11.2
1.4
1.2
3.2
11.3
0.8
0.6
BEML
Neutral
1,123
-
4,679
3,277
4,006
6.0
8.9
29.2
64.3
38.5
17.5
2.2
2.0
5.7
11.7
1.5
1.2
BGR Energy
Neutral
115
-
829
3,615
3,181
9.5
9.4
16.7
12.4
6.9
9.3
0.7
0.6
10.0
7.0
0.6
0.8
BHEL
Neutral
176
-
43,066
33,722
35,272
10.8
11.7
10.5
14.2
16.8
12.4
1.2
1.2
7.0
9.0
1.4
1.3
Stock Watch
November 30, 2015
Company Name
Reco
CMP
Target
Mkt Cap
Sales ( Čcr )
OPM(%)
EPS (Č)
PER(x)
P/BV(x)
RoE(%)
EV/Sales(x)
(Č)
Price ( Č)
( Č cr )
FY16E
FY17E
FY16E
FY17E
FY16E
FY17E
FY16E
FY17E
FY16E
FY17E
FY16E
FY17E
FY16E
FY17E
Capital Goods
Blue Star
Accumulate
359
382
3,226
3,624
4,157
5.3
6.0
9.6
14.5
37.3
24.8
6.8
5.9
18.6
25.4
1.0
0.9
Crompton Greaves
Neutral
198
-
12,416
13,484
14,687
4.9
6.2
4.5
7.1
44.0
27.9
3.1
2.9
7.2
10.8
1.1
1.0
Inox Wind
Buy
361
505
8,009
4,980
5,943
17.0
17.5
26.6
31.6
13.6
11.4
4.1
3.0
35.0
30.0
1.8
1.4
KEC International
Neutral
154
-
3,946
8,791
9,716
6.1
6.8
5.4
8.2
28.4
18.7
2.8
2.6
10.0
14.0
0.7
0.6
Thermax
Neutral
866
-
10,318
6,413
7,525
7.4
8.5
30.5
39.3
28.4
22.0
4.4
3.8
15.0
17.0
1.6
1.3
Cement
ACC
Buy
1,355
1,630
25,440
13,151
14,757
16.4
18.3
63.9
83.4
21.2
16.3
2.7
2.5
13.3
16.1
1.8
1.5
Ambuja Cements
Buy
202
233
31,333
11,564
12,556
19.4
20.7
8.9
10.1
22.7
20.0
2.8
2.7
12.8
13.8
2.4
2.1
HeidelbergCement
Neutral
76
-
1,723
1,772
1,926
13.3
15.4
1.0
3.0
76.1
25.4
1.9
1.8
2.6
7.9
1.5
1.3
India Cements
Buy
87
112
2,669
4,216
4,840
18.0
19.5
4.0
9.9
21.7
8.8
0.9
0.8
4.0
9.5
1.0
0.8
JK Cement
Neutral
711
-
4,972
3,661
4,742
10.1
15.8
18.0
61.0
39.5
11.7
2.9
2.5
7.5
22.9
1.8
1.4
J K Lakshmi Cement
Buy
358
430
4,217
2,947
3,616
16.7
19.9
11.5
27.2
31.2
13.2
3.0
2.6
9.8
20.8
1.8
1.5
Mangalam Cements
Neutral
194
-
518
1,053
1,347
10.5
13.3
8.4
26.0
23.1
7.5
1.0
0.9
4.3
12.5
0.9
0.6
Orient Cement
Accumulate
163
183
3,343
1,854
2,524
21.2
22.2
7.7
11.1
21.2
14.7
3.0
2.6
13.3
15.7
2.5
1.8
Ramco Cements
Neutral
378
-
9,002
4,036
4,545
20.8
21.3
15.1
18.8
25.0
20.1
3.1
2.7
12.9
14.3
2.7
2.4
Shree Cement^
Neutral
11,234
-
39,135
7,150
8,742
26.7
28.6
228.0
345.5
49.3
32.5
7.3
6.1
15.7
20.3
5.2
4.2
UltraTech Cement
Buy
2,833
3,282
77,731
25,021
30,023
19.1
21.6
89.0
132.0
31.8
21.5
3.7
3.2
12.2
15.9
3.2
2.7
Construction
ITNL
Neutral
90
-
2,959
7,360
8,825
34.0
35.9
7.0
9.0
12.9
10.0
0.4
0.4
3.2
3.7
3.8
3.6
KNR Constructions
Accumulate
620
673
1,744
937
1,470
14.3
14.0
33.5
38.6
18.5
16.1
2.8
2.4
15.4
15.4
1.9
1.3
Larsen & Toubro
Buy
1,364
1,646
126,924
65,065
77,009
11.5
11.7
61.5
65.6
22.2
20.8
2.3
2.0
13.4
14.0
2.1
1.8
Gujarat Pipavav Port
Neutral
167
-
8,057
629
684
51.0
52.2
6.4
5.9
26.0
28.3
3.4
3.2
15.9
12.7
12.5
11.3
MBL Infrastructures
Buy
221
285
916
2,313
2,797
12.2
14.6
19.0
20.0
11.6
11.0
1.2
1.1
11.3
10.6
1.1
1.0
Nagarjuna Const.
Neutral
78
-
4,336
7,892
8,842
8.8
9.1
3.0
5.3
26.0
14.7
1.3
1.2
5.0
8.5
0.8
0.7
PNC Infratech
Neutral
534
-
2,737
1,873
2,288
13.2
13.5
24.0
32.0
22.2
16.7
2.2
2.0
12.1
12.3
1.6
1.3
Simplex Infra
Neutral
333
-
1,645
5,955
6,829
10.3
10.5
16.0
31.0
20.8
10.7
1.4
1.2
5.3
9.9
0.8
0.7
Power Mech Projects
Neutral
626
-
3,762
1,539
1,801
12.8
12.7
59.0
72.1
10.6
8.7
2.6
2.3
18.6
16.8
2.5
2.1
Sadbhav Engineering
Neutral
345
-
2,420
3,481
4,219
10.7
10.8
8.0
12.0
43.2
28.8
1.4
1.3
10.3
13.5
1.0
0.8
National Buildings
Construction
Accumulate
994
1,089
7,965
7,382
9,506
7.7
8.6
39.8
54.4
25.0
18.3
4.1
3.7
26.7
29.1
0.8
0.6
Corporation
Sadbhav Infrastructure
Neutral
345
-
2,420
3,481
4,219
10.7
10.8
8.0
12.0
43.2
28.8
1.4
1.3
10.3
13.5
1.0
0.8
Project
Financials
Allahabad Bank
Neutral
76
-
4,549
8,332
9,259
2.8
2.8
21.0
25.6
3.6
3.0
0.4
0.3
9.8
10.9
-
-
Stock Watch
November 30, 2015
Company Name
Reco
CMP
Target
Mkt Cap
Sales ( Čcr )
OPM(%)
EPS (Č)
PER(x)
P/BV(x)
RoE(%)
EV/Sales(x)
(Č)
Price ( Č)
( Č cr )
FY16E
FY17E
FY16E
FY17E
FY16E
FY17E
FY16E
FY17E
FY16E
FY17E
FY16E
FY17E
FY16E
FY17E
Financials
Axis Bank
Buy
471
630
111,973
26,473
31,527
3.5
3.6
35.7
43.5
13.2
10.8
2.6
2.2
17.9
18.9
-
-
Bank of Baroda
Neutral
179
-
41,302
19,105
21,474
2.0
2.0
19.1
24.8
9.4
7.2
1.0
0.9
10.2
12.1
-
-
Bank of India
Neutral
130
-
10,319
15,972
17,271
1.9
2.0
15.3
33.4
8.5
3.9
0.4
0.3
3.6
7.6
-
-
Canara Bank
Neutral
271
-
14,704
15,251
16,725
2.0
2.0
59.3
68.6
4.6
4.0
0.5
0.4
10.1
10.7
-
-
Dena Bank
Neutral
42
-
2,357
3,440
3,840
2.1
2.3
7.3
10.0
5.8
4.2
0.4
0.4
6.1
7.9
-
-
Federal Bank
Neutral
59
-
10,110
3,477
3,999
3.0
3.0
5.0
6.2
11.7
9.4
1.2
1.1
10.6
11.9
-
-
HDFC
Neutral
1,230
-
194,070
10,358
11,852
3.3
3.3
41.1
47.0
30.0
26.2
5.7
5.2
24.7
24.9
-
-
HDFC Bank
Buy
1,079
1,262
271,625
38,309
47,302
4.3
4.3
49.3
61.1
21.9
17.7
3.8
3.3
18.5
19.7
-
-
ICICI Bank
Buy
270
357
156,575
35,168
40,517
3.4
3.4
21.4
25.2
12.6
10.7
2.2
1.8
14.7
15.2
-
-
IDBI Bank
Neutral
86
-
13,858
9,625
10,455
1.8
1.8
8.5
14.2
10.1
6.1
0.6
0.6
5.9
9.3
-
-
Indian Bank
Neutral
130
-
6,263
6,160
6,858
2.5
2.5
24.5
29.8
5.3
4.4
0.4
0.4
7.7
8.6
-
-
LIC Housing Finance
Buy
482
571
24,315
3,101
3,745
2.5
2.5
33.0
40.2
14.6
12.0
2.7
2.3
19.7
20.5
-
-
Oriental Bank
Neutral
155
-
4,652
7,643
8,373
2.4
2.4
37.2
45.4
4.2
3.4
0.4
0.3
8.2
9.4
-
-
Punjab Natl.Bank
Neutral
144
-
28,335
23,638
26,557
2.8
2.8
17.9
27.2
8.1
5.3
0.8
0.7
8.5
12.0
-
-
South Ind.Bank
Neutral
20
-
2,714
1,965
2,185
2.5
2.5
2.5
3.3
8.1
6.1
0.8
0.7
9.5
11.7
-
-
St Bk of India
Accumulate
250
283
193,720
82,520
93,299
2.7
2.8
20.0
24.5
12.5
10.2
1.4
1.2
11.5
12.8
-
-
Union Bank
Neutral
168
-
11,563
12,646
14,129
2.3
2.4
31.0
39.1
5.4
4.3
0.6
0.5
9.8
11.4
-
-
Vijaya Bank
Neutral
35
-
3,024
3,536
3,827
1.9
1.9
5.5
6.7
6.4
5.3
0.5
0.5
7.8
8.8
-
-
Yes Bank
Buy
762
914
31,906
7,228
9,043
3.2
3.3
57.7
69.4
13.2
11.0
2.4
2.0
19.1
19.6
-
-
FMCG
Asian Paints
Neutral
858
-
82,270
16,553
19,160
16.0
16.2
17.7
21.5
48.5
39.9
12.9
11.6
29.4
31.2
4.8
4.1
Britannia
Neutral
2,930
-
35,156
8,065
9,395
9.6
10.2
47.2
65.5
62.1
44.7
20.6
19.5
38.3
41.2
4.2
3.6
Colgate
Neutral
965
-
26,233
4,836
5,490
19.5
19.7
48.5
53.2
19.9
18.1
14.6
12.7
99.8
97.5
5.3
4.7
Dabur India
Neutral
276
-
48,479
9,370
10,265
17.1
17.2
7.3
8.1
37.6
34.1
11.4
9.2
33.7
30.6
5.1
4.6
GlaxoSmith Con*
Neutral
5,947
-
25,010
4,919
5,742
17.2
17.4
168.3
191.2
35.3
31.1
10.0
8.5
28.8
28.9
4.6
3.9
Godrej Consumer
Neutral
1,288
-
43,874
10,168
12,886
16.1
16.1
32.1
38.4
40.1
33.6
8.2
7.5
19.7
21.0
4.4
3.5
HUL
Neutral
818
-
176,896
34,940
38,957
17.5
17.7
20.8
24.7
39.3
33.1
43.7
34.9
110.5
114.2
4.9
4.3
ITC
Buy
344
409
276,071
41,068
45,068
37.8
37.4
13.9
15.9
24.7
21.6
8.3
7.3
34.1
33.8
6.4
5.8
Marico
Neutral
421
-
27,158
6,551
7,766
15.7
16.0
10.4
12.5
40.6
33.7
11.8
9.8
33.2
32.4
4.1
3.4
Nestle*
Accumulate
5,964
6,646
57,502
11,291
12,847
22.2
22.3
158.9
184.6
37.5
32.3
19.6
17.6
55.0
57.3
4.9
4.3
Stock Watch
November 30, 2015
Company Name
Reco
CMP
Target
Mkt Cap
Sales ( Čcr )
OPM(%)
EPS (Č)
PER(x)
P/BV(x)
RoE(%)
EV/Sales(x)
(Č)
Price ( Č)
( Č cr )
FY16E FY17E
FY16E
FY17E
FY16E
FY17E
FY16E
FY17E
FY16E
FY17E
FY16E
FY17E
FY16E
FY17E
FMCG
Tata Global
Accumulate
137
144
8,636
8,635
9,072
9.8
9.9
6.5
7.6
21.1
18.0
2.1
2.0
6.8
7.4
0.9
0.9
IT
HCL Tech^
Buy
870
1,132
122,298
42,038
47,503
23.2
23.5
55.8
62.9
15.6
13.8
3.6
2.7
23.0
19.8
2.5
2.0
Infosys
Buy
1,066
1,306
244,923
60,250
66,999
28.0
28.0
58.3
63.7
18.3
16.7
3.8
3.3
20.9
19.7
3.4
2.9
TCS
Buy
2,353
3,165
463,573
111,274
126,852
28.4
28.7
125.4
143.9
18.8
16.4
7.4
6.8
39.9
42.2
3.8
3.3
Tech Mahindra
Buy
533
646
51,315
25,566
28,890
16.0
17.0
26.3
31.9
20.3
16.7
3.7
3.1
17.9
18.6
1.8
1.5
Wipro
Buy
570
719
140,821
52,414
58,704
23.7
23.8
38.4
42.3
14.9
13.5
2.9
2.6
19.5
18.0
2.3
1.9
Media
D B Corp
Accumulate
330
356
6,054
2,241
2,495
27.8
27.9
21.8
25.6
15.1
12.9
4.0
3.5
26.7
28.5
2.6
2.4
HT Media
Neutral
79
-
1,842
2,495
2,603
11.2
11.2
7.3
8.6
10.8
9.2
0.9
0.8
7.4
8.1
0.2
0.2
Jagran Prakashan
Buy
146
169
4,771
2,170
2,355
27.0
27.6
12.8
10.3
11.4
14.2
3.2
3.0
21.8
19.4
2.0
1.7
Sun TV Network
Neutral
394
-
15,517
2,779
3,196
70.2
70.5
22.8
27.3
17.3
14.4
4.3
3.9
26.7
28.3
5.3
4.6
Hindustan Media
Neutral
283
-
2,074
920
1,031
20.0
20.0
19.2
20.9
14.7
13.5
2.4
2.1
16.4
15.3
1.8
1.6
Ventures
Metals & Mining
Coal India
Accumulate
336
380
212,388
76,167
84,130
19.9
22.3
22.4
25.8
15.0
13.0
5.4
5.3
35.5
41.0
2.1
1.9
Hind. Zinc
Buy
142
175
60,190
14,641
14,026
50.4
50.4
17.7
16.0
8.1
8.9
1.2
1.1
16.2
13.2
1.7
1.6
Hindalco
Neutral
78
-
16,004
104,356
111,186
8.7
9.5
6.7
11.1
11.5
7.0
0.4
0.4
3.5
5.9
0.7
0.6
JSW Steel
Neutral
871
-
21,059
42,308
45,147
16.4
20.7
(10.3)
49.5
17.6
1.0
0.9
(1.0)
5.6
1.5
1.4
NMDC
Neutral
93
-
36,693
8,237
10,893
46.6
44.5
10.0
11.7
9.3
7.9
1.0
0.9
12.5
13.0
4.2
3.2
SAIL
Neutral
46
-
18,792
45,915
53,954
7.2
10.5
1.5
4.4
30.2
10.4
0.4
0.4
2.3
4.1
1.1
0.9
Vedanta
Neutral
92
-
27,231
71,445
81,910
26.2
26.3
12.9
19.2
7.1
4.8
0.5
0.4
7.2
8.9
0.8
0.6
Tata Steel
Neutral
231
-
22,455
126,760
137,307
8.9
11.3
6.4
23.1
36.3
10.0
0.7
0.7
2.0
7.1
0.8
0.7
Oil & Gas
Cairn India
Neutral
137
-
25,714
11,323
12,490
49.4
51.0
20.7
20.7
6.6
6.6
0.4
0.4
6.4
6.1
1.3
0.7
GAIL
Neutral
368
-
46,623
64,856
70,933
9.1
9.6
24.0
28.9
15.3
12.7
1.3
1.2
8.8
9.6
0.9
0.8
ONGC
Neutral
235
-
201,268
154,564
167,321
36.8
37.4
28.6
32.5
8.2
7.2
1.1
1.0
12.7
13.5
1.5
1.4
Petronet LNG
Neutral
231
-
17,321
29,691
31,188
5.8
6.2
12.8
13.4
18.1
17.2
2.7
2.4
15.8
14.8
0.7
0.6
Indian Oil Corp
Accumulate
419
455
101,828
359,607
402,760
5.9
6.1
42.5
48.7
9.9
8.6
1.3
1.2
14.1
14.4
0.4
0.3
Reliance Industries
Accumulate
979
1,050
317,058
304,775
344,392
12.6
13.4
91.3
102.6
10.7
9.5
1.2
1.1
11.8
12.0
1.0
0.8
Pharmaceuticals
Alembic Pharma
Neutral
682
-
12,862
2,658
3,112
24.1
20.2
24.6
23.9
27.7
28.6
10.0
7.6
42.5
30.2
4.8
4.1
Aurobindo Pharma
Accumulate
818
872
47,786
14,923
17,162
23.0
23.0
38.2
43.6
21.4
18.8
6.6
5.0
36.0
30.2
3.5
3.0
Aventis*
Neutral
4,390
-
10,111
2,082
2,371
17.4
20.8
118.2
151.5
37.1
29.0
5.4
4.4
19.9
25.5
4.5
3.8
Cadila Healthcare
Neutral
411
-
42,060
10,224
11,840
21.0
22.0
14.6
17.6
28.1
23.3
7.7
6.0
30.8
29.0
4.2
3.5
Stock Watch
November 30, 2015
Company Name
Reco
CMP
Target
Mkt Cap
Sales ( Čcr )
OPM(%)
EPS (Č)
PER(x)
P/BV(x)
RoE(%)
EV/Sales(x)
(Č)
Price ( Č)
( Č cr )
FY16E FY17E
FY16E
FY17E
FY16E
FY17E
FY16E
FY17E
FY16E
FY17E
FY16E
FY17E
FY16E
FY17E
Pharmaceuticals
Cipla
Neutral
643
-
51,608
14,211
16,611
20.6
19.0
27.0
28.9
23.8
22.2
4.0
3.5
18.4
16.8
3.6
3.0
Dr Reddy's
Buy
3,099
3,933
52,845
16,838
19,575
25.0
23.1
167.5
178.8
18.5
17.3
3.9
3.3
23.1
20.4
3.1
2.6
Dishman Pharma
Neutral
310
-
2,499
1,733
1,906
21.5
21.5
17.0
19.9
18.2
15.6
1.8
1.7
10.5
11.2
2.0
1.7
GSK Pharma*
Neutral
3,277
-
27,753
2,870
3,158
20.0
22.1
59.5
68.3
55.1
48.0
16.2
16.7
28.5
34.3
9.2
8.4
Indoco Remedies
Neutral
306
-
2,823
1,033
1,199
15.9
18.2
9.4
13.6
32.6
22.5
4.8
4.1
15.7
19.7
2.8
2.4
Ipca labs
Buy
766
900
9,667
3,363
3,909
12.9
18.6
13.4
28.0
57.2
27.4
7.5
5.9
7.4
14.0
3.2
2.7
Lupin
Neutral
1,815
-
81,696
13,092
16,561
25.0
27.0
50.4
68.3
36.0
26.6
7.4
5.9
22.8
24.7
6.0
4.6
Sun Pharma
Buy
740
950
178,064
28,163
32,610
25.8
30.7
17.4
26.9
42.5
27.5
4.0
3.5
13.0
16.6
5.8
4.8
Power
Tata Power
Neutral
66
-
17,918
35,923
37,402
22.6
22.8
4.1
5.2
16.3
12.9
1.3
1.2
7.5
9.3
1.4
1.3
NTPC
Buy
133
157
109,335
87,064
98,846
23.5
23.5
11.7
13.2
11.3
10.1
1.3
1.2
11.4
12.1
2.3
2.0
Power Grid
Buy
133
170
69,763
20,702
23,361
86.7
86.4
12.1
13.2
11.0
10.1
1.6
1.4
15.6
15.1
8.3
7.7
Telecom
Bharti Airtel
Neutral
342
-
136,571
101,748
109,191
32.1
31.7
12.0
12.5
28.5
27.3
2.0
1.8
6.9
6.7
2.0
1.8
Idea Cellular
Neutral
144
-
51,870
34,282
36,941
32.0
31.5
5.9
6.2
24.4
23.2
2.2
2.0
9.9
9.3
2.1
2.0
zOthers
Abbott India
Neutral
5,204
-
11,059
2,715
3,153
14.5
14.1
134.3
152.2
38.8
34.2
9.7
8.0
27.4
25.6
3.8
3.2
Bajaj Electricals
Buy
223
341
2,255
4,719
5,287
5.2
5.8
8.6
12.7
26.1
17.7
3.0
2.6
11.4
14.8
0.5
0.4
Finolex Cables
Neutral
256
-
3,908
2,520
2,883
12.2
12.0
12.7
14.2
20.2
18.0
2.8
2.4
13.6
13.5
1.3
1.1
Goodyear India*
Accumulate
551
622
1,271
1,888
1,680
12.1
11.9
62.2
56.6
8.9
9.7
2.1
1.8
25.9
19.7
0.5
0.4
Hitachi
Neutral
1,313
-
3,571
1,779
2,081
7.8
8.8
21.8
33.4
60.3
39.3
9.7
7.9
17.4
22.1
2.1
1.8
Jyothy Laboratories
Neutral
307
-
5,556
1,620
1,847
11.5
11.5
7.3
8.5
42.1
36.2
5.4
5.0
13.3
14.4
3.3
2.8
MRF
Buy
39,436
45,575
16,725
20,316
14,488
21.4
21.1
5,488.0
3,798.0
7.2
10.4
2.5
2.0
41.1
21.2
0.8
1.0
Page Industries
Neutral
13,184
-
14,705
1,929
2,450
19.8
20.1
229.9
299.0
57.4
44.1
25.3
17.6
52.1
47.1
7.7
6.0
Relaxo Footwears
Neutral
502
-
6,021
1,767
2,152
12.3
12.5
19.3
25.1
26.1
20.0
6.4
4.9
27.7
27.8
3.5
2.8
Siyaram Silk Mills
Buy
926
1,145
868
1,636
1,815
11.5
11.5
89.9
104.1
10.3
8.9
1.7
1.5
17.9
17.8
0.7
0.6
Styrolution ABS India*
Neutral
732
-
1,287
1,271
1,440
8.6
9.2
32.0
41.1
22.8
17.8
2.3
2.1
10.7
12.4
1.0
0.9
TVS Srichakra
Accumulate
2,927
3,240
2,241
2,101
2,338
15.7
15.0
248.6
270.0
11.8
10.8
5.1
3.7
43.6
34.0
1.1
0.9
HSIL
Neutral
303
-
2,190
2,123
2,384
16.1
16.5
15.0
18.9
20.1
16.1
1.6
1.5
8.0
9.4
1.4
1.2
Kirloskar Engines India
Neutral
268
-
3,874
2,471
2,826
8.8
10.4
9.1
13.3
29.4
20.1
2.8
2.6
9.7
13.4
1.2
1.0
Ltd
M M Forgings
Buy
514
614
620
511
615
21.7
21.6
43.1
55.8
11.9
9.2
2.2
1.8
19.9
21.2
1.4
1.1
Banco Products (India)
Neutral
139
-
996
1,208
1,353
11.0
12.3
10.8
14.5
12.9
9.6
1.5
1.3
11.9
14.5
0.8
0.7
Stock Watch
November 30, 2015
Company Name
Reco
CMP
Target Mkt Cap
Sales ( Čcr )
OPM(%)
EPS (Č)
PER(x)
P/BV(x)
RoE(%)
EV/Sales(x)
(Č)
Price ( Č)
( Č cr )
FY16E FY17E FY16E FY17E FY16E FY17E FY16E FY17E FY16E FY17E FY16E FY17E FY16E FY17E
zOthers
Competent Automobiles Neutral
143
-
88
1,040
1,137
3.2
3.1
25.7
28.0
5.6
5.1
0.8
0.7
15.0
14.3
0.1
0.1
Nilkamal
Accumulate
969
1,038
1,446
1,910
2,083
10.5
10.3
63.3
69.2
15.3
14.0
2.5
2.1
17.6
16.5
0.8
0.7
Visaka Industries
Buy
121
144
193
1,086
1,197
9.9
10.3
21.5
28.8
5.6
4.2
0.5
0.5
9.6
11.6
0.4
0.3
Transport Corporation of
Neutral
322
-
2,449
2,830
3,350
8.8
9.0
14.4
18.3
22.4
17.6
3.5
3.0
15.4
17.1
1.0
0.9
India
Elecon Engineering
Neutral
88
-
954
1,369
1,533
13.7
14.9
3.3
6.1
26.4
14.5
1.7
1.6
6.6
11.4
1.0
0.9
Surya Roshni
Buy
137
183
602
2,992
3,223
8.1
8.4
14.7
18.3
9.4
7.5
0.9
0.8
9.7
11.0
0.5
0.4
MT Educare
Buy
146
169
581
286
366
18.3
17.7
7.7
9.4
18.9
15.6
4.0
3.5
20.2
21.1
1.9
1.5
Radico Khaitan
Buy
115
156
1,525
1,565
1,687
12.2
13.0
5.7
7.1
20.1
16.2
1.7
1.6
8.3
9.6
1.4
1.3
Garware Wall Ropes
Accumulate
373
423
817
861
967
10.9
10.9
24.0
28.2
15.6
13.2
2.3
2.0
14.6
14.9
1.0
0.8
Wonderla Holidays
Neutral
363
-
2,048
206
308
44.0
43.6
9.0
12.9
40.3
28.1
5.5
5.0
13.7
17.8
9.8
6.6
Linc Pen & Plastics
Accumulate
176
185
260
340
371
8.3
8.9
10.8
13.2
16.3
13.3
2.6
2.3
16.0
17.1
0.8
0.7
The Byke Hospitality
Accumulate
167
181
670
222
287
20.5
20.5
5.6
7.6
29.6
22.1
5.6
4.6
18.9
20.8
3.1
2.4
Interglobe Aviation
Neutral
1,089
-
39,239
17,022
21,122
20.7
14.5
63.9
53.7
17.0
20.3
25.5
20.9
149.9
103.2
2.3
1.9
Coffee Day Enterprises
Neutral
258
-
5,319
2,692
2,964
17.0
18.6
-
4.7
-
54.5
3.2
3.0
0.2
5.5
2.4
2.2
Ltd
Navneet Education
Accumulate
86
97
430
998
1,062
24.1
24.0
5.8
6.1
14.9
14.1
3.3
2.9
22.0
20.6
0.5
0.5
Source: Company, Angel Research; Note: *December year end; #September year end; &October year end; Price as on November 27, 2015
Market Outlook
November 30, 2015
Research Team Tel: 022 - 39357800
DISCLAIMER
Angel Broking Private Limited (hereinafter referred to as “Angel”) is a registered Member of National Stock Exchange of India Limited,
Bombay Stock Exchange Limited and Metropolitian Stock Exchange of India Limited. It is also registered as a Depository Participant with
CDSL and Portfolio Manager with SEBI. It also has registration with AMFI as a Mutual Fund Distributor. Angel Broking Private Limited is a
registered entity with SEBI for Research Analyst in terms of SEBI (Research Analyst) Regulations, 2014 vide registration number
INH000000164. Angel or its associates has not been debarred/ suspended by SEBI or any other regulatory authority for accessing
/dealing in securities Market. Angel or its associates including its relatives/analyst do not hold any financial interest/beneficial ownership
of more than 1% in the company covered by Analyst. Angel or its associates/analyst has not received any compensation / managed or co
-managed public offering of securities of the company covered by Analyst during the past twelve months. Angel/analyst has not served as
an officer, director or employee of company covered by Analyst and has not been engaged in market making activity of the company
covered by Analyst.
This document is solely for the personal information of the recipient, and must not be singularly used as the basis of any investment
decision. Nothing in this document should be construed as investment or financial advice. Each recipient of this document should make
such investigations as they deem necessary to arrive at an independent evaluation of an investment in the securities of the companies
referred to in this document (including the merits and risks involved), and should consult their own advisors to determine the merits and
risks of such an investment.
Reports based on technical and derivative analysis center on studying charts of a stock's price movement, outstanding positions and
trading volume, as opposed to focusing on a company's fundamentals and, as such, may not match with a report on a company's
fundamentals.
The information in this document has been printed on the basis of publicly available information, internal data and other reliable sources
believed to be true, but we do not represent that it is accurate or complete and it should not be relied on as such, as this document is for
general guidance only. Angel Broking Pvt. Limited or any of its affiliates/ group companies shall not be in any way responsible for any
loss or damage that may arise to any person from any inadvertent error in the information contained in this report. Angel Broking Pvt.
Limited has not independently verified all the information contained within this document. Accordingly, we cannot testify, nor make any
representation or warranty, express or implied, to the accuracy, contents or data contained within this document. While Angel Broking
Pvt. Limited endeavors to update on a reasonable basis the information discussed in this material, there may be regulatory, compliance,
or other reasons that prevent us from doing so.
This document is being supplied to you solely for your information, and its contents, information or data may not be reproduced,
redistributed or passed on, directly or indirectly.
Neither Angel Broking Pvt. Limited, nor its directors, employees or affiliates shall be liable for any loss or damage that may arise from or
in connection with the use of this information.
Note: Please refer to the important ‘Stock Holding Disclosure' report on the Angel website (Research Section). Also, please refer to the
latest update on respective stocks for the disclosure status in respect of those stocks. Angel Broking Pvt. Limited and its affiliates may have
investment positions in the stocks recommended in this report.