Market Outlook
May 30, 2016
Market Cues
Domestic Indices
Chg (%)
(Pts)
(Close)
BSE Sensex
1.1
287
26,654
Indian Markets are expected to open in the green tracking the SGX Nifty and Global
Nifty
1.1
87
8,157
cues.
Mid Cap
1.4
156
11,347
The benchmark US stock indexes gained on Friday, with the Nasdaq Composite and
Small Cap
0.6
63
11,111
the Standard & Poor’s 500 at their highest levels since March after Federal Reserve
Chair Janet Yellen hinted at the likelihood of interest-rate hike in coming months.
Bankex
1.1
226
19,951
Investors shrugged off concerns about higher borrowing cost as the possibility of
rate hike in near future indicated that the US economy is improving.
Global Indices
Chg (%)
(Pts)
(Close)
European shares were steady on Friday, fluctuating between modest gains and
Dow Jones
0.3
45
17,873
losses. Investors were reluctant on making major moves ahead of Janet Yellen’s
Nasdaq
0.6
32
4,934
remarks. Swiss stocks extended their winning streak while Pharma stocks were up
after drug maker Roche gained on announcing positive results for one of its drugs.
FTSE
0.1
5
6,271
Nikkei
0.4
62
16,835
Indian markets rose by more than 1% on Friday, registering their fourth consecutive
session of gains. The markets gained on solid earnings posted by companies like
Hang Seng
0.9
180
20,577
BPCL and SBIN.
Shanghai Com
(0.0)
(1)
2,821
News Analysis
Advances / Declines
BSE
NSE
Sun Pharma gets US subpoena over pricing of generic drugs
Advances
1,405
919
Result Review: Indoco Remedies, Surya Roshni, Navkar Corp
Result Preview: Aurobindo Pharma
Declines
1,183
630
Detailed analysis on Pg2
Unchanged
196
79
Investor’s Ready Reckoner
Volumes (` Cr)
Key Domestic & Global Indicators
BSE
3,371
Stock Watch: Latest investment recommendations on 150+ stocks
NSE
21,169
Refer Pg6 onwards
Top Picks
Net Inflows (` Cr)
Net
Mtd
Ytd
CMP
Target
Upside
Company
Sector
Rating
(`)
(`)
(%)
FII
720
1,511
13,302
Amara Raja
Auto/Auto Ancillary
Buy
862
1,076
24.9
MFs
873
4,646
7,242
HCL Tech
IT
Buy
755
1,000
32.5
LIC Housing
Financials
Buy
462
592
28.1
Top Gainers
Price (`)
Chg (%)
Bharat Electronics
Capital Goods
Buy
1,183
1,414
19.5
Hindpetro
931
9.8
Navkar Corporation Others
Buy
191
265
39.0
Fincables
334
9.4
More Top Picks on Pg5
Bpcl
1,011
9.1
Key Upcoming Events
Prestige
185
8.8
Previous
Consensus
Date
Region
Event Description
Rpower
52
7.5
Reading
Expectations
May 30 Euro Zone
Euro Zone Consumer Confidence
(7.0)
(7.0)
May 31 US
Consumer Confidence
94.0
96.0
Top Losers
Price (`)
Chg (%)
June 01 US
Initial Jobless claims
268.0
--
Feldvr
16
(7.5)
June 01 UK
PMI Manifacturing
49.2
49.6
Fortis
164
(5.6)
6.(
More Events on Pg6
Jublfood
1,112
(3.5)
Canbk
193
(2.9)
Adanipower
30
(2.9)
As on May 27, 2016
Market Outlook
May 30, 2016
Sun Pharma gets US subpoena over pricing of generic drugs
As per company announcement, one of the company’s US subsidiaries Sun
Pharmaceuticals Industries Inc (SPII) has received a grand jury subpoena from the
United States Department of Justice (DOJ) seeking documents from SPII and its
affiliates relating to generic pharmaceutical products and pricing, communication
with competitors and other related matters. The company has informed that SPII is
currently responding to the subpoena but it has not disclosed the product over
which it has been asked to provide the information. As per the company, the
outcome of the enquiry is unlikely to have any material adverse impact on the
consolidated performance of the company. We currently have a BUY rating on the
stock.
Indoco Remedies (CMP: `293 / TP: -/ Upside: -)
For 4QFY2016, Indoco Remedies, posted results much below expectations. It
posted sales of `255cr V/s `300cr expected a yoy growth of 20.5%. The growth
was mainly driven by exports ( `117.8cr), a yoy growth of 43.8%, while domestic
sales ( `136.3cr), posted a yoy growth of 5.6%. The domestic formulation sales
(`130.8cr) a yoy growth of 6.4%. Exports sales was driven by the Formulation
exports ( `110.5cr), a yoy growth of 47.3%.On operating front, the gross margins
came in at 67.7% V/s 67.6% during the last corresponding period, while EBDITA
came in at 12.7% V/s 18.4% during the last corresponding period. The margins
came under pressure on back of the R&D expenditure, which rose by 153.7% yoy.
The reported net profit thus came in at `20cr V/s `18.8cr during the last
corresponding period, a yoy growth of 6.7%. We remain NEUTRAL on the stock.
Y/E
Sales OPM
PAT EPS ROE P/E P/BV EV/EBITDA EV/Sales
March
(` cr)
(%)
(` cr)
(`)
(%) (x) (x)
(x)
(x)
FY2016E
2,870 20.0
504 59.5 28.5 57.6 17.0
47.5
9.5
FY2017E
3,158 22.1
579 68.3 34.3 50.1 17.4
39.4
8.7
Surya Roshni (CMP: `158/ TP: `201/ Upside: 27%)
Surya Roshni posted a good set of numbers for 4QFY2016. The top-line grew by
7.6% yoy to `845cr which is higher than our estimate of `807cr. The better
performance was on account of 20.7% yoy increase in lighting products revenue to
`405cr while steel products business posted revenue growth of 2.2% yoy to
`518cr.
On operational front, employee and other expenses were mostly flat while the raw
material cost declined by 170bp yoy to 70.3% of sales. As a result, the EBITDA
margin expanded by 102bp yoy to 7.8% which is marginally lower than our
estimate of 8.0% while the EBITDA grew by 23.7% yoy to `66cr, which is in-line
with our estimate of `64cr. The EBIT margin for the lighting business was stable on
yoy basis while margins for steel business improved by 66bp yoy to 2.7%.
The lighting business of the company has been the main reason behind company’s
ability to post a revenue growth of ~7% for FY2016 in an environment where its
steel business was hurt on account of poor realizations and volumes. Going
forward, we expect the company to leverage on its vast dealer network to grow its
lighting business while the steel business slowly recovers. The company has also
Market Outlook
May 30, 2016
announced that it is considering amalgamating its associate company Surya
Global Steel Tubes with itself. This is particularly positive as the associate has
better profitability than its standalone steel business and the company will benefit
from operational synergies. We maintain our BUY recommendation on the stock.
Y/E
Sales OPM
PAT EPS ROE P/E P/BV EV/EBITDA EV/Sales
March
(` cr)
(%)
(` cr)
(`)
(%) (x) (x)
(x)
(x)
FY2017E
3,342
7.8
76 17.3 10.5
8.8
0.9
5.8
0.5
FY2018E
3,625
7.5
87 19.8 10.8
7.7
0.8
5.4
0.4
Navkar Corp (CMP: `191/TP: `265/ Upside: 39%)
For 4QFY2016, Navkar has reported a good set of numbers. The Consolidated
top-line during the quarter grew by 8.5% to ~`91cr on account of possible
improvement in EXIM volumes. On the operating margin front, the company has
reported a margin expansion of 904bp YoY to 41.9% on account of sharp decline
in other operating expenses. As a result EBITDA grew by 38.4% yoy to ~`38cr for
the quarter. On account of better operating performance and higher other
income, net profit grew by ~107% to ~`26cr.
Going forward, we expect NCL’s utilizations to increase; we expect NCL to be able
to garner a good chunk of business over the next three to four years due to its rail
advantage at both JNPT and Vapi. Moreover, the capacity addition at JNPT port
serves as an additional long-term trigger for the stock. Hence, we maintain
POSITIVE stance on the stock.
Result Preview
Aurobindo Pharma (CMP: `764 /TP: `856/ Upside: 12.0%)
For 4QFY2016, Aurobindo Pharma, is expected to post sales of `3,700cr V/s
`3,144cr in 4QFY2015 a yoy growth of 17.7%. On operating front, the gross
margins is expected to come at 54.4% V/s 56.3% during the last corresponding
period, while EBDITA is expected to come in at 20.8% V/s 20.3% during the last
corresponding period. The reported net profit thus is expected to come n at `551cr
V/s `404cr during the last corresponding period, a yoy growth of 36.5%. We
recommend ACCUMULATE on the stock.
Y/E
Sales OPM
PAT EPS ROE P/E P/BV EV/EBITDA EV/Sales
March
(` cr)
(%)
(` cr)
(`)
(%) (x) (x)
(x)
(x)
FY2016E
14,923 22.0
2,084 35.7 34.0 21.4
6.3
15.3
3.4
FY2017E
17,162 23.0
2,498 42.8 30.2 17.9
4.7
12.5
2.9
Economic and Political News
Good monsoon could boost farm profitability by 12%: Report
Arunachal CM asks Centre to build rail corridor in state
Domestic indicators point to nascent recovery: Deutsche Bank
Corporate News
Wipro to take hyper automation drive across all projects in FY17
Jet to take back 6 Boeing planes from Etihad for use in its core routes
United Spirits to reduce debt by up to `2,000cr in 2 yrs
Market Outlook
May 30, 2016
Quarterly Bloomberg Brokers Consensus Estimate
Tata Motors Ltd. Consol - May 30, 2016
Particulars (` cr)
4QFY16E
4QFY15
y-o-y (%)
3QFY16
q-o-q (%)
Net sales
72,720
67,298
8.1
71,686
1.4
EBITDA
10,023
8,438
18.8
9,380
6.9
EBITDA margin (%)
13.8
12.5
13.1
Net profit
3,436
1,717
100.2
3,508
(2.0)
Sun Pharmaceuticals Industries Ltd. Consol - May 30, 2016
Particulars (` cr)
4QFY16E
4QFY15
y-o-y (%)
3QFY16
q-o-q (%)
Net sales
7,681
6,145
25.0
7,047
9.0
EBITDA
2,747
1,098
150.1
2,169
26.6
EBITDA margin (%)
35.8
17.9
30.8
Net profit
1,838
888
106.9
1,417
29.7
Mahindra and Mahindra Ltd. - May 30, 2016
Particulars (` cr)
4QFY16E
4QFY15
y-o-y (%)
3QFY16
q-o-q (%)
Net sales
10,458
9,412
11.1
10,466
(0.1)
EBITDA
1,091
1,145
(4.7)
1,243
(12.2)
EBITDA margin (%)
10.4
12.2
11.9
Net profit
673
551
22.3
821
(18.0)
NTPC Ltd. - May 30, 2016
Particulars (` cr)
4QFY16E
4QFY15
y-o-y (%)
3QFY16
q-o-q (%)
Net sales
18,288
19,230
(4.9)
17,318
5.6
EBITDA
4,801
4,649
3.3
4,585
4.7
EBITDA margin (%)
26.3
24.2
26.5
Net profit
2,455
2,944
(16.6)
2,493
(1.5)
Steel Authority of India Ltd. - May 30, 2016
Particulars (` cr)
4QFY16E
4QFY15
y-o-y (%)
3QFY16
q-o-q (%)
Net sales
10,926
11,469
(4.7)
8,805
24.1
EBITDA
(336)
930
0.0
(1,381)
75.6
EBITDA margin (%)
(3.1)
8.1
(15.7)
Net profit
(858)
334
0.0
(1,529)
43.9
Aurobindo Pharma Ltd. Consol - May 30, 2016
Particulars (` cr)
4QFY16E
4QFY15
y-o-y (%)
3QFY16
q-o-q (%)
Net sales
3,712
3,144
18.1
3,432
8.2
EBITDA
894
656
36.3
822
8.8
EBITDA margin (%)
24.1
20.9
24.0
Net profit
564
403
40.0
535
5.4
Market Outlook
May 30, 2016
Top Picks ★★★★★
Large Cap
Market Cap
CMP
Target
Upside
Company
Rationale
(` Cr)
(`)
(`)
(%)
To outpace battery industry growth due to better technological
Amara Raja Batteries
14,716
862
1,076
24.9
products leading to market share gains in both the automotive
OEM and replacement segments.
Uptick in defense capex by government when coupled with
Bharat Electronics
28,393
1,183
1,414
19.5
BELs strong market positioning, indicate that good times are
ahead for BEL.
The stock is trading at attractive valuations and is factoring all
HCL Tech
1,06,448
755
1,000
32.5
the bad news.
Strong visibility for a robust 20% earnings trajectory, coupled
HDFC Bank
3,00,309
1,187
1,262
6.3
with high quality of earnings on account of high quality retail
business and strategic focus on highly rated corporates.
Back on the growth trend, expect a long term growth of 14%
Infosys
2,86,291
1,246
1,374
10.2
to be a US$20bn in FY2020.
LICHF continues to grow its retail loan book at a healthy pace
with improvement in asset quality. We expect the company to
LIC Housing Finance
23,308
462
592
28.1
post a healthy loan book which is likely to reflect in a strong
earnings growth.
Huge bid pipeline of re-development works at Delhi and other
NBCC
11,423
952
1,098
15.3
State Governments and opportunity from Smart City, positions
NBCC to report strong growth, going forward.
Source: Company, Angel Research
Mid Cap
Market Cap
CMP
Target
Upside
Company
Rationale
(` Cr)
(`)
(`)
(%)
Favorable outlook for the AC industry to augur well for
Cooling products business which is out pacing the market
Blue Star
3,900
434
481
10.9
growth. EMPPAC division's profitability to improve once
operating environment turns around.
With a focus on the low and medium income (LMI) consumer
Dewan Housing
5,763
198
270
36.7
segment, the company has increased its presence in tier-II &
III cities where the growth opportunity is immense.
Commencement of new projects, downtrend in the interest
IL&FS Transport
2,304
70
93
32.8
rate cycle, to lead to stock re-rating
Economic recovery to have favourable impact on advertising
& circulation revenue growth. Further, the acquisition of a
Jagran Prakashan
5,678
174
205
18.0
radio business (Radio City) would also boost the company's
revenue growth.
Speedier execution and speedier sales, strong revenue visibilty
Mahindra Lifespace
1,807
440
554
25.8
in short-to-long run, attractive valuations
Massive capacity expansion along with rail advantage at ICD
Navkar Corporation
2,720
191
265
39.0
as well CFS augurs well for the company
Earnings boost on back of stable material prices and
Radico Khaitan
1,129
85
125
47.3
favourable pricing environment. Valuation discount to peers
provides additional comfort
Strong brands and distribution network would boost growth
Siyaram Silk Mills
983
1,048
1,354
29.1
going ahead. Stock currently trades at an inexpensive
valuation.
Source: Company, Angel Research
Market Outlook
May 30, 2016
Key Upcoming Events
Result Calendar
Date
Company
Tata Motors, M&M, BGR Energy , Blue Star, SAIL, Bhushan Steel, Bajaj Electrical, Hitachi, Tide Water Oil India, Sun
May 30, 2016
Pharma, Aurobindo Pharma, Ipca labs, NTPC, Unitech, Competent Automobiles, Transport Corporation of India
Source: Bloomberg, Angel Research
Global economic events release calendar
Date
Time
Country
Event Description
Unit
Period
Bloomberg Data
Last Reported Estimated
May 30, 2016 2:30PM Euro Zone
Euro-Zone Consumer Confidence
Value
May F
(7.00)
(7.00)
May 31, 2016 7:30PM US
Consumer Confidence
S.A./ 1985=100
May
94.20
96.00
1:25PM Germany
Unemployment change (000's)
Thousands
May
(16.00)
(5.00)
Jun 1, 2016
1:25PM Germany
PMI Manufacturing
Value
May F
52.40
52.40
6:00PM US
Initial Jobless claims
Thousands
May 28
268.00
--
2:00PM UK
PMI Manufacturing
Value
May
49.20
49.60
Jun 2, 2016
6:30AM China
PMI Manufacturing
Value
May
50.10
50.00
5:15PM Euro Zone
ECB announces interest rates
%
Jun 2
--
--
Jun 3, 2016
1:25PM Germany
PMI Services
Value
May F
55.20
55.20
6:00PM US
Change in Nonfarm payrolls
Thousands
May
160.00
160.00
6:00PM US
Unnemployment rate
%
May
5.00
4.90
Jun 7, 2016
2:30PM Euro Zone
Euro-Zone GDP s.a. (QoQ)
% Change
1Q F
0.50
--
11:00AM India
RBI Reverse Repo rate
%
Jun 7
6.00
--
11:00AM India
RBI Repo rate
%
Jun 7
6.50
--
11:00AM India
RBI Cash Reserve ratio
%
Jun 7
4.00
--
Jun 8, 2016
2:00PM UK
Industrial Production (YoY)
% Change
Apr
(0.20)
--
7:00AM China
Consumer Price Index (YoY)
% Change
May
2.30
--
Jun 9, 2016
China
Exports YoY%
% Change
May
(1.80)
--
Jun 10, 2016
India
Imports YoY%
% Change
May
(23.10)
--
India
Exports YoY%
% Change
May
(6.70)
--
5:30PM India
Industrial Production YoY
% Change
Apr
0.10
--
Jun 12, 2016 11:00AM China
Industrial Production (YoY)
% Change
May
6.00
--
Jun 14, 2016 12:00PM India
Monthly Wholesale Prices YoY%
% Change
May
0.34
--
2:00PM UK
CPI (YoY)
% Change
May
0.30
--
Source: Bloomberg, Angel Research
Market Outlook
May 30, 2016
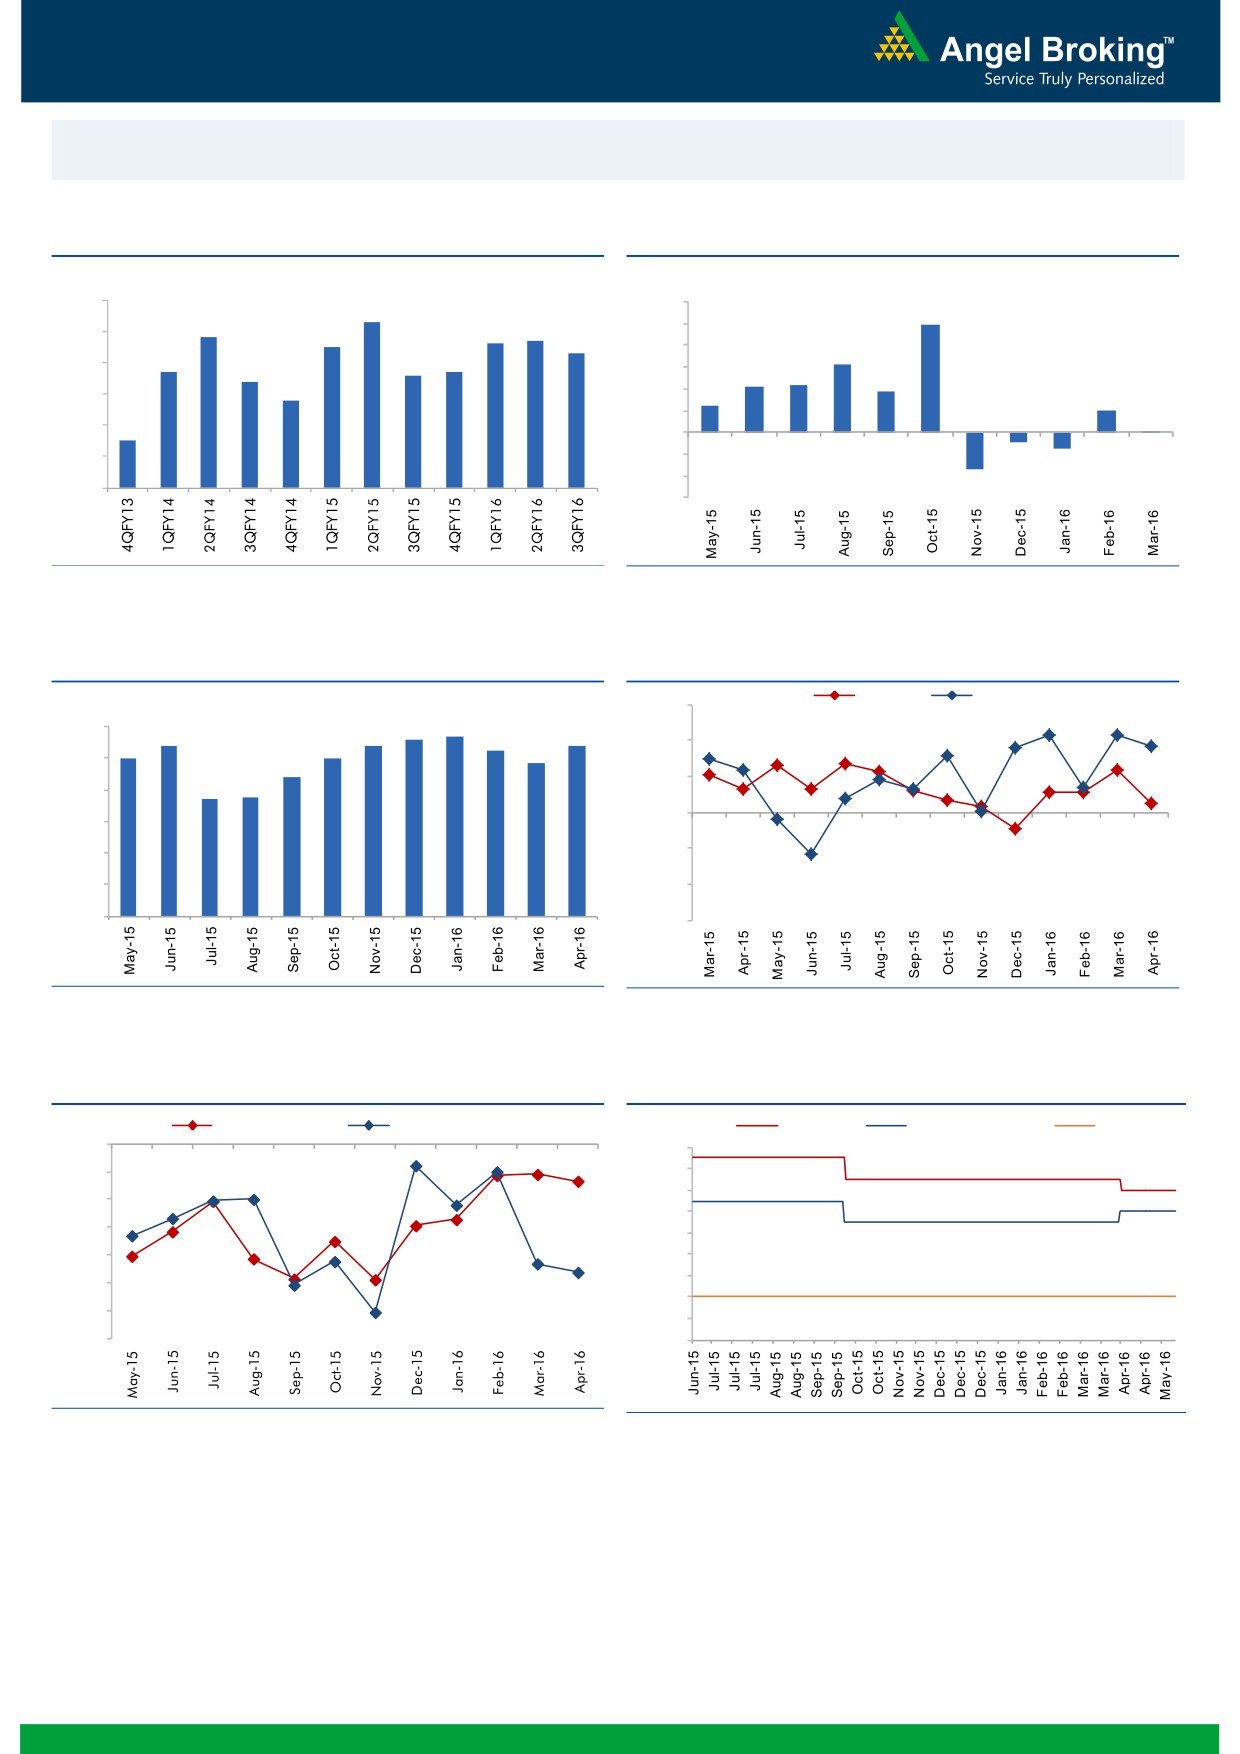
Macro watch
Exhibit 1: Quarterly GDP trends
Exhibit 2: IIP trends
(%)
(%)
9.0
12.0
8.3
9.9
7.8
7.6
7.7
10.0
8.0
7.5
7.3
8.0
6.3
6.7
6.6
6.7
7.0
6.4
6.0
4.2
4.3
3.7
5.8
4.0
2.5
6.0
2.0
2.0
0.1
5.0
4.5
-
4.0
(2.0)
(0.9)
(1.5)
(4.0)
3.0
(3.4)
(6.0)
Source: CSO, Angel Research
Source: MOSPI, Angel Research
Exhibit 3: Monthly CPI inflation trends
Exhibit 4: Manufacturing and services PMI
Mfg. PMI
Services PMI
(%)
56.0
5.6
5.7
6.0
5.4
5.4
5.4
5.3
5.0
5.0
54.0
4.8
5.0
4.4
52.0
3.7
3.7
4.0
50.0
3.0
48.0
2.0
1.0
46.0
-
44.0
Source: MOSPI, Angel Research
Source: Market, Angel Research; Note: Level above 50 indicates expansion
Exhibit 5: Exports and imports growth trends
Exhibit 6: Key policy rates
(%)
Exports yoy growth
Imports yoy growth
(%)
Repo rate
Reverse Repo rate
CRR
0.0
7.50
(5.0)
7.00
6.50
(10.0)
6.00
(15.0)
5.50
(20.0)
5.00
4.50
(25.0)
4.00
(30.0)
3.50
(35.0)
3.00
Source: Bloomberg, Angel Research
Source: RBI, Angel Research
Market Outlook
May 30, 2016
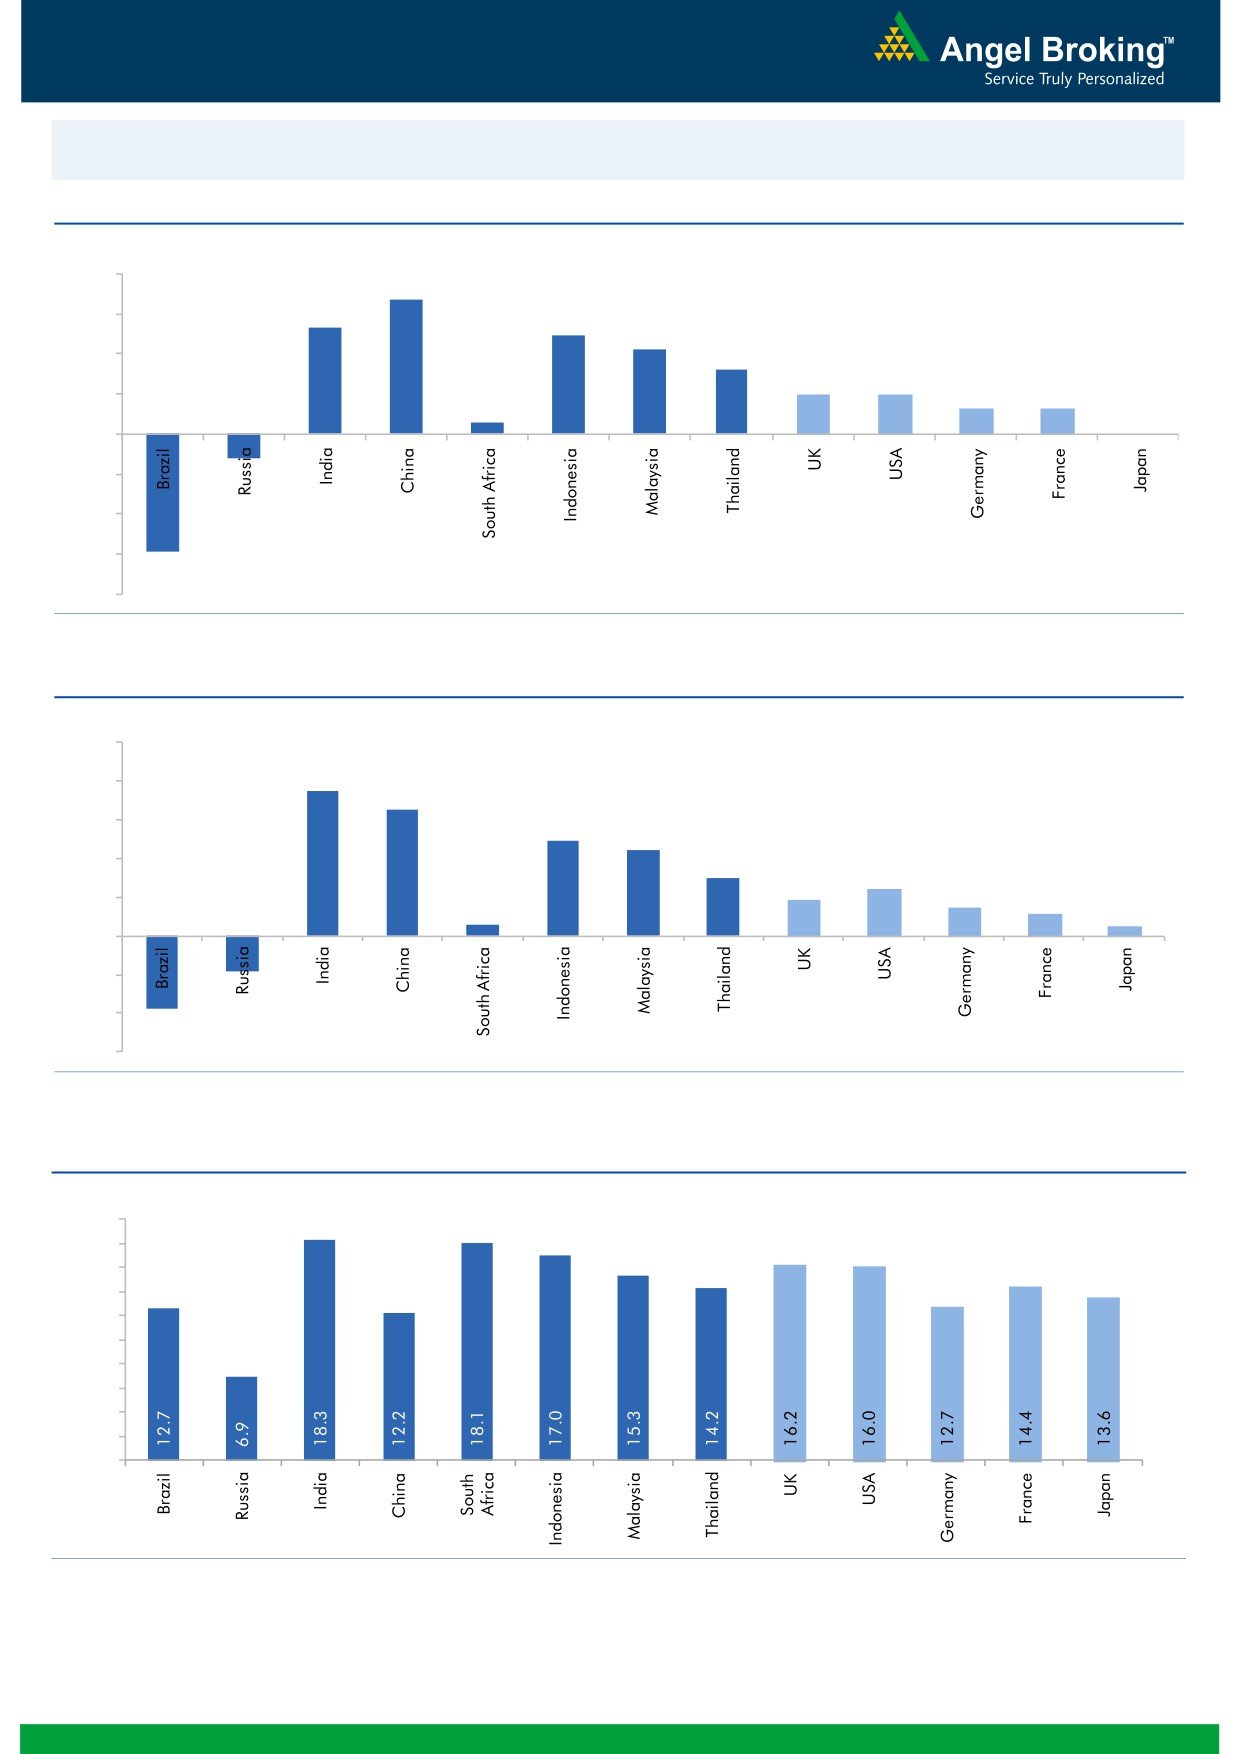
Global watch
Exhibit 1: Latest quarterly GDP Growth (%, yoy) across select developing and developed countries
(%)
8.0
6.7
6.0
5.3
4.9
4.2
4.0
3.2
2.0
2.0
2.0
1.3
1.3
0.6
-
-
(2.0)
(4.0)
(1.2)
(6.0)
(5.9)
(8.0)
Source: Bloomberg, Angel Research
Exhibit 2: 2016 GDP Growth projection by IMF (%, yoy) across select developing and developed countries
(%)
10.0
7.5
8.0
6.5
6.0
4.9
4.4
4.0
3.0
2.4
1.9
1.5
2.0
1.1
0.6
0.5
(3.8)
(1.8)
-
(2.0)
(4.0)
(6.0)
Source: IMF, Angel Research
Exhibit 3: One year forward P-E ratio across select developing and developed countries
(x)
20.0
18.0
16.0
14.0
12.0
10.0
8.0
6.0
4.0
2.0
-
Source: IMF, Angel Research
Market Outlook
May 30, 2016
Exhibit 4: Relative performance of indices across globe
Returns (%)
Country
Name of index
Closing price
1M
3M
1YR
Brazil
Bovespa
49,051
(7.6)
16.6
(10.7)
Russia
Micex
1,928
(2.0)
5.8
16.1
India
Nifty
8,157
2.2
13.1
(3.6)
China
Shanghai Composite
2,821
(5.0)
1.4
(38.1)
South Africa
Top 40
48,070
3.2
10.0
2.5
Mexico
Mexbol
46,124
0.4
6.8
3.2
Indonesia
LQ45
826
(0.4)
2.0
(9.6)
Malaysia
KLCI
1,637
(3.3)
(1.6)
(8.4)
Thailand
SET 50
903
(0.7)
10.9
(9.8)
USA
Dow Jones
17,873
(0.9)
7.4
(0.9)
UK
FTSE
6,271
(0.2)
6.9
(9.5)
Japan
Nikkei
16,835
(3.0)
4.5
(15.9)
Germany
DAX
10,286
0.3
12.2
(9.2)
France
CAC
4,515
(1.0)
6.3
(8.3)
Source: Bloomberg, Angel Research
Stock Watch
May 30, 2016
Company Name
Reco
CMP
Target
Mkt Cap
Sales ( Čcr )
OPM(%)
EPS (Č)
PER(x)
P/BV(x)
RoE(%)
EV/Sales(x)
(Č)
Price ( Č)
( Č cr )
FY16E FY17E
FY16E
FY17E
FY16E
FY17E
FY16E
FY17E
FY16E
FY17E
FY16E
FY17E
FY16E
FY17E
Agri / Agri Chemical
Rallis
Neutral
205
-
3,994
1,612
1,911
13.3
13.3
7.4
9.5
27.8
21.6
4.5
4.0
16.7
18.4
2.5
2.1
United Phosphorus
Accumulate
595
684
25,498
13,083
15,176
18.5
18.5
31.5
37.4
18.9
15.9
3.8
3.1
21.4
21.4
2.1
1.8
Auto & Auto Ancillary
Ashok Leyland
Neutral
107
-
30,380
17,995
21,544
11.4
11.6
3.4
4.7
31.4
22.7
5.5
5.1
17.7
22.2
1.6
1.3
Bajaj Auto
Neutral
2,567
-
74,294
22,709
25,860
20.9
20.1
129.0
143.6
19.9
17.9
6.1
5.3
30.7
29.4
2.8
2.4
Bharat Forge
Buy
747
875
17,383
7,351
8,318
19.9
19.7
31.2
36.5
23.9
20.5
4.3
3.6
19.3
19.2
2.5
2.2
Eicher Motors
Accumulate
18,742
20,044
50,906
15,556
16,747
15.5
17.3
464.8
597.5
40.3
31.4
14.7
10.8
36.2
34.3
3.2
2.9
Gabriel India
Buy
86
101
1,228
1,415
1,544
8.7
9.0
4.6
5.4
18.6
15.8
3.4
3.0
18.1
18.9
0.8
0.8
Hero Motocorp
Neutral
3,003
-
59,971
28,244
30,532
15.5
15.9
156.7
168.5
19.2
17.8
7.7
6.5
39.9
36.4
2.0
1.8
Jamna Auto Industries Accumulate
147
160
1,172
1,281
1,473
11.2
11.5
7.6
9.2
19.3
16.0
4.9
4.0
25.4
25.2
1.0
0.8
L G Balakrishnan & Bros Neutral
475
-
746
1,254
1,394
11.6
11.8
35.9
41.7
13.3
11.4
1.8
1.6
13.5
13.8
0.7
0.6
Mahindra and Mahindra Neutral
1,335
-
82,925
38,416
42,904
13.7
13.9
54.8
63.4
24.4
21.1
3.8
3.3
15.4
15.8
1.8
1.6
Maruti
Neutral
4,141
-
125,102
57,865
68,104
16.4
16.7
176.3
225.5
23.5
18.4
4.6
3.9
19.4
21.2
1.9
1.6
Minda Industries
Neutral
1,179
-
1,871
2,523
2,890
8.7
9.0
55.0
65.4
21.4
18.0
4.1
3.4
19.3
18.7
0.8
0.7
Motherson Sumi
Accumulate
279
313
36,891
39,343
45,100
8.8
9.1
10.1
12.5
27.6
22.3
8.7
6.9
35.3
34.4
1.0
0.9
Rane Brake Lining
Buy
379
465
300
454
511
11.5
12.0
25.2
31.0
15.0
12.2
2.3
2.0
14.9
16.6
0.8
0.7
Setco Automotive
Neutral
32
-
427
594
741
12.7
13.7
1.7
3.2
18.8
10.0
2.0
1.7
10.4
16.9
1.2
1.0
Tata Motors
Neutral
404
-
116,499
259,686
273,957
13.0
13.4
25.9
29.5
15.6
13.7
2.0
1.8
8.0
9.0
0.6
0.6
TVS Motor
Accumulate
292
330
13,870
11,263
13,122
6.9
8.5
9.2
15.0
31.7
19.5
7.2
5.8
22.7
29.6
1.2
1.0
Amara Raja Batteries
Buy
862
1,076
14,716
4,892
5,871
17.4
17.6
28.8
37.1
29.9
23.2
7.0
5.6
23.4
24.1
3.0
2.4
Exide Industries
Neutral
157
-
13,358
6,950
7,784
14.4
14.8
6.6
7.3
23.8
21.5
3.0
2.7
12.6
12.8
1.6
1.5
Apollo Tyres
Buy
157
183
7,982
12,056
12,714
17.2
16.4
23.0
20.3
6.8
7.7
1.2
1.1
17.7
13.6
0.7
0.7
Ceat
Buy
927
1,119
3,751
6,041
6,597
14.1
13.7
99.5
111.9
9.3
8.3
1.8
1.5
19.6
18.5
0.8
0.7
JK Tyres
Neutral
83
-
1,885
7,446
7,669
15.2
14.0
19.6
18.4
4.2
4.5
1.1
0.9
25.2
19.5
0.7
0.6
Swaraj Engines
Neutral
1,100
-
1,366
552
630
14.2
14.7
44.6
54.1
24.7
20.3
5.7
5.2
23.2
25.6
2.3
2.0
Subros
Neutral
93
-
558
1,293
1,527
11.8
11.9
4.2
6.7
22.2
13.9
1.7
1.5
7.7
11.5
0.7
0.6
Indag Rubber
Neutral
192
-
505
283
329
17.0
17.2
13.0
15.4
14.9
12.5
3.2
2.7
21.8
21.6
1.5
1.2
Capital Goods
ACE
Neutral
41
-
401
660
839
4.7
8.2
1.0
3.9
40.5
10.4
1.3
1.1
3.2
11.3
0.8
0.6
BEML
Buy
855
1,157
3,560
3,277
4,006
6.0
8.9
36.2
64.3
23.6
13.3
1.6
1.5
5.7
11.7
1.2
0.9
Bharat Electronics
Buy
1,183
1,414
28,393
7,737
8,634
16.8
17.2
54.0
61.5
21.9
19.2
3.1
2.8
39.3
45.6
2.8
2.4
Stock Watch
May 30, 2016
Company Name
Reco
CMP
Target
Mkt Cap
Sales ( Čcr )
OPM(%)
EPS (Č)
PER(x)
P/BV(x)
RoE(%)
EV/Sales(x)
(Č)
Price ( Č)
( Č cr )
FY16E
FY17E
FY16E
FY17E
FY16E
FY17E
FY16E
FY17E
FY16E
FY17E
FY16E
FY17E
FY16E
FY17E
Capital Goods
Voltas
Buy
337
407
11,141
5,363
5,963
8.0
9.1
11.0
13.8
30.6
24.4
4.7
4.1
16.2
17.9
2.0
1.8
BGR Energy
Neutral
113
-
815
3,615
3,181
9.5
9.4
16.7
12.4
6.8
9.1
0.6
0.6
10.0
7.0
0.6
0.8
BHEL
Neutral
128
-
31,378
33,722
35,272
10.8
11.7
10.5
14.2
12.2
9.0
0.9
0.9
7.0
9.0
1.0
1.0
Blue Star
Accumulate
434
481
3,900
3,548
3,977
6.3
6.9
13.7
17.2
31.7
25.3
8.0
5.2
26.1
25.4
1.2
1.0
Crompton Greaves
Neutral
60
-
3,760
13,484
14,687
4.9
6.2
4.5
7.1
13.3
8.5
0.9
0.9
7.2
10.8
0.4
0.4
Greaves Cotton
Neutral
141
-
3,436
1,655
1,755
16.6
16.8
7.4
7.8
19.0
18.0
3.8
3.6
21.1
20.6
2.0
1.9
Inox Wind
Buy
224
286
4,975
4,406
5,605
15.5
15.7
20.4
24.8
11.0
9.0
2.5
1.9
27.9
25.9
1.3
1.0
KEC International
Neutral
140
-
3,593
8,791
9,716
6.1
6.8
5.4
8.2
25.9
17.0
2.6
2.4
10.0
14.0
0.6
0.6
Thermax
Neutral
750
-
8,932
6,413
7,525
7.4
8.5
30.5
39.3
24.6
19.1
3.8
3.3
15.0
17.0
1.4
1.1
VATech Wabag
Neutral
556
-
3,032
2,722
3,336
7.9
8.1
19.5
24.6
28.5
22.6
3.0
2.7
11.1
12.4
1.2
1.0
Cement
ACC
Neutral
1,522
-
28,569
13,151
14,757
16.4
18.3
63.9
83.4
23.8
18.3
3.1
2.8
13.3
16.1
2.0
1.7
Ambuja Cements
Neutral
229
-
35,601
11,564
12,556
19.4
20.7
8.9
10.1
25.8
22.7
3.2
3.1
12.8
13.8
2.7
2.5
HeidelbergCement
Neutral
96
-
2,186
1,772
1,926
13.3
15.4
1.0
3.0
96.5
32.2
2.4
2.3
2.6
7.9
1.8
1.6
India Cements
Neutral
92
-
2,825
4,216
4,840
18.0
19.5
4.0
9.9
23.0
9.3
0.9
0.9
4.0
9.5
1.0
0.8
JK Cement
Neutral
595
-
4,164
3,661
4,742
10.1
15.8
7.5
28.5
79.4
20.9
2.4
2.1
7.5
22.9
1.6
1.2
J K Lakshmi Cement
Neutral
346
-
4,068
2,947
3,616
16.7
19.9
11.5
27.2
30.1
12.7
2.9
2.5
9.8
20.8
1.8
1.4
Mangalam Cements
Neutral
248
-
661
1,053
1,347
10.5
13.3
8.4
26.0
29.5
9.5
1.2
1.2
4.3
12.5
1.0
0.7
Orient Cement
Neutral
155
-
3,170
1,854
2,524
21.2
22.2
7.7
11.1
20.1
13.9
2.9
2.5
13.3
15.7
2.4
1.7
Ramco Cements
Neutral
496
-
11,816
4,036
4,545
20.8
21.3
15.1
18.8
32.9
26.4
4.0
3.6
12.9
14.3
3.4
3.0
Shree Cement^
Neutral
13,224
-
46,070
7,150
8,742
26.7
28.6
228.0
345.5
58.0
38.3
8.5
7.2
15.7
20.3
6.2
5.0
UltraTech Cement
Neutral
3,246
-
89,083
24,669
29,265
18.2
20.6
82.0
120.0
39.6
27.1
4.3
3.7
11.3
14.7
3.7
3.1
Construction
ITNL
Buy
70
93
2,304
7,360
8,825
34.0
35.9
7.0
9.0
10.0
7.8
0.3
0.3
3.2
3.7
3.7
3.6
KNR Constructions
Accumulate
539
603
1,515
937
1,470
14.3
14.0
44.2
38.6
12.2
14.0
2.4
2.1
15.4
15.4
1.7
1.1
Larsen & Toubro
Neutral
1,475
-
137,404
58,870
65,708
8.3
10.3
42.0
53.0
35.1
27.8
2.4
2.2
8.8
11.2
2.6
2.3
Gujarat Pipavav Port
Neutral
162
-
7,839
629
684
51.0
52.2
6.4
5.9
25.3
27.5
3.3
3.1
15.9
12.7
12.1
10.9
MBL Infrastructures
Buy
133
285
550
2,313
2,797
12.2
14.6
19.0
20.0
7.0
6.6
0.7
0.7
11.3
10.6
0.9
0.8
Nagarjuna Const.
Neutral
72
-
4,014
7,892
8,842
8.8
9.1
3.0
5.3
24.1
13.6
1.2
1.1
5.0
8.5
0.7
0.6
PNC Infratech
Neutral
570
-
2,925
1,873
2,288
13.2
13.5
24.0
32.0
23.8
17.8
2.3
2.1
12.1
12.3
1.7
1.4
Simplex Infra
Neutral
270
-
1,335
5,955
6,829
10.3
10.5
16.0
31.0
16.9
8.7
0.9
0.8
5.3
9.9
0.7
0.6
Stock Watch
May 30, 2016
Company Name
Reco
CMP
Target
Mkt Cap
Sales ( Čcr )
OPM(%)
EPS (Č)
PER(x)
P/BV(x)
RoE(%)
EV/Sales(x)
(Č)
Price ( Č)
( Č cr )
FY16E
FY17E
FY16E
FY17E
FY16E
FY17E
FY16E
FY17E
FY16E
FY17E
FY16E
FY17E
FY16E
FY17E
Construction
Power Mech Projects
Neutral
600
-
882
1,539
1,801
12.8
12.7
59.0
72.1
10.2
8.3
1.5
1.3
18.6
16.8
0.6
0.5
Sadbhav Engineering
Accumulate
276
298
4,741
3,186
3,598
10.2
10.3
8.0
9.0
34.6
30.7
3.2
2.8
9.4
9.9
1.8
1.6
NBCC
Buy
952
1,098
11,423
5,816
7,382
6.9
7.7
29.6
39.8
32.2
23.9
5.8
4.6
24.1
26.7
1.7
1.3
MEP Infra
Neutral
41
-
667
1,956
1,876
28.1
30.5
1.3
3.0
31.6
13.7
6.6
4.5
21.2
32.8
1.8
1.7
SIPL
Neutral
100
-
3,520
675
1,042
62.4
64.7
-
-
3.7
4.3
-
-
16.9
11.4
Engineers India
Neutral
180
-
6,080
1,667
1,725
13.5
16.0
9.7
11.4
18.6
15.8
2.2
2.1
11.7
13.4
2.4
2.5
Financials
Allahabad Bank
Neutral
53
-
3,235
8,569
9,392
2.8
2.9
16.3
27.5
3.2
1.9
0.3
0.2
7.6
11.9
-
-
Axis Bank
Neutral
513
-
122,360
26,204
29,738
3.6
3.5
34.5
35.4
14.9
14.5
2.3
2.1
16.8
14.9
-
-
Bank of Baroda
Neutral
139
-
31,959
18,802
21,088
2.0
2.2
(7.4)
13.0
10.7
1.1
0.9
(4.2)
7.3
-
-
Bank of India
Neutral
87
-
8,135
15,972
17,271
1.9
2.0
15.3
33.4
5.7
2.6
0.3
0.2
3.6
7.6
-
-
Canara Bank
Neutral
193
-
10,474
15,441
16,945
2.0
2.1
46.6
70.4
4.1
2.7
0.4
0.3
8.0
11.2
-
-
Dena Bank
Neutral
30
-
1,967
3,440
3,840
2.1
2.3
7.3
10.0
4.1
2.9
0.3
0.3
6.1
7.9
-
-
Dewan Housing Finance Buy
198
270
5,763
1,828
2,225
2.9
3.0
24.9
29.7
7.9
6.7
1.2
1.1
15.1
16.1
-
-
Federal Bank
Neutral
53
-
9,063
3,279
3,787
2.8
2.9
3.9
5.5
13.4
9.5
1.1
1.0
8.4
10.8
-
-
HDFC
Neutral
1,257
-
198,633
10,358
11,852
3.3
3.3
41.1
47.0
30.6
26.7
5.8
5.3
24.7
24.9
-
-
HDFC Bank
Accumulate
1,187
1,262
300,309
38,606
47,696
4.4
4.5
48.8
61.4
24.3
19.4
4.1
3.6
18.7
20.0
-
-
ICICI Bank
Neutral
243
-
141,317
34,279
39,262
3.3
3.3
21.0
24.4
11.6
10.0
2.0
1.7
14.4
14.7
-
-
IDBI Bank
Neutral
68
-
13,897
9,625
10,455
1.8
1.8
8.5
14.2
7.9
4.8
0.5
0.4
5.9
9.3
-
-
Indian Bank
Neutral
92
-
4,435
6,160
6,858
2.5
2.5
24.5
29.8
3.8
3.1
0.3
0.3
7.7
8.6
-
-
LIC Housing Finance
Buy
462
592
23,308
3,179
3,758
2.6
2.6
32.9
40.6
14.0
11.4
2.6
2.2
19.6
20.7
-
-
Oriental Bank
Neutral
85
-
2,932
7,643
8,373
2.4
2.4
37.2
45.4
2.3
1.9
0.2
0.2
8.2
9.4
-
-
Punjab Natl.Bank
Neutral
77
-
15,051
23,122
26,022
2.8
2.8
7.0
21.6
11.0
3.6
0.6
0.5
3.4
10.0
-
-
South Ind.Bank
Neutral
19
-
2,593
1,965
2,185
2.5
2.5
2.5
3.3
7.7
5.8
0.8
0.7
9.5
11.7
-
-
St Bk of India
Neutral
196
-
151,801
79,958
86,061
2.6
2.6
13.4
20.7
14.6
9.5
1.2
1.1
11.5
12.8
-
-
Union Bank
Neutral
115
-
7,888
12,646
14,129
2.3
2.4
31.0
39.1
3.7
2.9
0.4
0.3
9.8
11.4
-
-
Vijaya Bank
Neutral
31
-
2,858
3,536
3,827
1.9
1.9
5.5
6.7
5.5
4.6
0.5
0.4
7.8
8.8
-
-
Yes Bank
Neutral
1,027
-
43,206
7,190
9,011
3.2
3.3
58.2
69.7
17.6
14.7
3.2
2.7
19.2
19.6
-
-
FMCG
Asian Paints
Neutral
998
-
95,733
16,553
19,160
16.0
16.2
17.7
21.5
56.5
46.4
15.0
13.5
29.4
31.2
5.6
4.8
Britannia
Neutral
2,719
-
32,621
8,481
9,795
14.0
14.1
65.5
78.3
41.5
34.7
19.7
16.1
38.3
41.2
3.8
3.3
Stock Watch
May 30, 2016
Company Name
Reco
CMP
Target
Mkt Cap
Sales ( Čcr )
OPM(%)
EPS (Č)
PER(x)
P/BV(x)
RoE(%)
EV/Sales(x)
(Č)
Price ( Č)
( Č cr )
FY16E FY17E
FY16E
FY17E
FY16E
FY17E
FY16E
FY17E
FY16E
FY17E
FY16E
FY17E
FY16E
FY17E
FMCG
Colgate
Neutral
841
-
22,878
4,136
4,632
22.5
23.3
22.2
25.3
37.9
33.3
23.1
20.5
68.6
67.5
5.4
4.8
Dabur India
Neutral
296
-
52,071
9,370
10,265
17.6
17.3
7.3
8.1
40.4
36.5
10.5
9.6
31.7
30.6
5.4
4.9
GlaxoSmith Con*
Neutral
5,898
-
24,806
4,519
5,142
19.6
19.8
164.3
191.2
35.9
30.9
9.9
8.5
30.8
29.9
4.9
4.3
Godrej Consumer
Neutral
1,521
-
51,783
9,003
10,335
18.1
18.7
34.1
41.8
44.6
36.4
9.6
8.3
23.9
24.8
5.9
5.1
HUL
Neutral
862
-
186,434
33,299
35,497
17.1
17.1
18.9
20.0
45.6
43.1
23.1
26.5
87.6
80.8
5.4
5.1
ITC
Neutral
359
-
289,257
36,804
38,776
37.9
37.9
12.2
12.9
29.5
27.9
8.2
7.2
27.7
25.8
7.4
7.1
Marico
Neutral
257
-
33,196
6,151
6,966
17.2
17.3
5.4
6.4
47.7
40.2
15.0
11.8
33.2
32.4
5.3
4.7
Nestle*
Neutral
6,170
-
59,488
9,393
10,507
22.2
22.3
106.8
121.8
57.8
50.7
20.3
18.3
34.8
36.7
6.1
5.5
Tata Global
Buy
117
137
7,403
8,635
9,072
9.8
9.9
5.8
7.2
20.2
16.3
1.8
1.7
6.8
7.4
0.9
0.8
Procter & Gamble
Buy
6,290
7,369
20,416
2,588
2,939
23.3
23.2
130.2
146.2
48.3
43.0
96.3
92.4
27.6
25.3
7.5
6.5
Hygiene
IT
HCL Tech^
Buy
755
1,000
106,448
37,061
30,781
21.5
20.5
51.4
40.0
14.7
18.9
3.8
2.8
20.1
20.3
2.6
2.8
Infosys
Accumulate
1,246
1,374
286,291
62,441
70,558
27.5
27.5
59.0
65.3
21.1
19.1
4.2
3.9
22.2
22.4
4.0
3.5
TCS
Buy
2,572
3,004
506,804
108,646
122,770
28.3
28.3
123.7
141.0
20.8
18.2
6.9
6.3
33.1
34.6
4.2
3.6
Tech Mahindra
Neutral
536
-
51,979
26,524
29,177
16.2
17.0
28.8
33.6
18.6
15.9
3.6
3.1
19.3
19.1
1.7
1.5
Wipro
Buy
546
680
134,876
50,808
56,189
23.7
23.8
37.3
40.7
14.6
13.4
2.8
2.5
19.2
17.7
2.1
1.8
Media
D B Corp
Neutral
348
-
6,397
2,025
2,187
27.4
27.4
17.4
18.9
20.0
18.5
4.5
4.1
22.9
23.7
3.1
2.9
HT Media
Neutral
82
-
1,904
2,495
2,673
12.9
13.2
6.8
7.2
12.0
11.4
0.9
0.9
7.5
7.8
0.4
0.3
Jagran Prakashan
Buy
174
205
5,678
2,170
2,355
27.2
26.2
8.9
9.9
19.5
17.6
4.1
3.6
20.9
20.5
2.5
2.3
Sun TV Network
Neutral
382
-
15,034
2,510
2,763
71.8
71.5
21.9
24.8
17.4
15.4
4.1
3.7
22.8
24.3
5.5
4.9
Hindustan Media
Neutral
269
-
1,977
914
1,016
21.7
21.5
21.9
23.3
12.3
11.6
2.2
1.9
18.0
16.2
1.6
1.4
Ventures
Metals & Mining
Coal India
Buy
281
380
177,711
76,167
84,130
19.9
22.3
22.4
25.8
12.6
10.9
4.5
4.4
35.5
41.0
1.7
1.5
Hind. Zinc
Neutral
169
-
71,239
14,641
14,026
50.4
50.4
17.7
16.0
9.6
10.5
1.5
1.3
16.2
13.2
2.5
2.3
Hindalco
Neutral
92
-
18,967
104,356
111,186
8.7
9.5
6.7
11.1
13.7
8.3
0.5
0.5
3.5
5.9
0.7
0.6
JSW Steel
Neutral
1,372
-
33,158
42,308
45,147
16.4
20.7
(10.3)
49.5
27.7
1.5
1.5
(1.0)
5.6
1.8
1.7
NMDC
Neutral
93
-
36,674
8,237
10,893
46.6
44.5
10.0
11.7
9.3
7.9
1.0
0.9
12.5
13.0
4.2
3.2
SAIL
Neutral
43
-
17,615
45,915
53,954
7.2
10.5
1.5
4.4
28.3
9.7
0.4
0.4
2.3
4.1
1.0
0.9
Vedanta
Neutral
103
-
30,477
71,445
81,910
26.2
26.3
12.9
19.2
8.0
5.4
0.6
0.5
7.2
8.9
0.9
0.7
Tata Steel
Neutral
329
-
31,953
126,760
137,307
8.9
11.3
6.4
23.1
51.7
14.3
1.0
1.0
2.0
7.1
0.8
0.8
Oil & Gas
Cairn India
Neutral
138
-
25,948
11,323
12,490
49.4
51.0
20.7
20.7
6.7
6.7
0.4
0.4
6.4
6.1
1.4
0.7
Stock Watch
May 30, 2016
Company Name
Reco
CMP
Target
Mkt Cap
Sales ( Čcr )
OPM(%)
EPS (Č)
PER(x)
P/BV(x)
RoE(%)
EV/Sales(x)
(Č)
Price ( Č)
( Č cr )
FY16E FY17E
FY16E
FY17E
FY16E
FY17E
FY16E
FY17E
FY16E
FY17E
FY16E
FY17E
FY16E
FY17E
Oil & Gas
GAIL
Neutral
379
-
48,126
64,856
70,933
9.1
9.6
24.0
28.9
15.8
13.1
1.4
1.3
8.8
9.6
0.9
0.8
ONGC
Neutral
213
-
182,360
154,564
145,998
36.8
37.4
20.8
22.6
10.3
9.4
1.0
0.9
10.1
9.7
1.4
1.5
Petronet LNG
Neutral
273
-
20,438
29,691
31,188
5.8
6.2
12.8
13.4
21.3
20.3
3.2
2.8
15.8
14.8
0.8
0.7
Indian Oil Corp
Accumulate
413
455
100,262
359,607
402,760
5.9
6.1
42.5
48.7
9.7
8.5
1.3
1.2
14.1
14.4
0.4
0.3
Reliance Industries
Buy
973
1,150
315,264
304,775
344,392
12.6
13.4
91.3
102.6
10.7
9.5
1.2
1.1
11.8
12.0
1.0
0.8
Pharmaceuticals
Alembic Pharma
Neutral
543
-
10,244
3,274
3,802
26.9
19.4
35.0
28.7
15.5
18.9
6.9
5.2
55.6
31.2
3.1
2.6
Aurobindo Pharma
Accumulate
764
856
44,704
14,923
17,162
22.0
23.0
35.7
42.8
21.4
17.9
6.3
4.7
34.0
30.2
3.4
2.9
Aventis*
Accumulate
4,223
4,738
9,726
2,049
2,375
15.4
17.3
115.4
153.5
36.6
27.5
6.0
4.7
19.3
25.8
4.5
3.8
Cadila Healthcare
Buy
327
400
33,512
9,469
11,246
21.2
22.0
14.9
17.1
22.0
19.1
6.3
4.9
28.8
26.6
3.5
2.9
Cipla
Buy
474
605
38,052
13,979
16,447
20.2
18.6
25.7
27.5
18.4
17.2
3.0
2.6
17.6
16.1
2.7
2.2
Dr Reddy's
Accumulate
3,113
3,476
53,082
15,471
17,479
24.6
24.6
138.2
152.4
22.5
20.4
4.1
3.5
19.7
18.7
3.4
3.0
Dishman Pharma
Neutral
154
-
2,478
1,733
1,906
21.5
21.5
10.1
10.0
15.2
15.4
1.8
1.6
10.5
11.2
1.9
1.7
GSK Pharma*
Neutral
3,499
-
29,637
2,870
3,158
20.0
22.1
59.5
68.3
58.8
51.2
17.4
17.8
28.5
34.3
9.8
9.0
Indoco Remedies
Neutral
290
-
2,674
1,033
1,199
15.9
18.2
9.4
13.6
30.9
21.3
4.6
3.9
15.7
19.7
2.7
2.3
Ipca labs
Buy
436
750
5,500
3,363
3,909
12.9
18.6
13.4
28.0
32.5
15.6
2.3
2.0
7.4
14.0
1.9
1.7
Lupin
Buy
1,481
1,809
66,735
13,702
15,912
23.7
26.4
50.5
58.1
29.3
25.5
6.1
5.0
22.9
21.4
5.3
4.2
Sun Pharma
Buy
826
950
198,673
28,163
32,610
25.8
30.7
17.4
26.9
47.4
30.7
4.5
3.9
13.0
16.6
6.5
5.4
Power
Tata Power
Neutral
73
-
19,636
35,923
37,402
22.6
22.8
4.1
5.2
17.9
14.1
1.4
1.3
7.5
9.3
1.5
1.4
NTPC
Neutral
140
-
115,354
87,271
99,297
23.5
23.5
11.8
13.3
11.9
10.5
1.3
1.2
11.5
12.2
2.3
2.1
Power Grid
Accumulate
151
170
78,840
20,702
23,361
86.7
86.4
12.1
13.2
12.5
11.4
1.8
1.6
15.6
15.1
8.7
8.1
Real Estate
MLIFE
Buy
440
554
1,807
826
1,133
20.1
21.8
22.6
30.7
19.5
14.3
1.2
1.1
6.0
7.4
4.1
2.8
Telecom
Bharti Airtel
Neutral
353
-
141,108
101,748
109,191
32.1
31.7
12.0
12.5
29.4
28.2
2.0
1.9
6.9
6.7
2.0
1.8
Idea Cellular
Neutral
113
-
40,776
34,282
36,941
32.0
31.5
5.9
6.2
19.2
18.3
1.8
1.6
9.9
9.3
1.8
1.7
zOthers
Abbott India
Neutral
4,751
-
10,094
2,715
3,153
14.5
14.1
134.3
152.2
35.4
31.2
8.8
7.3
27.4
25.6
3.4
2.9
Bajaj Electricals
Neutral
254
-
2,565
4,719
5,287
5.2
5.8
8.6
12.7
29.7
20.1
3.4
3.0
11.4
14.8
0.5
0.5
Finolex Cables
Neutral
334
-
5,109
2,520
2,883
12.2
12.0
12.7
14.2
26.4
23.5
3.6
3.2
13.6
13.5
1.8
1.5
Goodyear India*
Buy
504
582
1,163
1,800
1,600
11.7
11.5
58.7
52.9
8.6
9.5
1.9
1.7
24.6
18.7
0.4
0.4
Hitachi
Neutral
1,356
-
3,686
1,779
2,081
7.8
8.8
21.8
33.4
62.2
40.6
10.0
8.1
17.4
22.1
2.1
1.8
Jyothy Laboratories
Neutral
290
-
5,260
1,620
1,847
11.5
11.5
7.3
8.5
39.8
34.3
5.2
4.8
13.3
14.4
3.1
2.7
Stock Watch
May 30, 2016
Company Name
Reco
CMP
Target
Mkt Cap
Sales ( Čcr )
OPM(%)
EPS (Č)
PER(x)
P/BV(x)
RoE(%)
EV/Sales(x)
(Č)
Price ( Č)
( Č cr )
FY16E
FY17E
FY16E
FY17E
FY16E
FY17E
FY16E
FY17E
FY16E
FY17E
FY16E
FY17E
FY16E
FY17E
zOthers
MRF
Buy
33,586
45,575
14,244
20,316
14,488
21.4
21.1
5,488.0
3,798.0
6.1
8.8
2.1
1.7
41.1
21.2
0.7
0.9
Page Industries
Neutral
13,448
-
15,000
1,929
2,450
19.8
20.1
229.9
299.0
58.5
45.0
25.8
17.9
52.1
47.1
7.8
6.1
Relaxo Footwears
Neutral
445
-
5,341
1,767
2,152
12.3
12.5
19.3
25.1
23.1
17.8
5.7
4.4
27.7
27.8
3.1
2.5
Siyaram Silk Mills
Buy
1,048
1,354
983
1,636
1,815
11.5
11.5
89.9
104.1
11.7
10.1
1.9
1.7
17.9
17.8
0.8
0.7
Styrolution ABS India* Neutral
599
-
1,054
1,271
1,440
8.6
9.2
32.0
41.1
18.7
14.6
1.9
1.7
10.7
12.4
0.8
0.7
TVS Srichakra
Buy
2,369
2,932
1,814
2,035
2,252
15.9
15.3
248.6
268.1
9.5
8.8
4.2
3.0
43.6
33.9
0.9
0.8
HSIL
Accumulate
289
310
2,089
2,123
2,384
16.1
16.5
15.0
18.9
19.2
15.3
1.5
1.4
8.0
9.4
1.3
1.2
Kirloskar Engines India
Neutral
239
-
3,458
2,403
2,554
8.6
9.9
9.2
10.5
26.0
22.8
2.5
2.4
9.7
10.7
1.1
1.0
Ltd
M M Forgings
Buy
458
546
552
511
615
21.7
21.6
43.1
55.8
10.6
8.2
1.9
1.6
19.9
21.2
1.3
1.0
Banco Products (India) Neutral
134
-
958
1,208
1,353
11.0
12.3
10.8
14.5
12.4
9.3
1.4
1.3
11.9
14.5
0.8
0.7
Competent Automobiles Neutral
145
-
89
1,040
1,137
3.2
3.1
25.7
28.0
5.6
5.2
0.8
0.7
15.0
14.3
0.1
0.1
Nilkamal
Neutral
1,209
-
1,804
1,871
2,031
10.7
10.5
63.2
69.8
19.1
17.3
3.1
2.7
17.6
16.6
1.0
0.9
Visaka Industries
Buy
138
162
220
1,020
1,120
8.7
9.1
13.9
20.1
9.9
6.9
0.6
0.6
6.4
8.7
0.4
0.4
Transport Corporation of
Neutral
277
-
2,105
2,830
3,350
8.8
9.0
14.4
18.3
19.3
15.1
3.0
2.6
15.4
17.1
0.9
0.8
India
Elecon Engineering
Neutral
58
-
636
1,359
1,482
10.3
13.7
0.8
3.9
72.7
15.0
1.2
1.1
1.6
7.8
0.8
0.7
Surya Roshni
Buy
158
201
691
2,992
3,223
8.1
8.4
14.7
18.3
10.7
8.6
1.0
0.9
9.7
11.0
0.5
0.5
MT Educare
Neutral
180
-
716
286
366
18.3
17.7
7.7
9.4
23.3
19.2
4.9
4.3
20.2
21.1
2.4
1.8
Radico Khaitan
Buy
85
125
1,129
1,543
1,659
12.6
13.0
5.8
6.3
14.7
13.4
1.3
1.2
8.5
8.6
1.2
1.1
Garware Wall Ropes
Buy
362
473
793
862
974
11.2
11.2
24.9
29.6
14.6
12.3
2.2
1.9
15.1
15.4
0.9
0.8
Wonderla Holidays
Neutral
380
-
2,146
206
308
44.0
43.6
9.0
12.9
42.2
29.4
5.8
5.2
13.7
17.8
10.3
6.9
Linc Pen & Plastics
Neutral
205
-
303
340
371
8.3
8.9
10.8
13.2
19.0
15.5
3.0
2.6
16.0
17.1
0.9
0.8
The Byke Hospitality
Neutral
173
-
692
222
287
20.5
20.5
5.6
7.6
30.6
22.9
5.8
4.7
18.9
20.8
3.2
2.4
Interglobe Aviation
Neutral
1,030
-
37,122
17,022
21,122
20.7
14.5
63.9
53.7
16.1
19.2
24.2
19.8
149.9
103.2
2.2
1.8
Coffee Day Enterprises
Neutral
254
-
5,242
2,692
2,964
17.0
18.6
-
4.7
-
53.7
3.1
2.9
0.2
5.5
2.3
2.2
Ltd
Navneet Education
Neutral
89
-
2,124
998
1,062
24.1
24.0
5.8
6.1
15.5
14.6
3.4
3.0
22.0
20.6
2.2
2.1
Navkar Corporation
Buy
191
265
2,720
365
436
38.3
37.5
5.6
5.9
33.8
32.4
2.1
2.0
6.3
6.1
8.3
7.1
UFO Moviez
Neutral
530
-
1,464
558
619
32.0
33.2
22.5
30.0
23.6
17.7
2.8
2.5
12.0
13.8
2.5
2.1
VRL Logistics
Neutral
277
-
2,526
1,725
1,902
16.5
16.7
12.2
14.6
22.7
19.0
4.7
4.2
20.8
21.9
1.6
1.4
Team Lease Serv.
Neutral
940
-
1,607
2,565
3,229
1.3
1.5
15.2
22.8
61.9
41.3
5.0
4.4
8.0
10.7
0.5
0.4
Stock Watch
May 30, 2016
Company Name
Reco
CMP
Target Mkt Cap
Sales ( Čcr )
OPM(%)
EPS (Č)
PER(x)
P/BV(x)
RoE(%)
EV/Sales(x)
(Č)
Price ( Č)
( Č cr )
FY16E FY17E FY16E FY17E FY16E FY17E FY16E FY17E FY16E FY17E FY16E FY17E FY16E FY17E
zOthers
S H Kelkar & Co.
Neutral
221
-
3,195
928
1,036
15.3
15.1
4.9
6.1
44.8
36.2
4.2
3.9
9.4
10.7
3.3
3.0
Quick Heal
Neutral
233
-
1,632
339
408
27.8
27.3
7.1
7.7
33.0
30.1
2.8
2.8
8.5
9.3
3.7
3.1
Narayana Hrudaya
Neutral
306
-
6,244
1,603
1,873
10.9
11.5
1.0
2.6
320.7
115.5
7.7
7.1
2.4
6.1
4.0
3.4
Manpasand Bever.
Neutral
543
-
2,717
540
836
19.9
19.6
10.2
16.9
53.0
32.1
4.3
3.9
8.1
12.0
4.7
3.0
Source: Company, Angel Research; Note: *December year end; #September year end; &October year end; Price as on May 27, 2016
Market Outlook
May 30, 2016
Research Team Tel: 022 - 39357800
DISCLAIMER
Angel Broking Private Limited (hereinafter referred to as “Angel”) is a registered Member of National Stock Exchange of India Limited,
Bombay Stock Exchange Limited and Metropolitian Stock Exchange of India Limited. It is also registered as a Depository Participant with
CDSL and Portfolio Manager with SEBI. It also has registration with AMFI as a Mutual Fund Distributor. Angel Broking Private Limited is a
registered entity with SEBI for Research Analyst in terms of SEBI (Research Analyst) Regulations, 2014 vide registration number
INH000000164. Angel or its associates has not been debarred/ suspended by SEBI or any other regulatory authority for accessing
/dealing in securities Market. Angel or its associates including its relatives/analyst do not hold any financial interest/beneficial ownership
of more than 1% in the company covered by Analyst. Angel or its associates/analyst has not received any compensation / managed or co
-managed public offering of securities of the company covered by Analyst during the past twelve months. Angel/analyst has not served as
an officer, director or employee of company covered by Analyst and has not been engaged in market making activity of the company
covered by Analyst.
This document is solely for the personal information of the recipient, and must not be singularly used as the basis of any investment
decision. Nothing in this document should be construed as investment or financial advice. Each recipient of this document should make
such investigations as they deem necessary to arrive at an independent evaluation of an investment in the securities of the companies
referred to in this document (including the merits and risks involved), and should consult their own advisors to determine the merits and
risks of such an investment.
Reports based on technical and derivative analysis center on studying charts of a stock's price movement, outstanding positions and
trading volume, as opposed to focusing on a company's fundamentals and, as such, may not match with a report on a company's
fundamentals.
The information in this document has been printed on the basis of publicly available information, internal data and other reliable sources
believed to be true, but we do not represent that it is accurate or complete and it should not be relied on as such, as this document is for
general guidance only. Angel Broking Pvt. Limited or any of its affiliates/ group companies shall not be in any way responsible for any
loss or damage that may arise to any person from any inadvertent error in the information contained in this report. Angel Broking Pvt.
Limited has not independently verified all the information contained within this document. Accordingly, we cannot testify, nor make any
representation or warranty, express or implied, to the accuracy, contents or data contained within this document. While Angel Broking
Pvt. Limited endeavors to update on a reasonable basis the information discussed in this material, there may be regulatory, compliance,
or other reasons that prevent us from doing so.
This document is being supplied to you solely for your information, and its contents, information or data may not be reproduced,
redistributed or passed on, directly or indirectly.
Neither Angel Broking Pvt. Limited, nor its directors, employees or affiliates shall be liable for any loss or damage that may arise from or
in connection with the use of this information.
Note: Please refer to the important ‘Stock Holding Disclosure' report on the Angel website (Research Section). Also, please refer to the
latest update on respective stocks for the disclosure status in respect of those stocks. Angel Broking Pvt. Limited and its affiliates may have
investment positions in the stocks recommended in this report.