Market Outlook
December 29, 2015
Market Cues
Domestic Indices
Chg (%)
(Pts)
(Close)
Indian markets are expected to open marginally positive tracking the SGX Nifty and
BSE Sensex
0.8
195
26,034
its Asian peers.
Nifty
0.8
64
7,925
US stocks recovered to close marginally in the red after a weak opening, as traders
Mid Cap
0.1
16
11,034
booked profits after strong gains posted last week. Trading volumes however
Small Cap
0.5
55
11,785
remained low led by the year end holiday season.
Bankex
0.9
177
19,384
European markets also closed marginally lower as markets opened after the
Christmas weekend. This will be a curtailed week as FTSE of the UK remained shut
Global Indices
Chg (%)
(Pts)
(Close)
yesterday on account of boxing day, while markets would be shut on New Year day
on Friday, resulting in curtailed volumes. Weakness in commodity prices, especially
Dow Jones
(0.1)
(24)
17,528
in crude oil, weighed on investor sentiment today, in the absence of any major
Nasdaq
(0.2)
(8)
5,041
economic data. The drop in the Chinese stock market also contributed to the
FTSE
0.2
14
6,255
negative mood.
Nikkei
0.6
104
18,873
Indian shares ended slightly higher despite weak global cues and low FII volumes.
Hang Seng
(1.0)
(219)
21,920
The broader markets however traded on a flat note. Healthcare and utility stocks
Shanghai Com
(2.6)
(94)
3,534
rose sharply, while telecom and metal stocks took a beating.
Advances / Declines
BSE
NSE
News & Result Analysis
Lupin gets FDA approval for generic Femhrt tablets
Advances
1,533
875
Bombay High Court asks Vedanta, Cairn India to explain merger
Declines
1,177
677
Detailed analysis on Pg2
Unchanged
255
67
Investor’s Ready Reckoner
Volumes (` Cr)
Key Domestic & Global Indicators
BSE
2,610
Stock Watch: Latest investment recommendations on 150+ stocks
NSE
14,251
Refer P4 onwards
Top Picks
Net Inflows (` Cr)
Net
Mtd
Ytd
CMP
Target
Upside
Company
Sector
Rating
(`)
(`)
(%)
FII
498
(1,533)
16,589
Axis Bank
Financials
Buy
454
630
38.6
MFs
162
2,766
66,280
HCL Tech
IT
Buy
865
1,132
30.9
ICICI Bank
Financials
Buy
264
354
34.0
Top Gainers
Price (`)
Chg (%)
Ashok Leyland
Automobiles
Buy
89
111
24.9
Tubeinvest
447
11.6
Larsen & Toubro
Construction
Buy
1,294
1,646
27.2
Network18
62
9.9
More Top Picks on Pg3
Kscl
369
6.7
Key Upcoming Events
Ttkprestig
4,439
5.9
Previous
Consensus
Date
Region
Event Description
Bharatforg
902
4.9
Reading
Expectations
Dec 29
USA
Initial Jobless claims - Dec19 (in thousands)
271
270
Jan 1
China
PMI Manufacturing
49.6
49.8
Top Losers
Price (`)
Chg (%)
Jan 8
India
Imports YoY% - Dec (% change)
(30.26)
-
Tatasteel
254
(3.6)
Jan 8
India
Exports YoY% - Dec (% change)
(24.43)
-
Jswsteel
1,030
(3.2)
Eclerx
1,450
(2.5)
Indhotel
115
(2.3)
Bhartiartl
331
(2.1)
As on December 28, 2015
Market Outlook
December 29, 2015
Lupin gets FDA approval for generic Femhrt tablets
Lupin has received US health regulator's final approval to market Fyavolv tablets,
used to treat postmenopausal osteoporosis, in the American market. Lupin's US
subsidiary, Lupin Pharmaceuticals Inc shall commence promoting the product in
the US shortly, Lupin said in a statement. The company's product is the generic
equivalent of Warner Chilcott's Femhrt tablets, which are indicated for the
treatment of moderate to severe vasomotor symptoms due to menopause and
prevention of postmenopausal osteoporosis. According to IMS MAT September
data, Femhrt had US sales of USD 39.9 million. The Mumbai-based firm has
launched eight products in the US this fiscal and received approvals for 19 from
the FDA. The company's cumulative abbreviated new drug application (ANDA)
filings with the USFDA stood at over 220 with the company having received 131
approvals to date. We retain our Neutral view on the stock.
Bombay High Court asks Vedanta, Cairn India to explain merger
The Bombay High Court has issued notices to Vedanta, its unit Cairn Indiaand
their directors seeking response to a shareholder's petition alleging that Vedanta
used a complex web of transactions to make sure that part of the money spent to
take over Cairn India came from the acquired company itself. The petition alleged
that these transactions violated rules under the Companies Act, and has asked the
court to cancel the approval to merge Cairn India with Vedanta. The court has
sought replies from the companies and their directors by January 5 and rejoinders,
if any, by January 14.
The shareholder alleged that the transactions were against the interest of Cairn
India and its shareholders. The petition alleged that the promoters and directors
were involved in multiple transactions that were staggered over time to
camouflage them from shareholders. We maintain our Neutral view on Vedanta
and Cairn India.
Economic and Political News
Government in process of granting transmission connectivity to 20 power
plants
No LPG subsidy for consumers with taxable income of more than `10 lakh
from January 1
UP looking at `40,000cr investment in renewable energy
Tea exports up 4.2% to `2318.07cr in April-October period
Corporate News
Spice Jet to offer discounts on domestic routes
Sterlite lowest bidder for Odisha transmission project
MTNL to offer free incoming calls on roaming from Jan 1
Srikalahasthi Pipes bags `1,053cr orders
Market Outlook
December 29, 2015
Top PicksHHHHH
Large Cap
Market Cap
CMP
Target
Upside
Company
Rationale
(` Cr)
(`)
(`)
(%)
To outpace battery industry growth due to better technological
Amara Raja Batteries
14,702
861
1,040
20.8
products leading to market share gains in both the automotive
OEM and replacement segments.
Earnings to grow strongly given the MHCV cyclical upturn.
Ashok Leyland
25,300
89
111
24.9
Focus on exports and LCV's provides additional growth
avenue.
Healthy pace of branch expansion, backed by distribution
Axis Bank
1,08,032
454
630
38.6
network, will be the driving force for the bank’s retail business
and overall earnings.
The stock is trading at attractive valuations and is factoring all
HCL Tech
1,21,924
865
1,132
30.9
the bad news.
Strong visibility for a robust 20% earnings trajectory, coupled
HDFC Bank
2,71,487
1,076
1,262
17.3
with high quality of earnings on account of high quality retail
business and strategic focus on highly rated corporates.
Due to its robust franchise and capital adequacy position, the
bank is well positioned to grow by at least a few percentage
ICICI Bank
1,53,524
264
354
34.0
points higher than the average industry growth rate from a
structural point of view.
Back on the growth trend, expect a long term growth of 14%
Infosys
2,53,043
1,102
1,306
18.5
to be a US$20bn in FY2020.
Well positioned to benefit from such expected gradual
recovery in the overall domestic capex cycle, given its presence
Larsen & Toubro
1,20,504
1,294
1,646
27.2
across various infrastructure segments, its execution
capabilities, and its strong balance sheet.
LICHF continues to grow its retail loan book at a healthy pace
with improvement in asset quality. We expect the company to
LIC Housing Finance
24,554
487
571
17.3
post a healthy loan book which is likely to reflect in a strong
earnings growth.
Source: Company, Angel Research
Mid Cap
Market Cap
CMP
Target
Upside
Company
Rationale
(` Cr)
(`)
(`)
(%)
Favourable outlook for the AC industry to augur well for
Cooling products business which is out pacing the market
Blue Star
3,502
389
429
10.2
growth. EMPPAC division's profitability to improve once
operating environment turns around.
Change in business focus towards high-margin chronic &
Ipca labs
9,410
746
900
20.7
lifestyle segments and increasing penetration in Europe and
US
Economic recovery to have favourable impact on advertising &
circulation revenue growth. Further, the acquisition of a radio
Jagran Prakashan
5,195
159
169
6.4
business (Radio City) would also boost the company's revenue
growth.
Earnings boost on back of stable material prices and
Radico Khaitan
1,500
113
156
38.4
favourable pricing environment. Valuation discount to peers
provides additional comfort
Strong brands and distribution network would boost growth
Siyaram Silk Mills
1,119
1,193
1,354
13.5
going ahead. Stock currently trades at an inexpensive
valuation.
Structural shift in the Lighting industry towards LED lighting will
Surya Roshni
641
146
183
25.1
drive growth.
Source: Company, Angel Research
Market Outlook
December 29, 2015
Key Upcoming Events
Global economic events release calendar
Date
Time
Country
Event Description
Unit
Period
Bloomberg Data
Last Reported Estimated
Dec 29, 2015
8:30PM
US
Consumer Confidence
S.A./ 1985=100
Dec
90.40
93.80
Jan 1, 2016
6:30AM
China
PMI Manufacturing
Value
Dec
49.60
49.80
Jan 4, 2016
2:25PM
Germany
PMI Manufacturing
Value
Dec F
53.00
53.00
3:00PM
UK
PMI Manufacturing
Value
Dec
52.70
52.90
Jan 5, 2016
2:25PM
Germany
Unemployment change (000's)
Thousands
Dec
(13.00)
(8.00)
Jan 6, 2016
2:25PM
Germany
PMI Services
Value
Dec F
55.40
55.40
Jan 7, 2016
3:30PM
Euro Zone
Euro-Zone Consumer Confidence
Value
Dec F
(5.70)
(5.70)
Jan 8, 2016
India
Imports YoY%
% Change
Dec
(30.26)
--
India
Exports YoY%
% Change
Dec
(24.43)
--
7:00PM
US
Change in Nonfarm payrolls
Thousands
Dec
211.00
200.00
7:00PM
US
Unnemployment rate
%
Dec
5.00
5.00
Jan 12, 2016
5:30PM
India
Industrial Production YoY
% Change
Nov
9.80
--
3:00PM
UK
Industrial Production (YoY)
% Change
Nov
1.70
--
Jan 14, 2016
12:00PM
India
Monthly Wholesale Prices YoY%
% Change
Dec
(1.99)
--
5:30PM
UK
BOE Announces rates
% Ratio
Jan 14
0.50
0.50
Jan 15, 2016
7:45PM
US
Industrial Production
%
Dec
(0.56)
--
US
Producer Price Index (mom)
% Change
Dec
0.10
--
Jan 19, 2016
3:00PM
UK
CPI (YoY)
% Change
Dec
0.10
--
Jan 20, 2016
7:00PM
US
Housing Starts
Thousands
Dec
1,173.00
--
7:00PM
US
Building permits
Thousands
Dec
1,282.00
--
3:00PM
UK
Jobless claims change
% Change
Dec
3.90
--
7:00PM
US
Consumer price index (mom)
% Change
Dec
--
--
Jan 21, 2016
3:30PM
Euro Zone
Euro-Zone CPI (YoY)
%
Dec F
0.20
--
6:15PM
Euro Zone
ECB announces interest rates
%
Jan 21
0.05
--
Jan 22, 2016
8:30PM
US
Existing home sales
Million
Dec
4.76
--
Jan 27, 2016
8:30PM
US
New home sales
Thousands
Dec
490.00
--
Jan 28, 2016
3:00PM
UK
GDP (YoY)
% Change
4Q A
2.10
--
12:30AM
US
FOMC rate decision
%
Jan 27
0.50
0.50
Jan 29, 2016
7:00PM
US
GDP Qoq (Annualised)
% Change
4Q A
2.00
--
Feb 2, 2016
11:00AM
India
RBI Reverse Repo rate
%
Feb 2
5.75
--
11:00AM
India
RBI Repo rate
%
Feb 2
6.75
--
11:00AM
India
RBI Cash Reserve ratio
%
Feb 2
4.00
--
Feb 12, 2016
3:30PM
Euro Zone
Euro-Zone GDP s.a. (QoQ)
% Change
4Q A
0.30
--
12:30PM
Germany
GDP nsa (YoY)
% Change
4Q P
1.80
--
Source: Bloomberg, Angel Research
Market Outlook
December 29, 2015
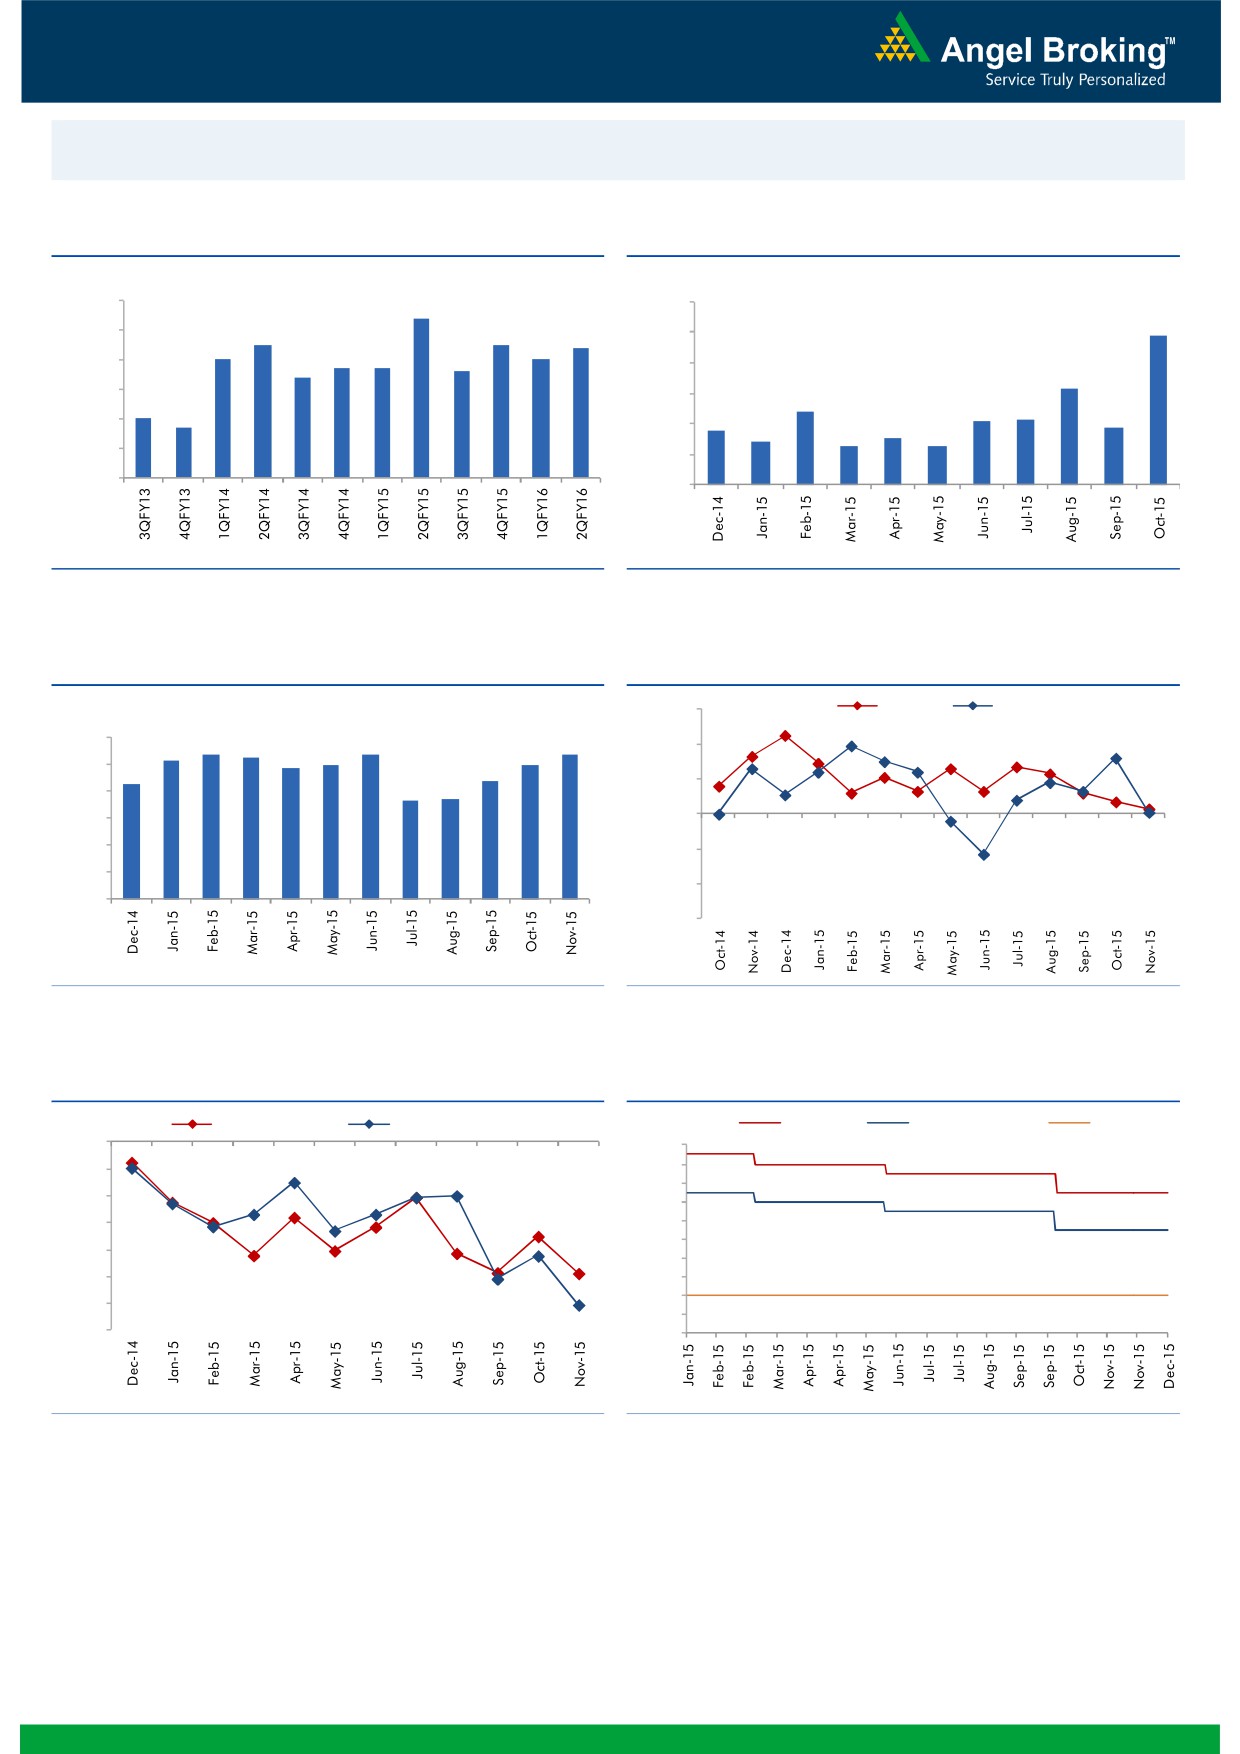
Macro watch
Exhibit 1: Quarterly GDP trends
Exhibit 2: IIP trends
(%)
(%)
9.0
8.4
12.0
9.8
8.0
7.5
7.5
7.4
10.0
7.0
7.0
6.7
6.7
6.6
7.0
6.4
8.0
6.3
6.0
6.0
4.8
5.0
4.2
4.3
4.7
3.6
3.8
5.0
4.0
2.8
3.0
2.5
2.5
4.0
2.0
3.0
-
Source: CSO, Angel Research
Source: MOSPI, Angel Research
Exhibit 3: Monthly CPI inflation trends
Exhibit 4: Manufacturing and services PMI
(%)
56.0
Mfg. PMI
Services PMI
6.0
5.4
5.3
5.4
5.4
5.2
5.0
5.0
54.0
4.9
5.0
4.3
4.4
3.7
3.7
52.0
4.0
3.0
50.0
2.0
48.0
1.0
46.0
-
44.0
Source: MOSPI, Angel Research
Source: Market, Angel Research; Note: Level above 50 indicates expansion
Exhibit 5: Exports and imports growth trends
Exhibit 6: Key policy rates
(%)
Exports yoy growth
Imports yoy growth
(%)
Repo rate
Reverse Repo rate
CRR
0.0
8.00
(5.0)
7.50
7.00
(10.0)
6.50
(15.0)
6.00
5.50
(20.0)
5.00
(25.0)
4.50
4.00
(30.0)
3.50
(35.0)
3.00
Source: Bloomberg, Angel Research
Source: RBI, Angel Research
Market Outlook
December 29, 2015
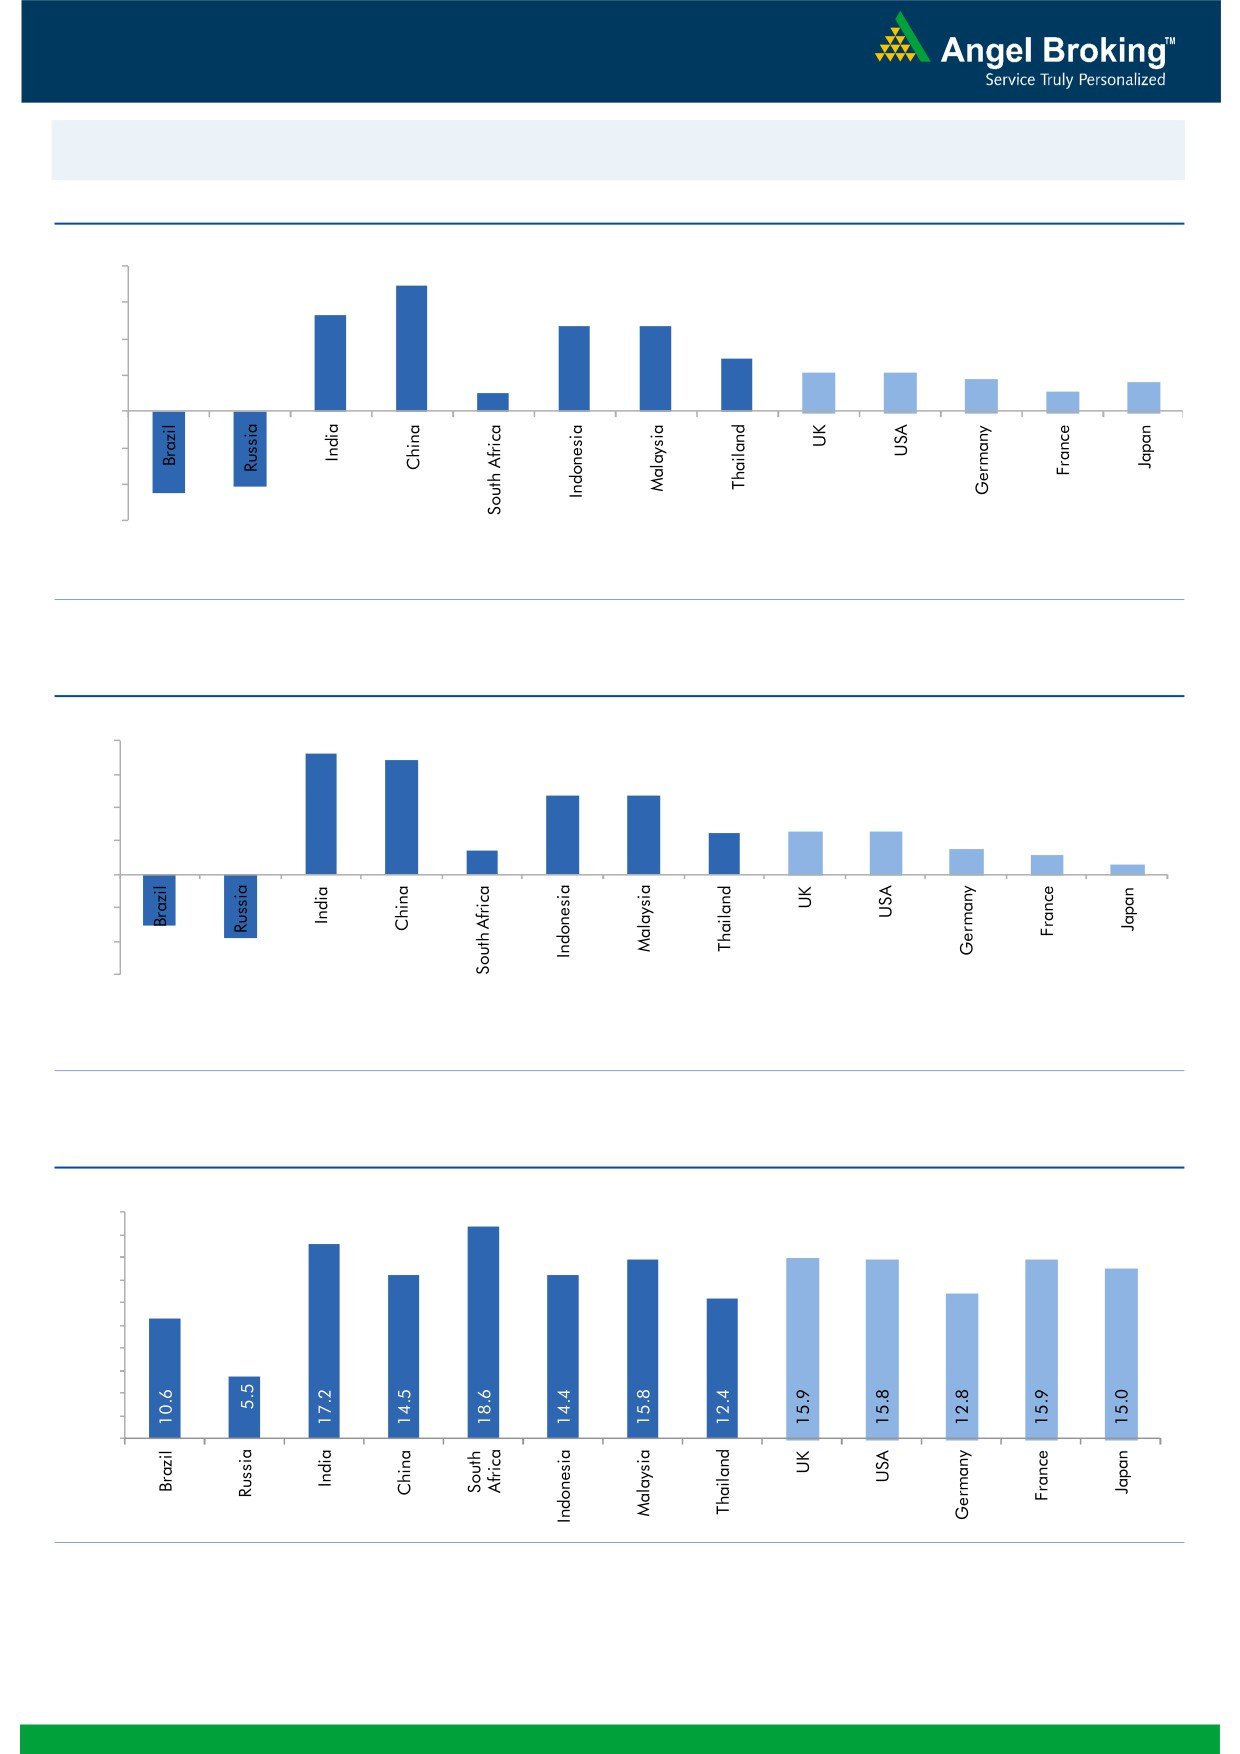
Global watch
Exhibit 1: Latest quarterly GDP Growth (%, yoy) across select developing and developed countries
(%)
8.0
6.9
6.0
5.3
4.7
4.7
4.0
2.9
2.1
2.1
1.8
2.0
1.0
1.1
1.6
-
(2.0)
(4.0)
(4.1)
(4.5)
(6.0)
Source: Bloomberg, Angel Research
Exhibit 2: 2015 GDP Growth projection by IMF (%, yoy) across select developing and developed countries
(%)
7.3
8.0
6.8
6.0
4.7
4.7
4.0
2.5
2.5
2.6
1.4
1.5
2.0
1.2
0.6
(3.8)
-
(2.0)
(4.0)
(3.0)
(6.0)
Source: IMF, Angel Research
Exhibit 3: One year forward P-E ratio across select developing and developed countries
(x)
20.0
18.0
16.0
14.0
12.0
10.0
8.0
6.0
4.0
2.0
-
Source: IMF, Angel Research
Stock Watch
December 29, 2015
Company Name
Reco
CMP
Target
Mkt Cap
Sales ( Čcr )
OPM(%)
EPS (Č)
PER(x)
P/BV(x)
RoE(%)
EV/Sales(x)
(Č)
Price ( Č)
( Č cr )
FY16E FY17E
FY16E
FY17E
FY16E
FY17E
FY16E
FY17E
FY16E
FY17E
FY16E
FY17E
FY16E
FY17E
Agri / Agri Chemical
Rallis
Neutral
181
-
3,518
2,075
2,394
14.4
14.4
9.5
11.0
19.0
16.5
3.8
3.3
21.1
21.3
1.7
1.5
United Phosphorus
Buy
434
510
18,606
13,698
15,752
17.6
17.6
32.1
38.5
13.5
11.3
2.7
2.2
21.4
21.3
1.5
1.2
Auto & Auto Ancillary
Ashok Leyland
Buy
89
111
25,300
17,995
21,544
11.4
11.6
3.4
4.7
26.2
18.9
4.6
4.2
17.7
22.2
1.4
1.1
Bajaj Auto
Accumulate
2,487
2,728
71,979
23,695
27,298
21.3
20.4
134.6
151.5
18.5
16.4
5.9
5.0
31.8
30.6
2.6
2.2
Bharat Forge
Neutral
902
-
21,005
7,867
8,881
20.0
20.3
34.4
41.0
26.2
22.0
5.1
4.2
21.1
20.9
2.8
2.4
Eicher Motors
Accumulate
16,599
19,036
45,072
15,379
16,498
15.6
16.6
473.2
574.8
35.1
28.9
13.0
9.7
36.7
33.2
2.9
2.6
Gabriel India
Accumulate
95
101
1,367
1,415
1,544
8.7
9.0
4.6
5.4
20.7
17.6
3.8
3.3
18.1
18.9
0.9
0.8
Hero Motocorp
Neutral
2,702
-
53,961
28,561
31,559
14.7
14.7
151.1
163.2
17.9
16.6
6.9
5.9
38.7
35.6
1.7
1.5
Jamna Auto Industries Neutral
138
-
1,101
1,292
1,486
9.3
9.8
6.0
7.5
23.0
18.4
4.8
4.0
20.7
21.8
0.9
0.8
L G Balakrishnan & Bros Neutral
518
-
813
1,254
1,394
11.6
11.8
35.9
41.7
14.4
12.4
2.0
1.7
13.5
13.8
0.8
0.7
Mahindra and Mahindra Buy
1,247
1,449
77,438
39,031
44,440
13.8
13.9
57.9
67.6
21.5
18.4
3.5
3.1
16.1
16.6
1.6
1.4
Maruti
Neutral
4,635
-
140,025
57,865
68,104
16.4
16.7
176.3
225.5
26.3
20.6
5.1
4.4
19.4
21.2
2.2
1.8
Minda Industries
Neutral
912
-
1,446
2,567
2,965
8.0
8.3
46.1
57.8
19.8
15.8
3.3
2.7
16.7
17.3
0.7
0.6
Motherson Sumi
Accumulate
291
313
38,432
39,343
45,100
8.8
9.1
10.1
12.5
28.8
23.2
9.1
7.1
35.3
34.4
1.1
0.9
Rane Brake Lining
Accumulate
348
366
276
454
511
11.1
11.4
23.8
28.1
14.6
12.4
2.1
1.9
14.2
15.3
0.7
0.7
Setco Automotive
Neutral
44
-
582
594
741
12.7
13.7
1.7
3.2
25.7
13.6
2.7
2.3
10.4
16.9
1.4
1.2
Tata Motors
Neutral
393
-
113,539
255,254
301,772
12.9
13.4
23.7
37.3
16.6
10.5
2.0
1.7
7.4
12.1
0.6
0.6
TVS Motor
Buy
286
338
13,564
11,569
13,648
7.3
8.7
10.3
16.1
27.7
17.7
6.9
5.4
24.8
30.5
1.2
1.0
Amara Raja Batteries
Buy
861
1,040
14,702
4,892
5,871
17.4
17.6
28.8
37.1
29.9
23.2
7.0
5.6
23.4
24.1
3.0
2.4
Exide Industries
Accumulate
146
162
12,410
6,950
7,784
14.4
14.8
6.6
7.3
22.1
20.0
2.8
2.5
12.6
12.8
1.5
1.3
Apollo Tyres
Accumulate
156
171
7,926
12,146
12,689
16.8
16.0
21.2
19.0
7.3
8.2
1.2
1.1
16.5
13.0
0.7
0.8
Ceat
Accumulate
1,061
1,119
4,292
6,041
6,597
14.1
13.7
99.5
111.9
10.7
9.5
2.1
1.8
19.6
18.5
0.9
0.7
JK Tyres
Neutral
112
-
2,536
7,446
7,669
15.2
14.0
19.6
18.4
5.7
6.1
1.4
1.2
25.2
19.5
0.7
0.6
Swaraj Engines
Neutral
969
-
1,204
552
630
14.2
14.7
44.6
54.1
21.7
17.9
5.1
4.6
23.2
25.6
2.0
1.7
Subros
Neutral
115
-
692
1,268
1,488
11.6
11.9
3.7
6.6
31.2
17.5
2.1
1.9
6.8
11.4
0.9
0.7
Indag Rubber
Neutral
202
-
531
283
329
17.0
17.2
13.0
15.4
15.6
13.1
3.4
2.8
21.8
21.6
1.6
1.3
Capital Goods
ACE
Neutral
47
-
462
660
839
4.7
8.2
1.0
3.9
46.7
12.0
1.5
1.3
3.2
11.3
0.8
0.7
BEML
Neutral
1,285
-
5,350
3,277
4,006
6.0
8.9
29.2
64.3
44.0
20.0
2.5
2.2
5.7
11.7
1.7
1.4
Bharat Electronics
Accumulate
1,307
1,414
31,367
7,737
8,634
16.8
17.2
54.0
61.0
24.2
21.4
3.5
3.1
39.3
45.6
3.2
2.7
Stock Watch
December 29, 2015
Company Name
Reco
CMP
Target
Mkt Cap
Sales ( Čcr )
OPM(%)
EPS (Č)
PER(x)
P/BV(x)
RoE(%)
EV/Sales(x)
(Č)
Price ( Č)
( Č cr )
FY16E
FY17E
FY16E
FY17E
FY16E
FY17E
FY16E
FY17E
FY16E
FY17E
FY16E
FY17E
FY16E
FY17E
Capital Goods
Voltas
Accumulate
313
353
10,342
5,363
5,963
8.0
9.1
11.0
13.8
28.4
22.7
4.4
3.8
16.2
17.9
1.9
1.7
BGR Energy
Neutral
133
-
960
3,615
3,181
9.5
9.4
16.7
12.4
8.0
10.7
0.8
0.7
10.0
7.0
0.7
0.8
BHEL
Neutral
172
-
42,013
33,722
35,272
10.8
11.7
10.5
14.2
16.4
12.1
1.2
1.1
7.0
9.0
1.3
1.3
Blue Star
Accumulate
389
429
3,502
3,548
3,977
6.3
6.9
13.7
17.2
28.4
22.7
7.2
4.7
26.1
25.4
1.1
0.9
Crompton Greaves
Accumulate
193
204
12,093
13,484
14,687
4.9
6.2
4.5
7.1
42.9
27.2
3.0
2.8
7.2
10.8
1.0
0.9
Inox Wind
Buy
365
505
8,090
4,980
5,943
17.0
17.5
26.6
31.6
13.7
11.5
4.1
3.0
35.0
30.0
1.8
1.4
KEC International
Neutral
154
-
3,960
8,791
9,716
6.1
6.8
5.4
8.2
28.5
18.8
2.9
2.6
10.0
14.0
0.7
0.6
Thermax
Neutral
944
-
11,245
6,413
7,525
7.4
8.5
30.5
39.3
30.9
24.0
4.8
4.1
15.0
17.0
1.7
1.4
Cement
ACC
Buy
1,329
1,630
24,949
13,151
14,757
16.4
18.3
63.9
83.4
20.8
15.9
2.7
2.5
13.3
16.1
1.7
1.5
Ambuja Cements
Buy
202
233
31,379
11,564
12,556
19.4
20.7
8.9
10.1
22.7
20.0
2.8
2.7
12.8
13.8
2.4
2.1
HeidelbergCement
Neutral
79
-
1,786
1,772
1,926
13.3
15.4
1.0
3.0
78.8
26.3
2.0
1.9
2.6
7.9
1.6
1.4
India Cements
Buy
87
112
2,677
4,216
4,840
18.0
19.5
4.0
9.9
21.8
8.8
0.9
0.8
4.0
9.5
1.0
0.8
JK Cement
Buy
614
744
4,290
3,661
4,742
10.1
15.8
18.0
61.0
34.1
10.1
2.5
2.2
7.5
22.9
1.6
1.2
J K Lakshmi Cement
Buy
331
430
3,891
2,947
3,616
16.7
19.9
11.5
27.2
28.8
12.2
2.7
2.4
9.8
20.8
1.7
1.4
Mangalam Cements
Neutral
195
-
521
1,053
1,347
10.5
13.3
8.4
26.0
23.2
7.5
1.0
0.9
4.3
12.5
0.9
0.6
Orient Cement
Buy
150
183
3,071
1,854
2,524
21.2
22.2
7.7
11.1
19.5
13.5
2.8
2.4
13.3
15.7
2.4
1.7
Ramco Cements
Neutral
373
-
8,879
4,036
4,545
20.8
21.3
15.1
18.8
24.7
19.8
3.0
2.7
12.9
14.3
2.7
2.3
Shree Cement^
Neutral
11,197
-
39,007
7,150
8,742
26.7
28.6
228.0
345.5
49.1
32.4
7.2
6.1
15.7
20.3
5.2
4.2
UltraTech Cement
Buy
2,811
3,282
77,128
25,021
30,023
19.1
21.6
89.0
132.0
31.6
21.3
3.7
3.2
12.2
15.9
3.1
2.6
Construction
ITNL
Neutral
87
-
2,865
7,360
8,825
34.0
35.9
7.0
9.0
12.4
9.7
0.4
0.4
3.2
3.7
3.8
3.6
KNR Constructions
Buy
575
673
1,618
937
1,470
14.3
14.0
33.5
38.6
17.2
14.9
2.6
2.3
15.4
15.4
1.8
1.2
Larsen & Toubro
Buy
1,294
1,646
120,504
65,065
77,009
11.5
11.7
61.5
65.6
21.0
19.7
2.1
1.9
13.4
14.0
2.1
1.7
Gujarat Pipavav Port
Neutral
146
-
7,061
629
684
51.0
52.2
6.4
5.9
22.8
24.8
3.0
2.8
15.9
12.7
10.9
9.8
MBL Infrastructures
Buy
223
285
923
2,313
2,797
12.2
14.6
19.0
20.0
11.7
11.1
1.2
1.1
11.3
10.6
1.1
1.0
Nagarjuna Const.
Neutral
78
-
4,308
7,892
8,842
8.8
9.1
3.0
5.3
25.8
14.6
1.3
1.2
5.0
8.5
0.8
0.7
PNC Infratech
Neutral
537
-
2,755
1,873
2,288
13.2
13.5
24.0
32.0
22.4
16.8
2.2
1.9
12.1
12.3
1.6
1.3
Simplex Infra
Neutral
312
-
1,543
5,955
6,829
10.3
10.5
16.0
31.0
19.5
10.1
1.0
0.9
5.3
9.9
0.8
0.7
Power Mech Projects
Neutral
639
-
940
1,539
1,801
12.8
12.7
59.0
72.1
10.8
8.9
1.6
1.4
18.6
16.8
0.6
0.5
Sadbhav Engineering
Neutral
343
-
5,884
3,481
4,219
10.7
10.8
8.0
12.0
42.9
28.6
4.0
3.5
10.3
13.5
2.0
1.6
Stock Watch
December 29, 2015
Company Name
Reco
CMP
Target
Mkt Cap
Sales ( Čcr )
OPM(%)
EPS (Č)
PER(x)
P/BV(x)
RoE(%)
EV/Sales(x)
(Č)
Price ( Č)
( Č cr )
FY16E
FY17E
FY16E
FY17E
FY16E
FY17E
FY16E
FY17E
FY16E
FY17E
FY16E
FY17E
FY16E
FY17E
Construction
NBCC
Accumulate
997
1,089
11,960
7,382
9,506
7.7
8.6
39.8
54.4
25.0
18.3
6.0
4.8
26.7
29.1
1.4
1.0
SIPL
Neutral
98
-
3,452
675
1,042
62.4
64.7
-
-
3.7
4.2
-
-
16.8
11.3
Financials
Allahabad Bank
Neutral
71
-
4,282
8,569
9,392
2.8
2.9
16.3
27.5
4.4
2.6
0.4
0.3
7.6
11.9
-
-
Axis Bank
Buy
454
630
108,032
26,473
31,527
3.5
3.6
35.7
43.5
12.7
10.4
2.5
2.1
17.9
18.9
-
-
Bank of Baroda
Neutral
159
-
36,602
18,485
21,025
1.9
2.0
13.5
21.1
11.8
7.5
0.9
0.8
7.3
10.6
-
-
Bank of India
Neutral
118
-
9,333
15,972
17,271
1.9
2.0
15.3
33.4
7.7
3.5
0.4
0.3
3.6
7.6
-
-
Canara Bank
Neutral
241
-
13,086
15,441
16,945
2.0
2.1
46.6
70.4
5.2
3.4
0.5
0.4
8.0
11.2
-
-
Dena Bank
Neutral
41
-
2,655
3,440
3,840
2.1
2.3
7.3
10.0
5.7
4.1
0.4
0.4
6.1
7.9
-
-
Federal Bank
Neutral
57
-
9,746
3,477
3,999
3.0
3.0
5.0
6.2
11.3
9.1
1.1
1.0
10.6
11.9
-
-
HDFC
Neutral
1,225
-
193,409
10,358
11,852
3.3
3.3
41.1
47.0
29.8
26.1
5.7
5.2
24.7
24.9
-
-
HDFC Bank
Buy
1,076
1,262
271,487
38,309
47,302
4.3
4.3
49.3
61.1
21.8
17.6
3.8
3.2
18.5
19.7
-
-
ICICI Bank
Buy
264
354
153,524
34,279
39,262
3.3
3.3
21.0
24.4
12.6
10.8
2.1
1.8
14.4
14.7
-
-
IDBI Bank
Neutral
90
-
14,468
9,625
10,455
1.8
1.8
8.5
14.2
10.6
6.4
0.7
0.6
5.9
9.3
-
-
Indian Bank
Neutral
115
-
5,543
6,160
6,858
2.5
2.5
24.5
29.8
4.7
3.9
0.4
0.3
7.7
8.6
-
-
LIC Housing Finance
Buy
487
571
24,554
3,101
3,745
2.5
2.5
33.0
40.2
14.8
12.1
2.8
2.3
19.7
20.5
-
-
Oriental Bank
Neutral
139
-
4,172
7,643
8,373
2.4
2.4
37.2
45.4
3.7
3.1
0.3
0.3
8.2
9.4
-
-
Punjab Natl.Bank
Neutral
120
-
23,652
23,638
26,557
2.8
2.8
17.9
27.2
6.7
4.4
0.7
0.6
8.5
12.0
-
-
South Ind.Bank
Neutral
20
-
2,640
1,965
2,185
2.5
2.5
2.5
3.3
7.9
5.9
0.8
0.7
9.5
11.7
-
-
St Bk of India
Buy
229
283
177,651
82,520
93,299
2.7
2.8
20.0
24.5
11.4
9.4
1.2
1.1
11.5
12.8
-
-
Union Bank
Neutral
153
-
10,494
12,646
14,129
2.3
2.4
31.0
39.1
4.9
3.9
0.5
0.5
9.8
11.4
-
-
Vijaya Bank
Neutral
34
-
2,921
3,536
3,827
1.9
1.9
5.5
6.7
6.2
5.1
0.5
0.5
7.8
8.8
-
-
Yes Bank
Buy
732
921
30,678
7,190
9,011
3.2
3.3
58.2
69.7
12.6
10.5
2.2
1.9
19.2
19.6
-
-
FMCG
Asian Paints
Neutral
880
-
84,409
16,553
19,160
16.0
16.2
17.7
21.5
49.8
40.9
13.2
11.9
29.4
31.2
4.9
4.3
Britannia
Neutral
2,910
-
34,907
8,065
9,395
9.6
10.2
47.2
65.5
61.6
44.4
20.5
19.4
38.3
41.2
4.2
3.6
Colgate
Neutral
981
-
26,678
4,836
5,490
19.5
19.7
48.5
53.2
20.2
18.4
14.8
12.9
99.8
97.5
5.4
4.8
Dabur India
Neutral
277
-
48,667
9,370
10,265
17.1
17.2
7.3
8.1
37.7
34.2
11.4
9.3
33.7
30.6
5.1
4.7
GlaxoSmith Con*
Neutral
6,586
-
27,697
4,919
5,742
17.2
17.4
168.3
191.2
39.1
34.4
11.1
9.5
28.8
28.9
5.2
4.4
Godrej Consumer
Neutral
1,298
-
44,191
10,168
12,886
16.1
16.1
32.1
38.4
40.4
33.8
8.2
7.6
19.7
21.0
4.4
3.5
HUL
Neutral
866
-
187,370
34,940
38,957
17.5
17.7
20.8
24.7
41.6
35.1
46.3
37.0
110.5
114.2
5.2
4.6
Stock Watch
December 29, 2015
Company Name
Reco
CMP
Target
Mkt Cap
Sales ( Čcr )
OPM(%)
EPS (Č)
PER(x)
P/BV(x)
RoE(%)
EV/Sales(x)
(Č)
Price ( Č)
( Č cr )
FY16E FY17E
FY16E
FY17E
FY16E
FY17E
FY16E
FY17E
FY16E
FY17E
FY16E
FY17E
FY16E
FY17E
FMCG
ITC
Buy
326
382
262,036
41,068
45,068
37.8
37.4
13.9
15.9
23.4
20.5
7.9
6.9
34.1
33.8
6.0
5.4
Marico
Buy
224
363
28,932
6,551
7,766
15.7
16.0
10.4
12.5
21.6
17.9
6.3
5.2
33.2
32.4
4.3
3.7
Nestle*
Accumulate
5,801
6,646
55,926
11,291
12,847
22.2
22.3
158.9
184.6
36.5
31.4
19.1
17.2
55.0
57.3
4.8
4.2
Tata Global
Neutral
144
-
9,091
8,635
9,072
9.8
9.9
6.5
7.6
22.2
19.0
2.2
2.1
6.8
7.4
1.0
0.9
IT
HCL Tech^
Buy
865
1,132
121,924
42,038
47,503
23.2
23.5
55.8
62.9
15.5
13.8
3.6
2.7
23.0
19.8
2.5
2.0
Infosys
Buy
1,102
1,306
253,043
60,250
66,999
28.0
28.0
58.3
63.7
18.9
17.3
4.0
3.4
20.9
19.7
3.5
3.0
TCS
Buy
2,459
3,165
484,430
111,274
126,852
28.4
28.7
125.4
143.9
19.6
17.1
7.8
7.2
39.9
42.2
4.0
3.4
Tech Mahindra
Buy
518
646
50,042
25,566
28,890
16.0
17.0
26.3
31.9
19.7
16.2
3.5
3.0
17.9
18.6
1.7
1.5
Wipro
Buy
561
719
138,477
52,414
58,704
23.7
23.8
38.4
42.3
14.6
13.3
2.9
2.6
19.5
18.0
2.2
1.8
Media
D B Corp
Accumulate
328
356
6,017
2,241
2,495
27.8
27.9
21.8
25.6
15.1
12.8
3.9
3.5
26.7
28.5
2.6
2.4
HT Media
Neutral
93
-
2,163
2,495
2,603
11.2
11.2
7.3
8.6
12.7
10.8
1.0
0.9
7.4
8.1
0.4
0.3
Jagran Prakashan
Accumulate
159
169
5,195
2,170
2,355
27.2
26.2
8.9
9.9
17.9
16.1
3.8
3.3
20.9
20.5
2.3
2.1
Sun TV Network
Neutral
418
-
16,459
2,779
3,196
70.2
70.5
22.8
27.3
18.3
15.3
4.5
4.1
26.7
28.3
5.7
4.9
Hindustan Media
Neutral
295
-
2,164
920
1,031
20.0
20.0
19.2
20.9
15.4
14.1
2.5
2.2
16.4
15.3
1.9
1.7
Ventures
Metals & Mining
Coal India
Buy
325
380
205,377
76,167
84,130
19.9
22.3
22.4
25.8
14.5
12.6
5.2
5.1
35.5
41.0
2.0
1.8
Hind. Zinc
Buy
147
175
62,281
14,641
14,026
50.4
50.4
17.7
16.0
8.4
9.2
1.3
1.2
16.2
13.2
1.9
1.7
Hindalco
Neutral
85
-
17,521
104,356
111,186
8.7
9.5
6.7
11.1
12.6
7.7
0.5
0.4
3.5
5.9
0.7
0.6
JSW Steel
Neutral
1,030
-
24,888
42,308
45,147
16.4
20.7
(10.3)
49.5
20.8
1.2
1.1
(1.0)
5.6
1.6
1.5
NMDC
Neutral
91
-
36,079
8,237
10,893
46.6
44.5
10.0
11.7
9.2
7.8
1.0
0.9
12.5
13.0
4.2
3.2
SAIL
Neutral
48
-
19,928
45,915
53,954
7.2
10.5
1.5
4.4
32.0
11.0
0.5
0.5
2.3
4.1
1.1
1.0
Vedanta
Neutral
92
-
27,246
71,445
81,910
26.2
26.3
12.9
19.2
7.1
4.8
0.5
0.4
7.2
8.9
0.8
0.6
Tata Steel
Neutral
254
-
24,674
126,760
137,307
8.9
11.3
6.4
23.1
39.9
11.0
0.8
0.8
2.0
7.1
0.8
0.7
Oil & Gas
Cairn India
Neutral
139
-
25,995
11,323
12,490
49.4
51.0
20.7
20.7
6.7
6.7
0.4
0.4
6.4
6.1
1.4
0.7
GAIL
Neutral
362
-
45,906
64,856
70,933
9.1
9.6
24.0
28.9
15.1
12.5
1.3
1.2
8.8
9.6
0.9
0.8
ONGC
Neutral
240
-
205,289
154,564
167,321
36.8
37.4
28.6
32.5
8.4
7.4
1.1
1.0
12.7
13.5
1.5
1.4
Petronet LNG
Neutral
242
-
18,146
29,691
31,188
5.8
6.2
12.8
13.4
18.9
18.0
2.8
2.5
15.8
14.8
0.7
0.6
Indian Oil Corp
Accumulate
431
455
104,620
359,607
402,760
5.9
6.1
42.5
48.7
10.2
8.8
1.4
1.2
14.1
14.4
0.4
0.3
Reliance Industries
Neutral
1,009
-
326,691
304,775
344,392
12.6
13.4
91.3
102.6
11.1
9.8
1.2
1.1
11.8
12.0
1.0
0.8
Pharmaceuticals
Alembic Pharma
Neutral
700
-
13,197
2,658
3,112
24.1
20.2
24.6
23.9
28.5
29.3
10.2
7.8
42.5
30.2
5.0
4.2
Stock Watch
December 29, 2015
Company Name
Reco
CMP
Target
Mkt Cap
Sales ( Čcr )
OPM(%)
EPS (Č)
PER(x)
P/BV(x)
RoE(%)
EV/Sales(x)
(Č)
Price ( Č)
( Č cr )
FY16E FY17E
FY16E
FY17E
FY16E
FY17E
FY16E
FY17E
FY16E
FY17E
FY16E
FY17E
FY16E
FY17E
Pharmaceuticals
Aurobindo Pharma
Neutral
872
-
50,928
14,923
17,162
23.0
23.0
38.2
43.6
22.8
20.0
7.0
5.3
36.0
30.2
3.8
3.2
Aventis*
Neutral
4,363
-
10,048
2,082
2,371
17.4
20.8
118.2
151.5
36.9
28.8
5.4
4.3
19.9
25.5
4.5
3.7
Cadila Healthcare
Neutral
389
-
39,788
10,224
11,840
21.0
22.0
14.6
17.6
26.6
22.1
7.3
5.7
30.8
29.0
4.0
3.3
Cipla
Neutral
655
-
52,620
14,211
16,611
20.6
19.0
27.0
28.9
24.3
22.7
4.1
3.5
18.4
16.8
3.7
3.1
Dr Reddy's
Buy
3,116
3,933
53,145
16,838
19,575
25.0
23.1
167.5
178.8
18.6
17.4
3.9
3.3
23.1
20.4
3.1
2.6
Dishman Pharma
Neutral
322
-
2,598
1,733
1,906
21.5
21.5
17.0
19.9
18.9
16.2
1.9
1.7
10.5
11.2
2.0
1.7
GSK Pharma*
Neutral
3,284
-
27,820
2,870
3,158
20.0
22.1
59.5
68.3
55.2
48.1
16.3
16.7
28.5
34.3
9.2
8.4
Indoco Remedies
Neutral
333
-
3,068
1,033
1,199
15.9
18.2
9.4
13.6
35.4
24.5
5.3
4.5
15.7
19.7
3.1
2.6
Ipca labs
Buy
746
900
9,410
3,363
3,909
12.9
18.6
13.4
28.0
55.7
26.6
4.0
3.5
7.4
14.0
3.1
2.7
Lupin
Neutral
1,841
-
82,943
13,092
16,561
25.0
27.0
50.4
68.3
36.5
27.0
7.5
6.0
22.8
24.7
6.1
4.7
Sun Pharma
Buy
812
950
195,296
28,163
32,610
25.8
30.7
17.4
26.9
46.6
30.2
4.4
3.8
13.0
16.6
6.4
5.3
Power
Tata Power
Neutral
68
-
18,256
35,923
37,402
22.6
22.8
4.1
5.2
16.7
13.1
1.3
1.2
7.5
9.3
1.5
1.3
NTPC
Accumulate
144
157
118,529
87,064
98,846
23.5
23.5
11.7
13.2
12.3
10.9
1.4
1.3
11.4
12.1
2.4
2.1
Power Grid
Buy
142
170
74,079
20,702
23,361
86.7
86.4
12.1
13.2
11.7
10.7
1.7
1.5
15.6
15.1
8.5
7.9
Telecom
Bharti Airtel
Neutral
331
-
132,374
101,748
109,191
32.1
31.7
12.0
12.5
27.6
26.5
1.9
1.8
6.9
6.7
1.9
1.8
Idea Cellular
Neutral
140
-
50,346
34,282
36,941
32.0
31.5
5.9
6.2
23.7
22.6
2.2
2.0
9.9
9.3
2.0
1.9
zOthers
Abbott India
Neutral
5,705
-
12,123
2,715
3,153
14.5
14.1
134.3
152.2
42.5
37.5
10.6
8.7
27.4
25.6
4.2
3.5
Bajaj Electricals
Buy
214
290
2,159
4,719
5,287
5.2
5.8
8.6
12.7
25.0
16.9
2.9
2.5
11.4
14.8
0.5
0.4
Finolex Cables
Neutral
252
-
3,854
2,520
2,883
12.2
12.0
12.7
14.2
19.9
17.8
2.7
2.4
13.6
13.5
1.3
1.1
Goodyear India*
Accumulate
564
622
1,302
1,888
1,680
12.1
11.9
62.2
56.6
9.1
10.0
2.1
1.8
25.9
19.7
0.5
0.5
Hitachi
Neutral
1,354
-
3,682
1,779
2,081
7.8
8.8
21.8
33.4
62.1
40.5
10.0
8.1
17.4
22.1
2.1
1.8
Jyothy Laboratories
Neutral
300
-
5,428
1,620
1,847
11.5
11.5
7.3
8.5
41.1
35.4
5.3
4.9
13.3
14.4
3.2
2.7
MRF
Buy
39,631
45,575
16,808
20,316
14,488
21.4
21.1
5,488.0
3,798.0
7.2
10.4
2.5
2.0
41.1
21.2
0.8
1.0
Page Industries
Neutral
12,960
-
14,455
1,929
2,450
19.8
20.1
229.9
299.0
56.4
43.4
24.9
17.3
52.1
47.1
7.5
5.9
Relaxo Footwears
Neutral
492
-
5,906
1,767
2,152
12.3
12.5
19.3
25.1
25.6
19.6
6.3
4.8
27.7
27.8
3.4
2.8
Siyaram Silk Mills
Accumulate
1,193
1,354
1,119
1,636
1,815
11.5
11.5
89.9
104.1
13.3
11.5
2.2
1.9
17.9
17.8
0.8
0.8
Styrolution ABS India*
Neutral
756
-
1,330
1,271
1,440
8.6
9.2
32.0
41.1
23.6
18.4
2.4
2.2
10.7
12.4
1.0
0.9
TVS Srichakra
Buy
2,780
3,240
2,129
2,101
2,338
15.7
15.0
248.6
270.0
11.2
10.3
4.9
3.5
43.6
34.0
1.1
0.9
HSIL
Neutral
298
-
2,157
2,123
2,384
16.1
16.5
15.0
18.9
19.8
15.8
1.5
1.4
8.0
9.4
1.4
1.2
Stock Watch
December 29, 2015
Company Name
Reco
CMP
Target
Mkt Cap
Sales ( Čcr )
OPM(%)
EPS (Č)
PER(x)
P/BV(x)
RoE(%)
EV/Sales(x)
(Č)
Price ( Č)
( Č cr )
FY16E FY17E
FY16E FY17E
FY16E FY17E
FY16E
FY17E
FY16E
FY17E
FY16E
FY17E
FY16E
FY17E
zOthers
Kirloskar Engines India
Neutral
244
-
3,535
2,471
2,826
8.8
10.4
9.1
13.3
26.8
18.3
2.6
2.4
9.7
13.4
1.1
0.9
Ltd
M M Forgings
Buy
513
614
620
511
615
21.7
21.6
43.1
55.8
11.9
9.2
2.2
1.8
19.9
21.2
1.4
1.1
Banco Products (India) Neutral
145
-
1,039
1,208
1,353
11.0
12.3
10.8
14.5
13.5
10.0
1.5
1.4
11.9
14.5
0.8
0.7
Competent Automobiles Neutral
152
-
93
1,040
1,137
3.2
3.1
25.7
28.0
5.9
5.4
0.9
0.8
15.0
14.3
0.1
0.1
Nilkamal
Neutral
1,224
-
1,827
1,910
2,083
10.5
10.3
63.3
69.2
19.3
17.7
3.2
2.7
17.6
16.5
1.0
0.9
Visaka Industries
Buy
125
144
199
1,086
1,197
9.9
10.3
21.5
28.8
5.8
4.4
0.6
0.5
9.6
11.6
0.4
0.3
Transport Corporation of
Neutral
300
-
2,286
2,830
3,350
8.8
9.0
14.4
18.3
20.9
16.4
3.2
2.8
15.4
17.1
0.9
0.8
India
Elecon Engineering
Neutral
85
-
928
1,369
1,533
13.7
14.9
3.3
6.1
25.7
14.1
1.7
1.6
6.6
11.4
1.0
0.9
Surya Roshni
Buy
146
183
641
2,992
3,223
8.1
8.4
14.7
18.3
10.0
8.0
0.9
0.8
9.7
11.0
0.5
0.5
MT Educare
Neutral
189
-
752
286
366
18.3
17.7
7.7
9.4
24.5
20.2
5.2
4.5
20.2
21.1
2.5
1.9
Radico Khaitan
Buy
113
156
1,500
1,565
1,687
12.2
13.0
5.7
7.1
19.8
15.9
1.7
1.5
8.3
9.6
1.4
1.3
Garware Wall Ropes
Accumulate
425
473
930
861
967
10.9
10.9
24.0
28.2
17.7
15.1
2.6
2.2
14.6
14.9
1.1
0.9
Wonderla Holidays
Neutral
393
-
2,222
206
308
44.0
43.6
9.0
12.9
43.7
30.5
6.0
5.4
13.7
17.8
10.7
7.1
Linc Pen & Plastics
Neutral
223
-
330
340
371
8.3
8.9
10.8
13.2
20.7
16.9
3.3
2.9
16.0
17.1
1.0
0.9
The Byke Hospitality
Neutral
150
-
600
222
287
20.5
20.5
5.6
7.6
26.6
19.8
5.0
4.1
18.9
20.8
2.7
2.1
Interglobe Aviation
Neutral
1,194
-
43,032
17,022
21,122
20.7
14.5
63.9
53.7
18.7
22.3
28.0
23.0
149.9
103.2
2.6
2.1
Coffee Day Enterprises
Neutral
276
-
5,684
2,692
2,964
17.0
18.6
-
4.7
-
58.2
3.4
3.2
0.2
5.5
2.5
2.3
Ltd
Navneet Education
Neutral
98
-
2,326
998
1,062
24.1
24.0
5.8
6.1
17.0
16.0
3.7
3.3
22.0
20.6
2.4
2.3
Source: Company, Angel Research; Note: *December year end; #September year end; &October year end; Price as on December 28, 2015
Market Outlook
December 29, 2015
Research Team Tel: 022 - 39357800
DISCLAIMER
Angel Broking Private Limited (hereinafter referred to as “Angel”) is a registered Member of National Stock Exchange of India Limited,
Bombay Stock Exchange Limited and Metropolitian Stock Exchange of India Limited. It is also registered as a Depository Participant with
CDSL and Portfolio Manager with SEBI. It also has registration with AMFI as a Mutual Fund Distributor. Angel Broking Private Limited is a
registered entity with SEBI for Research Analyst in terms of SEBI (Research Analyst) Regulations, 2014 vide registration number
INH000000164. Angel or its associates has not been debarred/ suspended by SEBI or any other regulatory authority for accessing
/dealing in securities Market. Angel or its associates including its relatives/analyst do not hold any financial interest/beneficial ownership
of more than 1% in the company covered by Analyst. Angel or its associates/analyst has not received any compensation / managed or co
-managed public offering of securities of the company covered by Analyst during the past twelve months. Angel/analyst has not served as
an officer, director or employee of company covered by Analyst and has not been engaged in market making activity of the company
covered by Analyst.
This document is solely for the personal information of the recipient, and must not be singularly used as the basis of any investment
decision. Nothing in this document should be construed as investment or financial advice. Each recipient of this document should make
such investigations as they deem necessary to arrive at an independent evaluation of an investment in the securities of the companies
referred to in this document (including the merits and risks involved), and should consult their own advisors to determine the merits and
risks of such an investment.
Reports based on technical and derivative analysis center on studying charts of a stock's price movement, outstanding positions and
trading volume, as opposed to focusing on a company's fundamentals and, as such, may not match with a report on a company's
fundamentals.
The information in this document has been printed on the basis of publicly available information, internal data and other reliable sources
believed to be true, but we do not represent that it is accurate or complete and it should not be relied on as such, as this document is for
general guidance only. Angel Broking Pvt. Limited or any of its affiliates/ group companies shall not be in any way responsible for any
loss or damage that may arise to any person from any inadvertent error in the information contained in this report. Angel Broking Pvt.
Limited has not independently verified all the information contained within this document. Accordingly, we cannot testify, nor make any
representation or warranty, express or implied, to the accuracy, contents or data contained within this document. While Angel Broking
Pvt. Limited endeavors to update on a reasonable basis the information discussed in this material, there may be regulatory, compliance,
or other reasons that prevent us from doing so.
This document is being supplied to you solely for your information, and its contents, information or data may not be reproduced,
redistributed or passed on, directly or indirectly.
Neither Angel Broking Pvt. Limited, nor its directors, employees or affiliates shall be liable for any loss or damage that may arise from or
in connection with the use of this information.
Note: Please refer to the important ‘Stock Holding Disclosure' report on the Angel website (Research Section). Also, please refer to the
latest update on respective stocks for the disclosure status in respect of those stocks. Angel Broking Pvt. Limited and its affiliates may have
investment positions in the stocks recommended in this report.