Market Outlook
September 29, 2015
Dealer’s Diary
Domestic Indices
Chg (%)
(Pts)
(Close)
BSE Sensex
(1.0)
(247)
25,617
Indian markets are expected to open in red tracking the SGX Nifty and the Asian
Nifty
(0.9)
(73)
7,796
cues.
MID CAP
(0.2)
(25)
10,573
The US markets ended in negative led by weak economic cues out of China which
SMALL CAP
(0.2)
(26)
10,916
once again raised concerns about the health of the global economy. China's
BSE HC
0.1
20
17,637
industrial profits declined in August as product prices continued to decrease.
BSE PSU
(0.8)
(51)
6,594
Industrial profits fell 8.8 percent in August from a year ago, following a 2.9 percent
BANKEX
(0.5)
(103)
19,593
drop in July. Biotech shares in US were also hit hard due to worries about increased
AUTO
(1.7)
(301)
17,015
regulatory scrutiny of drug prices.
METAL
(2.6)
(179)
6,708
The European markets ended negative led by concerns over China which returned to
OIL & GAS
(0.3)
(26)
8,609
the forefront, after the nation released some disappointing economic data. Worries
BSE IT
(1.3)
(144)
11,329
over China prompted further weakness in commodity prices.
Global Indices
Chg (%)
(Pts)
(Close)
The Indian markets ended in red yesterday ahead of the Reserve Bank of India
Dow Jones
(1.9)
(313)
16,002
policy review today at 11 am. The central bank is expected to cut its key repo rate by
NASDAQ
(3.0)
(143)
4,544
at least 25 basis points, but investors' focus would be on the tone of the central bank
FTSE
(2.5)
(150)
5,959
at a time when both the WPI and retail inflation are falling.
Nikkei
(1.3)
(235)
17,645
News & Result Analysis
Hang Seng
0.4
90
21,186
Tata Steel to resume iron ore sourcing from its Jharkhand mines
Straits Times
(1.4)
(41)
2,792
SEBI Open to FII Play in Commodity F&O
Shanghai Com
0.3
8
3,101
Refer detailed news analysis on the following page
Markets Today
Indian ADR
Chg (%)
(Pts)
(Close)
The trend deciding level for the day is 25,716 / 7,826 levels. If NIFTY trades above
INFY
0.2
0.0
$17.8
this level during the first half-an-hour of trade then we may witness a further rally up
WIT
(1.2)
(0.1)
$11.7
to 25,838 - 26,059 / 7,864 - 7,932 levels. However, if NIFTY trades below
IBN
(3.3)
(0.3)
$8.2
25,716 / 7,826 levels for the first half-an-hour of trade then it may correct towards
HDB
(3.9)
(2.4)
$58.2
25,495 - 25,372 / 7,758 - 7,720 levels.
Advances / Declines
BSE
NSE
Indices
S2
S1
PIVOT
R1
R2
Advances
1,139
570
SENSEX
25,372
25,495
25,716
25,838
26,059
NIFTY
7,720
7,758
7,826
7,864
7,932
Declines
1,592
928
Unchanged
126
80
Net Inflows (September 24, 2015)
` cr
Purch
Sales
Net
MTD
YTD
Volumes (` cr)
FII
5,762
5,848
(86)
(4,129)
1,19,631
BSE
2,770
MFs
1,734
1,566
168
6,106
76,754
NSE
14,169
FII Derivatives (September 28, 2015)
` cr
Purch
Sales
Net
Open Interest
Index Futures
4,794
5,426
(633)
16,739
Stock Futures
11,234
11,195
39
42,230
Gainers / Losers
Gainer
Loser
Company
Price (`)
chg (%)
Company
Price (`)
chg (%)
RAJESHEXPO
550
12.3
TATAMOTORS
285
(6.1)
JKLAKSHMI
53
11.5
SUNTV
357
(5.0)
IDBI
79
7.0
MOTHERSUMI
239
(4.9)
PTC
60
5.6
INFRATEL
377
(4.8)
DRREDDY
4,192
5.5
PMCFIN
1
(4.7)
Market Outlook
September 29, 2015
Tata Steel to resume iron ore sourcing from its Jharkhand mines
Tata Steel, the country's oldest steel producer, will be allowed to lift its mined ore
from Noamundi in Jharkhand following payment of its first tranche of ` 124 crore
to the state government. The company will make the second payment before
November 15 and the final tranche before December 15.
Despatch of iron ore from the Noamundi mine to Tata Steel’s Jamshedpur plant
had been stalled since early July after the state government stopped issuing the
required permits that allow transportation of ore. Tata Steel had to make a total
payment of Rs 372 crore to the state government, which will now be done in
tranches. Jharkhand’s move to ask the company to make this payment had come
as an extension of an unresolved lease renewal. The Jharkhand government had
failed to act on Tata Steel’s application for a lease renewal in 2009. The
government then allowed the company to extract ore after the expiry of the lease
on a “deemed renewal” basis. However, in 2014, the Jharkhand government
decreed deemed renewal unlawful and demanded a penalty equivalent of the ore
value extracted after lease expiry.
This led to a shutdown of the Noamundi mines from September 5 to December
31, 2014. During this period, Tata Steel was forced to import iron ore for the first
time. Tata Steel resumed operations at the Jharkhand mine on January 1, 2015,
after receiving an ‘expressed order’ from the Jharkhand government. The
Noamundi mine with a capacity of 10 million tonnes of iron ore annually, meets
about 30 per cent of the total requirement of Tata Steel’s 9.7 million tonne plant at
Jamshedpur. We currently have a Neutral Rating on the stock.
SEBI Open to FII Play in Commodity F&O
The Securities and Exchange Board of India (SEBI), which took charge of regulating
the commodities derivatives market yesterday, said it is open to allowing foreign
portfolio investors to trade in this segment. The capital market regulator also wants
to introduce options trading in commodities.
At present, there are three national and six regional bourses for commodity futures
in the country. Sebi has created a separate Commodity Cell and has set up new
departments for regulation of commodities derivatives market.
The formal merger between the two regulators has aligned India with several other
developed two regulators has aligned India with several other developed countries
that have a unified regulatory system for both securities and commodities market.
Economic and Political News
GSM Players Call for CDMA Spectrum Pricing Review
NITI Aayog okays revamp of Indira Awaas Yojana
Confident of maintaining fiscal deficit at 3.9%: Arun Jaitley
Ahead of RBI meet, government pitches for investment-driven demand revival
Corporate News
R-Infra arm, UAE firm agree to partner in defence sector
Maruti's Agitating Workers Chalk Out Future Plan
Nestle India Ends Contract with Sole Third-party maker of Maggi
Lanco Infratech shelves asset sale plan for now
Market Outlook
September 29, 2015
Top Picks
Large Cap
Market
CMP
Target
Upside
Company
Sector
Rating
Cap (` Cr)
(`)
(`)
(%)
Aurobindo
Pharma
43,482
Buy
745
872
17.1
Axis Bank
Financials
1,20,507
Buy
507
701
38.3
ICICI Bank
Financials
1,55,963
Buy
269
370
37.8
Infosys
IT
2,54,547
Buy
1,108
1,306
17.8
Capital
Inox Wind
7,747
Buy
349
505
44.7
Goods
LIC HFL
Financials
21,393
Buy
424
570
34.5
Power Grid
Power
66,258
Buy
127
170
34.2
TCS
IT
5,07,379
Buy
2,590
3,168
22.3
Tech Mahindra IT
55,240 Accumulate
574
646
12.5
Yes Bank
Financials
30,551
Buy
730
953
30.6
Sun Pharma Pharma
2,07,146 Accumulate
861
950
10.4
Source: Bloomberg, Angel Research
Mid Cap
Market Cap
CMP
Target
Upside
Company
Sector
Rating
(` Cr)
(`)
(`)
(%)
Bajaj Electricals
Others
2,490
Buy
247
341
38.1
Garware Wall
Others
718
Buy
328
390
18.9
MBL Infra
Construction
1,025
Buy
247
360
45.6
Minda Industries
Auto Ancillary
819
Buy
516
652
26.2
MT Educare
Others
510
Buy
128
169
32.0
Radico Khaitan
Others
1,113
Buy
84
112
33.9
Surya Roshni
Others
537
Buy
123
183
49.4
Tree House
Others
1,387
Buy
328
449
37.0
Source: Bloomberg, Angel Research
Market Outlook
September 29, 2015
Global economic events release calendar
Date
Time
Country Event Description
Unit
Period
Bloomberg Data
Last Reported Estimated
September 29, 2015
2:30PM
Euro Zone Euro-Zone Consumer Confidence
Value
Sep F
(7.10)
(7.10)
7:30PM
US
Consumer Confidence
S.A./ 1985=100
Sep
101.54
96.00
11:00AM
India
RBI Reverse Repo rate
%
Sep 29
6.25
6.00
11:00AM
India
RBI Repo rate
%
Sep 29
7.25
7.00
11:00AM
India
RBI Cash Reserve ratio
%
Sep 29
4.00
4.00
September 30, 2015
1:25PM
Germany Unemployment change (000's)
Thousands
Sep
(7.00)
(5.00)
2:00PM
UK
GDP (YoY)
% Change
2Q F
2.60
2.60
October 1, 2015
1:25PM
Germany PMI Manufacturing
Value
Sep F
52.50
52.50
6:00PM
US
Initial Jobless claims
Thousands
Sep 25
267.00
271.50
6:30AM
China
PMI Manufacturing
Value
Sep
49.70
49.70
2:00PM
UK
PMI Manufacturing
Value
Sep
51.50
51.30
October 2, 2015
6:00PM
US
Change in Nonfarm payrolls
Thousands
Sep
173.00
202.00
6:00PM
US
Unnemployment rate
%
Sep
5.10
5.10
October 5, 2015
1:25PM
Germany PMI Services
Value
Sep F
54.30
--
October 7, 2015
2:00PM
UK
Industrial Production (YoY)
% Change
Aug
0.80
--
October 8, 2015
4:30PM
UK
BOE Announces rates
% Ratio
Oct 8
0.50
0.50
October 9, 2015
India
Imports YoY%
% Change
Sep
(9.95)
--
India
Exports YoY%
% Change
Sep
(20.66)
--
October 12, 2015
5:30PM
India
Industrial Production YoY
% Change
Aug
4.20
--
October 13, 2015
2:00PM
UK
CPI (YoY)
% Change
Sep
--
--
China
Exports YoY%
% Change
Sep
(5.50)
--
October 14, 2015
2:00PM
UK
Jobless claims change
% Change
Sep
1.20
--
12:00PM
India
Monthly Wholesale Prices YoY%
% Change
Sep
(4.95)
--
7:00AM
China
Consumer Price Index (YoY)
% Change
Sep
2.00
--
October 15, 2015
6:00PM
US
Consumer price index (mom)
% Change
Sep
(0.10)
--
October 16, 2015
6:45PM
US
Industrial Production
%
Sep
(0.38)
--
2:30PM
Euro Zone Euro-Zone CPI (YoY)
%
Sep F
0.10
--
October 19, 2015
7:30AM
China
Industrial Production (YoY)
% Change
Sep
6.10
--
7:30AM
China
Real GDP (YoY)
% Change
3Q
7.00
--
October 20, 2015
6:00PM
US
Housing Starts
Thousands
Sep
1,126.00
--
6:00PM
US
Building permits
Thousands
Sep
1,161.00
--
October 22, 2015
7:30PM
US
Existing home sales
Million
Sep
5.31
--
5:15PM
Euro Zone ECB announces interest rates
%
Oct 22
0.05
--
Source: Bloomberg, Angel Research
Market Outlook
September 29, 2015
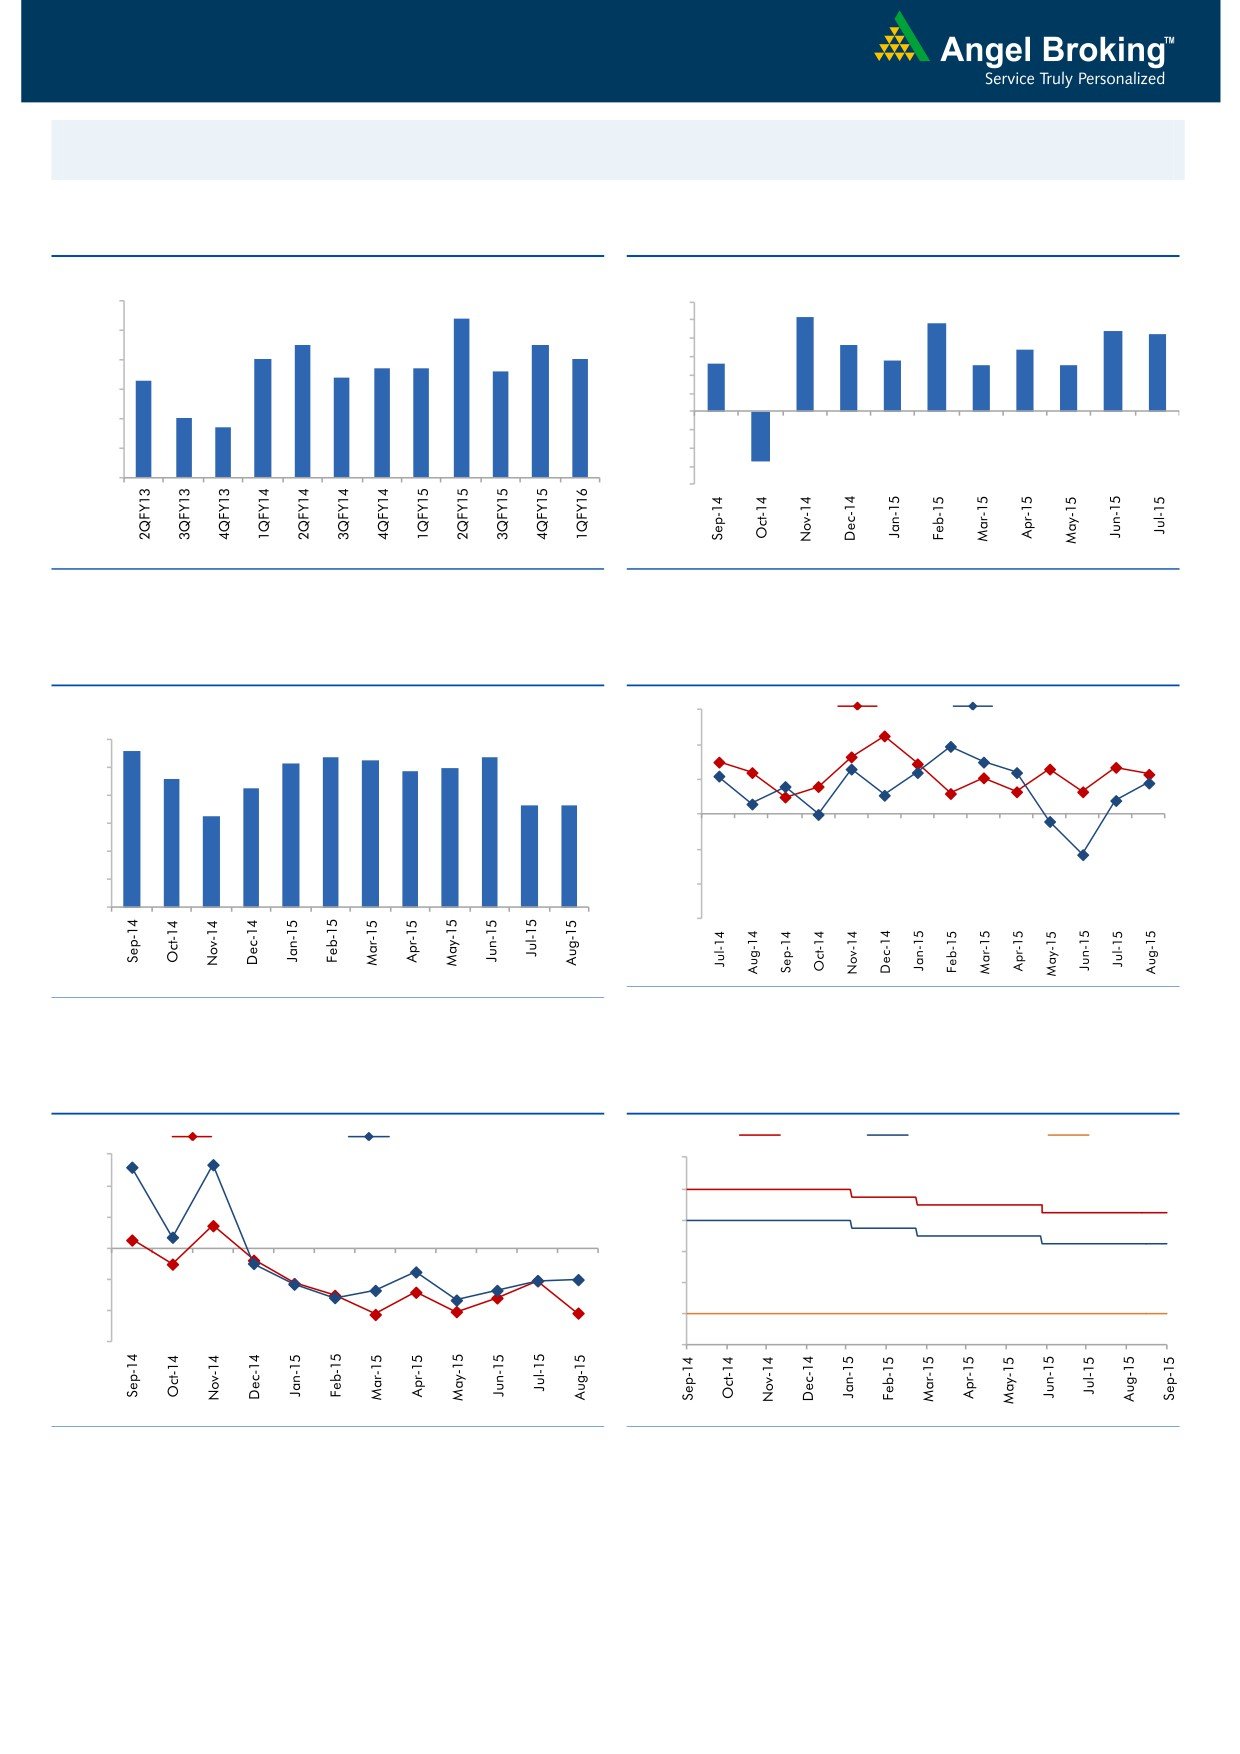
Macro watch
Exhibit 1: Quarterly GDP trends
Exhibit 2: IIP trends
(%)
(%)
9.0
8.4
6.0
5.2
4.8
4.4
4.2
5.0
8.0
7.5
7.5
3.6
3.4
7.0
7.0
4.0
6.7
6.7
2.6
2.8
2.5
2.5
6.6
3.0
7.0
6.3
6.4
2.0
6.0
1.0
5.0
4.7
-
5.0
(1.0)
4.0
(2.0)
(3.0)
3.0
(2.7)
(4.0)
Source: CSO, Angel Research
Source: MOSPI, Angel Research
Exhibit 3: Monthly CPI inflation trends
Exhibit 4: Manufacturing and services PMI
(%)
56.0
Mfg. PMI
Services PMI
5.6
6.0
5.4
5.3
5.4
54.0
5.2
5.0
4.9
4.6
5.0
4.3
52.0
3.7
3.7
4.0
3.3
50.0
3.0
2.0
48.0
1.0
46.0
-
44.0
Source: Market, Angel Research; Note: Level above 50 indicates expansion
Source: MOSPI, Angel Research
Exhibit 5: Exports and imports growth trends
Exhibit 6: Key policy rates
(%)
Exports yoy growth
Imports yoy growth
(%)
Repo rate
Reverse Repo rate
CRR
30.0
9.00
20.0
8.00
10.0
7.00
0.0
6.00
(10.0)
5.00
(20.0)
4.00
(30.0)
3.00
Source: Bloomberg, Angel Research
Source: RBI, Angel Research
Market Outlook
September 29, 2015
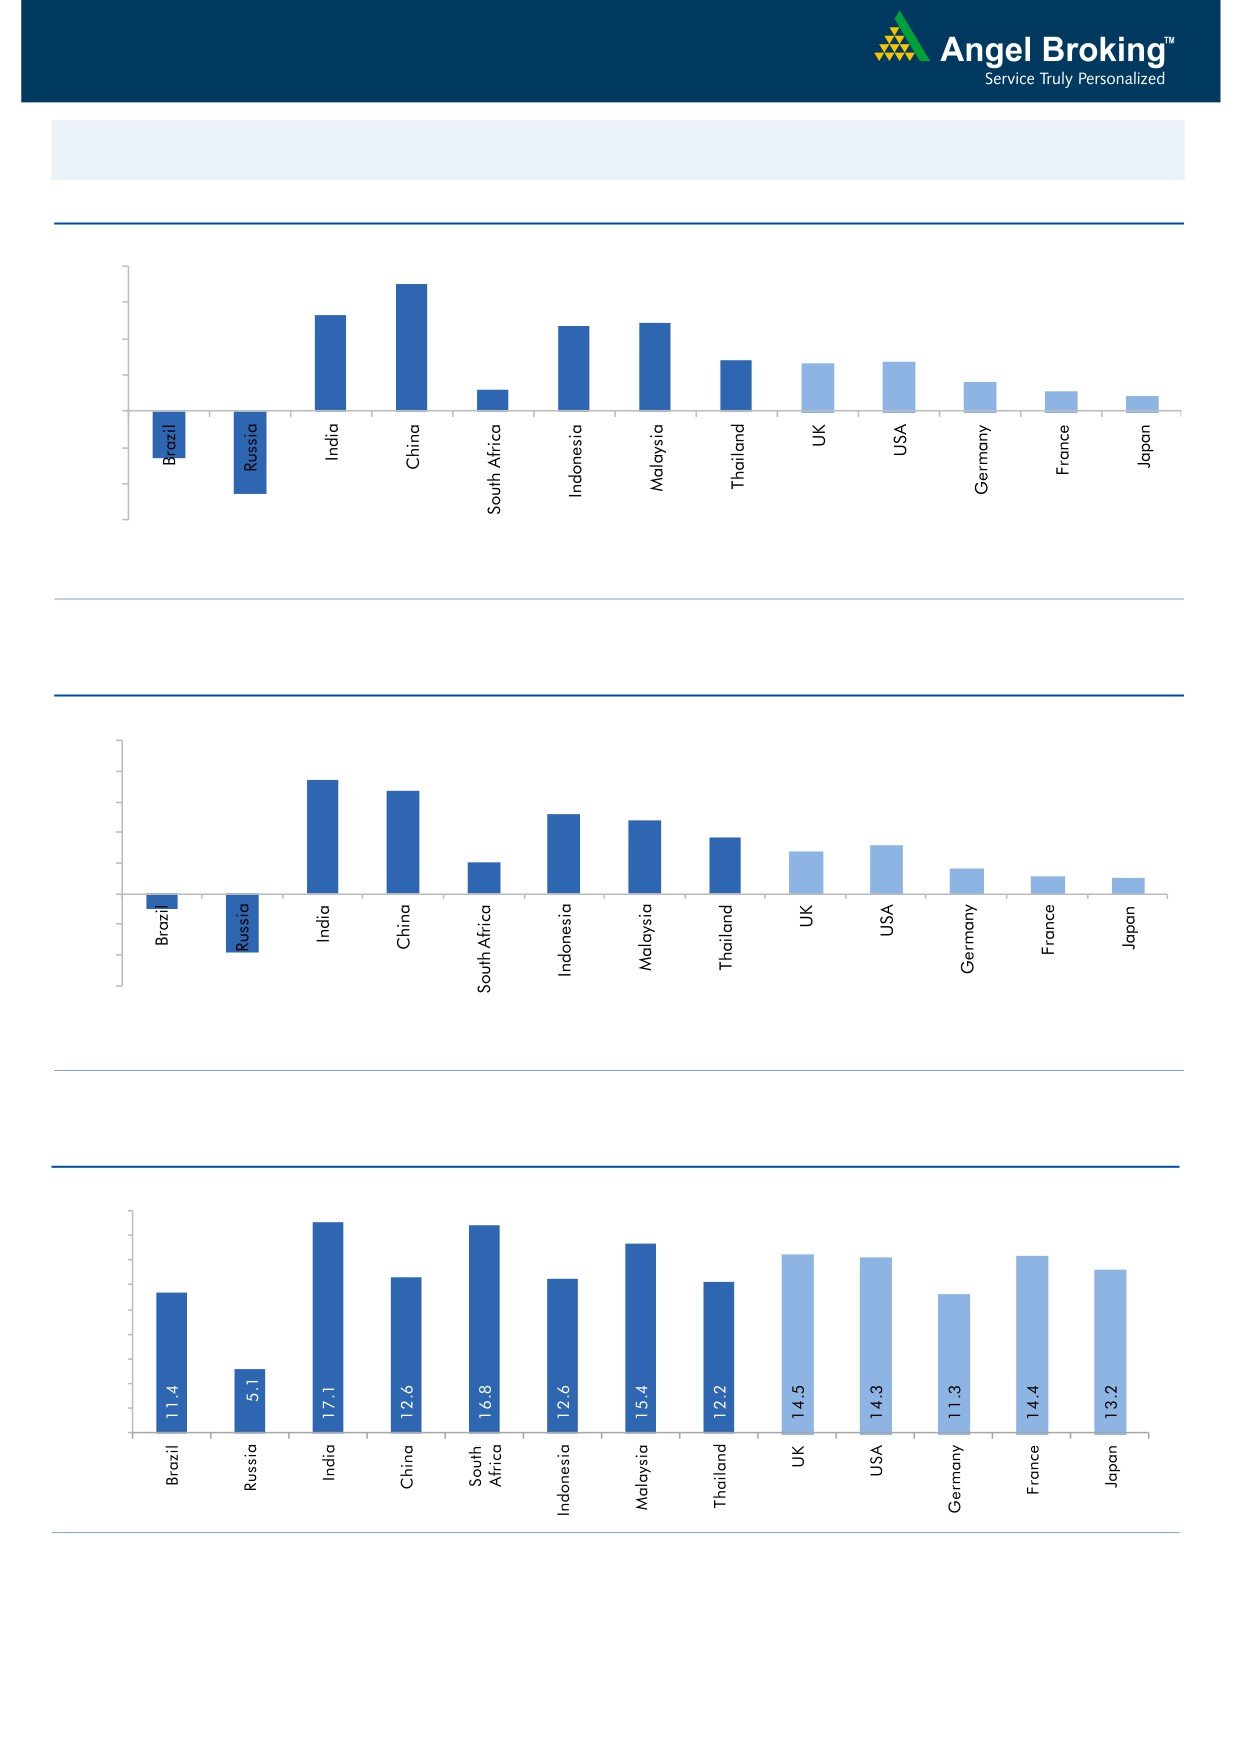
Global watch
Exhibit 1: Latest quarterly GDP Growth (%, yoy) across select developing and developed countries
(%)
8.0
7.0
5.3
6.0
4.9
4.7
4.0
2.8
2.6
2.7
1.6
2.0
1.2
1.1
0.8
(4.6)
(2.6)
-
(2.0)
(4.0)
(6.0)
Source: Bloomberg, Angel Research
Exhibit 2: 2015 GDP Growth projection by IMF (%, yoy) across select developing and developed countries
(%)
10.0
7.5
8.0
6.8
5.2
6.0
4.8
3.7
3.1
4.0
2.7
2.0
1.6
2.0
1.2
1.0
(3.8)
(1.0)
-
(2.0)
(4.0)
(6.0)
Source: IMF, Angel Research
Exhibit 3: One year forward P-E ratio across select developing and developed countries
(x)
18.0
16.0
14.0
12.0
10.0
8.0
6.0
4.0
2.0
-
Source: Bloomberg, Angel Research
Market Outlook
September 29, 2015
Exhibit 4: Relative performance of indices across globe
Returns (%)
Country
Name of index
Closing price
1M
3M
1YR
Brazil
Bovespa
43,957
(4.5)
(18.6)
(22.3)
Russia
Micex
1,616
(4.7)
(2.3)
12.6
India
Nifty
7,796
(1.1)
(7.0)
(3.9)
China
Shanghai Composite
3,101
4.6
(26.0)
34.4
South Africa
Top 40
44,242
3.2
(6.0)
(0.2)
Mexico
Mexbol
41,894
(1.0)
(6.3)
(6.7)
Indonesia
LQ45
680
(4.3)
(20.1)
(23.6)
Malaysia
KLCI
1,608
5.0
(7.1)
(12.9)
Thailand
SET 50
872
(1.6)
(12.8)
(16.4)
USA
Dow Jones
16,002
(1.7)
(10.8)
(6.3)
UK
FTSE
5,959
(0.3)
(10.0)
(10.0)
Japan
Nikkei
17,645
(4.8)
(15.4)
10.9
Germany
DAX
9,484
(8.1)
(13.4)
(0.1)
France
CAC
4,357
(6.5)
(9.0)
2.7
Source: Bloomberg, Angel Research
Market Outlook
September 29, 2015
Stock Watch
Company Name
Reco
CMP
Target
Mkt Cap
Sales ( Čcr )
OPM(%)
EPS (Č)
PER(x)
P/BV(x)
RoE(%)
EV/Sales(x)
(Č)
Price ( Č)
( Č cr )
FY16E FY17E
FY16E
FY17E
FY16E
FY17E
FY16E
FY17E
FY16E
FY17E
FY16E
FY17E
FY16E
FY17E
Agri / Agri Chemical
Rallis
Neutral
223
-
4,335
2,075
2,394
14.4
14.4
9.5
11.0
23.5
20.3
4.7
4.0
21.1
21.3
2.1
1.8
United Phosphorus
Accumulate
455
510
19,480
13,698
15,752
17.6
17.6
32.1
38.5
14.2
11.8
2.8
2.3
21.4
21.3
1.5
1.3
Auto & Auto Ancillary
Ashok Leyland
Accumulate
91
97
25,769
18,186
21,529
10.8
11.2
3.3
4.5
27.4
20.1
4.7
4.3
17.3
21.6
1.4
1.1
Bajaj Auto
Accumulate
2,276
2,438
65,857
23,544
27,245
19.8
19.8
127.0
143.4
17.9
15.9
5.4
4.7
30.3
29.4
2.4
2.0
Eicher Motors
Buy
17,283
22,859
46,909
11,681
15,550
15.3
16.9
358.5
564.3
48.2
30.6
14.5
10.8
29.8
34.9
3.9
2.9
Hero Motocorp
Accumulate
2,351
2,672
46,942
28,500
32,764
14.1
14.3
146.9
167.0
16.0
14.1
6.1
5.1
37.8
36.5
1.5
1.3
L G Balakrishnan & Bros Neutral
433
-
679
1,254
1,394
11.6
11.8
35.9
41.7
12.1
10.4
1.6
1.4
13.5
13.8
0.6
0.6
Mahindra and Mahindra Accumulate
1,221
1,383
75,860
38,337
43,069
13.0
13.4
52.9
63.5
23.1
19.2
3.5
3.1
15.0
15.9
1.6
1.4
Maruti
Neutral
4,533
-
136,936
58,102
68,587
16.7
16.9
182.0
225.5
24.9
20.1
5.0
4.2
19.9
21.0
2.1
1.8
Minda Industries
Buy
516
652
819
2,567
2,965
7.3
8.0
38.8
54.3
13.3
9.5
1.9
1.6
14.4
16.8
0.4
0.4
Rane Brake Lining
Buy
293
366
232
454
511
11.1
11.4
23.8
28.1
12.3
10.4
1.8
1.6
14.2
15.3
0.6
0.6
Setco Automotive
Neutral
230
-
615
594
741
12.7
13.7
8.4
15.8
27.4
14.6
2.8
2.5
10.4
16.9
1.5
1.2
Tata Motors
Neutral
285
-
82,357
264,038
297,882
13.8
13.9
34.5
38.9
8.3
7.3
1.4
1.2
17.6
16.8
0.5
0.5
TVS Motor
Neutral
232
-
11,005
11,702
13,713
6.8
7.7
10.1
14.5
22.9
16.0
5.6
4.5
24.5
28.3
0.9
0.8
Amara Raja Batteries
Neutral
980
-
16,731
5,101
6,224
17.8
17.6
31.1
39.2
31.5
25.0
7.8
6.2
24.8
24.8
3.2
2.6
Exide Industries
Neutral
156
-
13,239
7,363
8,247
13.7
14.5
6.6
7.7
23.6
20.2
3.0
2.7
12.6
13.3
1.5
1.4
Apollo Tyres
Neutral
183
-
9,313
12,576
12,978
16.8
16.1
22.3
19.9
8.2
9.2
1.4
1.2
17.2
13.4
0.8
0.9
Ceat
Neutral
1,258
-
5,088
6,041
6,597
14.3
14.2
101.5
116.6
12.4
10.8
2.5
2.1
20.0
19.1
1.0
0.9
JK Tyres
Neutral
101
-
2,283
7,446
7,669
15.2
14.0
19.6
18.4
5.1
5.5
1.3
1.1
25.2
19.5
0.7
0.6
Swaraj Engines
Neutral
870
-
1,080
593
677
14.5
14.8
51.2
60.8
17.0
14.3
4.0
3.5
23.3
24.8
1.7
1.4
Subros
Neutral
80
-
478
1,268
1,488
11.6
11.9
3.7
6.6
21.5
12.1
1.4
1.3
6.8
11.4
0.7
0.6
Indag Rubber
Neutral
174
-
458
283
329
17.0
17.2
13.0
15.4
13.5
11.3
2.9
2.4
21.8
21.6
1.3
1.1
Capital Goods
ACE
Neutral
37
-
363
660
839
4.7
8.2
1.0
3.9
36.7
9.4
1.2
1.0
3.2
11.3
0.7
0.6
BEML
Neutral
1,241
-
5,167
3,277
4,006
6.0
8.9
29.2
64.3
42.5
19.3
2.4
2.2
5.7
11.7
1.7
1.3
BGR Energy
Neutral
105
-
758
3,615
3,181
9.5
9.4
16.7
12.4
6.3
8.5
0.6
0.6
10.0
7.0
0.6
0.8
BHEL
Neutral
195
-
47,740
33,722
35,272
10.8
11.7
10.5
14.2
18.6
13.7
1.4
1.3
7.0
9.0
1.5
1.4
Blue Star
Buy
334
387
3,002
3,649
4,209
5.0
5.9
9.2
14.7
36.5
22.7
6.6
6.2
9.1
17.5
0.9
0.8
Crompton Greaves
Buy
171
204
10,742
13,484
14,687
4.9
6.2
4.5
7.1
38.1
24.1
2.7
2.5
7.2
10.8
0.9
0.8
Inox Wind
Buy
349
505
7,747
4,980
5,943
17.0
17.5
26.6
31.6
13.1
11.1
3.9
2.9
35.0
30.0
1.7
1.4
Market Outlook
September 29, 2015
Stock Watch
Company Name
Reco
CMP
Target
Mkt Cap
Sales ( Čcr )
OPM(%)
EPS (Č)
PER(x)
P/BV(x)
RoE(%)
EV/Sales(x)
(Č)
Price ( Č)
( Č cr )
FY16E
FY17E
FY16E
FY17E
FY16E
FY17E
FY16E
FY17E
FY16E
FY17E
FY16E
FY17E
FY16E
FY17E
Capital Goods
KEC International
Neutral
137
-
3,522
8,791
9,716
6.1
6.8
5.4
8.2
25.4
16.7
2.5
2.3
10.0
14.0
0.6
0.6
Thermax
Neutral
876
-
10,436
6,413
7,525
7.4
8.5
30.5
39.3
28.7
22.3
4.4
3.8
15.0
17.0
1.6
1.3
Cement
ACC
Buy
1,337
1,548
25,092
11,856
14,092
14.5
17.8
47.6
76.1
28.1
17.6
2.9
2.7
10.6
15.7
2.0
1.6
Ambuja Cements
Accumulate
203
233
31,504
10,569
12,022
20.7
22.2
8.7
10.7
23.3
19.0
3.0
2.8
13.0
15.2
2.6
2.3
India Cements
Buy
77
112
2,362
4,716
5,133
15.9
16.9
3.7
7.5
20.8
10.3
0.8
0.7
3.8
7.3
0.8
0.7
JK Cement
Buy
629
767
4,394
4,056
4,748
14.5
17.0
22.6
41.1
27.8
15.3
2.5
2.2
9.3
15.3
1.5
1.3
J K Lakshmi Cement
Buy
370
430
4,351
2,947
3,616
16.7
19.9
11.5
27.2
32.2
13.6
3.1
2.6
9.8
20.8
1.9
1.5
Mangalam Cements
Neutral
221
-
589
1,053
1,347
10.5
13.3
8.4
26.0
26.3
8.5
1.1
1.0
4.3
12.5
0.9
0.7
Orient Cement
Buy
157
183
3,217
1,854
2,524
21.2
22.2
7.7
11.1
20.4
14.2
2.9
2.5
13.3
15.7
2.5
1.7
Ramco Cements
Accumulate
319
350
7,589
4,036
4,545
20.8
21.3
15.1
18.8
21.1
17.0
2.6
2.3
12.9
14.3
2.4
2.1
Shree Cement^
Neutral
11,347
-
39,528
7,150
8,742
26.7
28.6
228.0
345.5
49.8
32.8
7.3
6.1
15.7
20.3
5.3
4.2
UltraTech Cement
Buy
2,719
3,282
74,611
27,562
31,548
20.4
22.3
111.9
143.3
24.3
19.0
3.5
3.0
15.2
16.8
2.8
2.4
Construction
ITNL
Neutral
97
-
2,396
7,360
8,825
34.0
35.9
1.0
5.0
97.1
19.4
0.4
0.4
0.3
1.4
3.8
3.7
KNR Constructions
Neutral
540
-
1,519
915
1,479
14.3
13.9
20.3
37.2
26.6
14.5
2.4
2.1
9.6
15.6
1.8
1.1
Larsen & Toubro
Buy
1,430
2,013
133,094
68,920
82,446
10.9
11.5
57.0
73.0
25.1
19.6
2.3
2.1
13.6
15.5
2.2
1.8
Gujarat Pipavav Port
Neutral
181
-
8,758
721
784
53.1
53.6
8.2
9.1
22.0
19.9
3.6
2.9
20.0
18.3
11.7
10.4
MBL Infrastructures
Buy
247
360
1,025
2,313
2,797
12.2
14.6
19.0
20.0
13.0
12.4
1.4
1.3
11.3
10.6
1.2
1.0
Nagarjuna Const.
Neutral
69
-
3,858
7,892
8,842
8.3
9.1
2.4
5.3
28.9
13.1
1.2
1.1
4.2
8.6
0.7
0.6
PNC Infratech
Neutral
485
-
2,488
1,798
2,132
13.2
13.5
22.0
30.0
22.1
16.2
2.0
1.8
11.5
11.4
1.5
1.3
Simplex Infra
Neutral
262
-
1,295
6,241
7,008
10.4
10.7
20.0
36.0
13.1
7.3
1.1
1.0
6.8
11.1
0.7
0.6
Financials
Allahabad Bank
Neutral
77
-
4,405
8,438
9,521
2.8
2.8
21.9
27.0
3.5
2.9
0.4
0.3
10.2
11.5
-
-
Axis Bank
Buy
507
701
120,507
26,941
32,298
3.5
3.6
37.4
46.4
13.6
10.9
2.7
2.4
18.7
20.0
-
-
Bank of Baroda
Neutral
184
-
40,658
19,027
21,737
1.9
2.0
16.9
24.5
10.9
7.5
1.0
0.9
9.1
12.1
-
-
Bank of India
Neutral
136
-
9,029
16,438
18,706
1.9
2.0
19.2
40.9
7.1
3.3
0.4
0.3
4.5
9.1
-
-
Canara Bank
Neutral
278
-
14,333
15,491
17,269
2.0
2.0
61.6
70.9
4.5
3.9
0.5
0.5
10.5
11.1
-
-
Dena Bank
Neutral
40
-
2,253
3,498
3,977
2.1
2.3
7.8
10.7
5.2
3.8
0.4
0.3
6.5
8.4
-
-
Federal Bank
Neutral
64
-
10,996
3,527
4,135
3.0
3.1
5.2
6.7
12.3
9.6
1.3
1.2
10.8
12.7
-
-
HDFC
Neutral
1,173
-
185,052
10,883
12,799
3.5
3.4
43.0
50.6
27.3
23.2
5.4
4.9
25.9
26.7
-
-
HDFC Bank
Buy
1,046
1,255
263,516
38,059
46,851
4.4
4.5
50.0
62.7
20.9
16.7
3.7
3.1
18.8
20.2
-
-
Market Outlook
September 29, 2015
Stock Watch
Company Name
Reco
CMP
Target
Mkt Cap
Sales ( Čcr )
OPM(%)
EPS (Č)
PER(x)
P/BV(x)
RoE(%)
EV/Sales(x)
(Č)
Price ( Č)
( Č cr )
FY16E
FY17E
FY16E
FY17E
FY16E
FY17E
FY16E
FY17E
FY16E
FY17E
FY16E
FY17E
FY16E
FY17E
Financials
ICICI Bank
Buy
269
370
155,963
35,810
41,871
3.4
3.5
22.0
26.2
12.2
10.3
2.1
1.8
15.0
15.6
-
-
IDBI Bank
Neutral
79
-
12,679
9,860
10,978
1.8
1.9
9.3
15.6
8.5
5.1
0.6
0.5
6.4
10.1
-
-
Indian Bank
Neutral
133
-
6,393
6,267
7,171
2.4
2.5
25.4
32.1
5.2
4.2
0.4
0.4
8.0
9.3
-
-
LIC Housing Finance
Buy
424
570
21,393
2,934
3,511
2.3
2.3
30.9
36.8
13.7
11.5
2.2
1.9
16.8
17.5
-
-
Oriental Bank
Neutral
131
-
3,930
7,730
8,595
2.4
2.5
38.8
47.4
3.4
2.8
0.3
0.3
8.6
9.8
-
-
Punjab Natl.Bank
Neutral
135
-
25,018
23,446
26,624
2.8
2.9
17.8
27.5
7.6
4.9
0.8
0.6
8.5
12.1
-
-
South Ind.Bank
Neutral
23
-
3,105
1,930
2,215
2.4
2.4
2.6
3.6
8.9
6.4
0.9
0.8
9.9
12.5
-
-
St Bk of India
Buy
240
307
181,249
83,847
96,307
2.8
2.8
20.1
25.1
11.9
9.5
1.3
1.2
11.5
13.1
-
-
Union Bank
Neutral
179
-
11,403
12,755
14,439
2.3
2.4
31.5
39.9
5.7
4.5
0.6
0.5
9.9
11.6
-
-
Vijaya Bank
Neutral
34
-
2,947
3,594
3,969
1.8
1.9
5.8
7.1
5.9
4.8
0.5
0.5
8.2
9.3
-
-
Yes Bank
Buy
730
953
30,551
7,204
9,078
3.2
3.2
57.8
69.5
12.6
10.5
2.3
1.9
19.6
22.6
-
-
FMCG
Asian Paints
Neutral
797
-
76,448
16,553
19,160
16.0
16.2
17.7
21.5
45.1
37.1
12.0
10.8
29.4
31.2
4.5
3.8
Britannia
Neutral
2,915
-
34,978
8,065
9,395
9.6
10.2
47.2
65.5
61.8
44.5
20.5
19.4
38.3
41.2
4.2
3.6
Colgate
Neutral
949
-
25,802
4,836
5,490
19.5
19.7
48.5
53.2
19.6
17.8
14.3
12.5
99.8
97.5
5.2
4.6
Dabur India
Neutral
275
-
48,304
9,370
10,265
17.1
17.2
7.3
8.1
37.5
33.9
11.3
9.2
33.7
30.6
5.1
4.6
GlaxoSmith Con*
Neutral
6,070
-
25,528
4,919
5,742
17.2
17.4
168.3
191.2
36.1
31.8
10.2
8.7
28.8
28.9
4.8
4.0
Godrej Consumer
Neutral
1,170
-
39,842
10,168
12,886
16.1
16.1
32.1
38.4
36.5
30.5
7.4
6.8
19.7
21.0
4.0
3.2
HUL
Neutral
793
-
171,507
34,940
38,957
17.5
17.7
20.8
24.7
38.1
32.1
42.4
33.9
110.5
114.2
4.7
4.2
ITC
Buy
319
409
256,045
41,068
45,068
37.8
37.4
13.9
15.9
22.9
20.1
7.7
6.8
34.1
33.8
5.9
5.3
Marico
Neutral
398
-
25,671
6,551
7,766
15.7
16.0
10.4
12.5
38.3
31.8
11.1
9.3
33.2
32.4
3.8
3.2
Nestle*
Accumulate
6,203
6,646
59,803
11,291
12,847
22.2
22.3
158.9
184.6
39.0
33.6
20.4
18.4
55.0
57.3
5.1
4.5
Tata Global
Accumulate
127
144
8,015
8,635
9,072
9.8
9.9
6.5
7.6
19.6
16.7
2.0
1.9
6.8
7.4
0.9
0.8
IT
HCL Tech^
Buy
950
1,132
133,583
42,038
47,503
23.5
23.5
56.4
62.9
16.8
15.1
3.9
3.0
23.2
19.8
2.8
2.3
Infosys
Buy
1,108
1,306
254,547
60,250
66,999
28.0
28.0
58.3
63.7
19.0
17.4
4.0
3.4
20.9
19.7
3.5
3.0
TCS
Buy
2,590
3,168
507,379
108,420
123,559
28.8
28.7
127.2
143.9
20.4
18.0
8.1
7.5
39.9
41.8
4.3
3.7
Tech Mahindra
Accumulate
574
646
55,240
25,566
28,890
16.0
17.0
26.3
31.9
21.8
18.0
3.9
3.3
17.9
18.6
1.9
1.6
Wipro
Buy
593
719
146,337
52,414
58,704
23.7
23.8
38.4
42.3
15.4
14.0
3.0
2.7
19.5
18.0
2.4
2.0
Media
D B Corp
Accumulate
319
356
5,860
2,241
2,495
27.8
27.9
21.8
25.6
14.7
12.5
3.8
3.4
26.7
28.5
2.6
2.3
HT Media
Neutral
83
-
1,925
2,495
2,603
11.2
11.2
7.3
8.6
11.3
9.6
0.9
0.8
7.4
8.1
0.3
0.3
Market Outlook
September 29, 2015
Stock Watch
Company Name
Reco
CMP
Target
Mkt Cap
Sales ( Čcr )
OPM(%)
EPS (Č)
PER(x)
P/BV(x)
RoE(%)
EV/Sales(x)
(Č)
Price ( Č)
( Č cr )
FY16E FY17E
FY16E
FY17E
FY16E
FY17E
FY16E
FY17E
FY16E
FY17E
FY16E
FY17E
FY16E
FY17E
Media
Jagran Prakashan
Accumulate
143
156
4,662
1,939
2,122
26.0
26.0
8.3
9.2
17.2
15.5
2.9
2.7
17.5
17.1
2.4
2.1
Sun TV Network
Neutral
357
-
14,065
2,779
3,196
70.2
70.5
22.8
27.3
15.7
13.1
3.9
3.5
26.7
28.3
4.8
4.2
Hindustan Media
Buy
231
292
1,698
920
1,031
20.0
20.0
19.2
20.9
12.1
11.1
2.0
1.7
16.4
15.3
1.4
1.2
Ventures
Metals & Mining
Coal India
Buy
310
400
195,586
72,015
78,415
21.2
21.5
21.7
25.3
14.3
12.3
4.8
4.8
33.1
39.1
1.9
1.8
Hind. Zinc
Neutral
138
-
58,183
15,258
16,495
44.2
45.6
17.6
19.2
7.8
7.2
1.2
1.1
15.9
15.3
1.5
1.1
Hindalco
Neutral
71
-
14,589
104,356
111,186
8.7
9.5
6.7
11.1
10.5
6.4
0.4
0.4
3.5
5.9
0.7
0.6
JSW Steel
Neutral
866
-
20,926
48,125
53,595
18.8
21.0
46.9
97.5
18.5
8.9
0.9
0.8
4.4
9.5
1.3
1.1
NMDC
Neutral
94
-
37,110
8,237
10,893
46.6
44.5
10.0
11.7
9.4
8.0
1.1
0.9
12.5
13.0
4.3
3.3
SAIL
Neutral
52
-
21,291
45,915
53,954
7.2
10.5
1.5
4.4
34.2
11.8
0.5
0.5
2.3
4.1
1.1
1.0
Vedanta
Neutral
91
-
27,038
71,445
81,910
26.2
26.3
12.9
19.2
7.1
4.8
0.5
0.4
7.2
8.9
0.8
0.6
Tata Steel
Neutral
209
-
20,342
136,805
149,228
11.3
11.9
26.4
36.8
7.9
5.7
0.6
0.6
6.0
8.0
0.7
0.6
Oil & Gas
Cairn India
Neutral
148
-
27,663
11,323
12,490
49.4
51.0
20.7
20.7
7.1
7.2
0.5
0.4
6.4
6.1
1.5
0.9
GAIL
Neutral
292
-
37,052
64,856
70,933
9.1
9.6
24.0
28.9
12.2
10.1
1.0
1.0
8.8
9.6
0.8
0.7
ONGC
Neutral
225
-
192,670
154,564
167,321
36.8
37.4
28.6
32.5
7.9
6.9
1.0
0.9
12.7
13.5
1.4
1.4
Petronet LNG
Buy
179
210
13,440
39,007
40,785
3.8
4.2
9.2
11.0
19.6
16.3
2.2
2.0
11.6
12.7
0.4
0.4
Indian Oil Corp
Accumulate
399
455
96,839
359,607
402,760
5.9
6.1
42.5
48.7
9.4
8.2
1.3
1.1
14.1
14.4
0.4
0.3
Reliance Industries
Accumulate
834
930
270,198
313,085
362,904
13.1
13.8
78.4
92.9
10.7
9.0
1.1
1.0
10.8
11.6
1.3
1.2
Pharmaceuticals
Alembic Pharma
Neutral
684
-
12,888
2,601
3,115
21.2
20.2
20.8
23.9
32.9
28.6
10.6
8.0
37.2
31.8
5.0
4.1
Aurobindo Pharma
Buy
745
872
43,482
14,923
17,162
23.0
23.0
38.2
43.6
19.5
17.1
6.0
4.5
36.0
30.2
3.3
2.8
Aventis*
Neutral
4,157
-
9,573
2,156
2,455
15.1
16.8
109.7
133.9
37.9
31.0
5.2
4.3
18.4
22.5
4.1
3.5
Cadila Healthcare
Neutral
2,068
-
42,335
10,224
11,840
20.0
21.0
71.0
85.6
29.1
24.2
7.8
6.2
30.1
28.5
4.2
3.6
Cipla
Neutral
642
-
51,567
14,359
16,884
21.3
19.7
28.4
30.5
22.6
21.1
4.0
3.4
19.3
17.5
3.6
3.0
Dr Reddy's
Neutral
4,192
-
71,478
18,213
21,214
22.6
22.7
163.0
192.5
25.7
21.8
5.3
4.4
22.5
20.0
3.9
3.3
Dishman Pharma
Neutral
310
-
2,502
1,716
1,888
20.2
20.2
16.3
21.6
19.0
14.4
1.8
1.6
9.7
11.7
1.6
1.4
GSK Pharma*
Neutral
3,312
-
28,050
2,870
3,158
20.0
22.1
59.5
68.3
55.7
48.5
16.4
16.9
28.5
34.3
9.3
8.5
Indoco Remedies
Neutral
323
-
2,979
1,088
1,262
18.2
18.2
13.1
15.5
24.7
20.9
4.8
4.0
21.2
21.1
2.8
2.4
Ipca labs
Neutral
766
-
9,663
3,507
4,078
17.6
18.6
25.8
32.0
29.7
23.9
3.8
3.3
13.8
14.9
3.0
2.6
Lupin
Neutral
2,034
-
91,524
14,864
17,244
26.9
26.9
62.1
71.1
32.8
28.6
8.0
6.3
27.4
24.6
5.9
4.9
Sun Pharma
Accumulate
861
950
207,146
28,163
32,610
25.8
30.7
17.4
26.9
49.5
32.0
4.7
4.1
13.0
16.6
6.8
5.7
Market Outlook
September 29, 2015
Stock Watch
Company Name
Reco
CMP
Target
Mkt Cap
Sales ( Čcr )
OPM(%)
EPS (Č)
PER(x)
P/BV(x)
RoE(%)
EV/Sales(x)
(Č)
Price ( Č)
( Č cr )
FY16E FY17E
FY16E
FY17E
FY16E
FY17E
FY16E
FY17E
FY16E
FY17E
FY16E
FY17E
FY16E
FY17E
Power
Tata Power
Neutral
66
-
17,715
35,923
37,402
22.6
22.8
4.1
5.2
16.2
12.7
1.2
1.2
7.5
9.3
1.4
1.3
NTPC
Buy
121
157
99,853
87,064
98,846
23.5
23.5
11.7
13.2
10.4
9.2
1.2
1.1
11.4
12.1
2.2
1.9
Power Grid
Buy
127
170
66,258
20,702
23,361
86.7
86.4
12.1
13.2
10.5
9.6
1.5
1.4
15.6
15.1
8.1
7.6
Telecom
Bharti Airtel
Neutral
327
-
130,855
101,748
109,191
32.1
31.7
12.0
12.5
27.3
26.2
1.9
1.8
6.9
6.7
1.9
1.7
Idea Cellular
Neutral
143
-
51,345
34,282
36,941
32.0
31.5
5.9
6.2
24.2
23.0
2.2
2.0
9.9
9.3
2.1
2.0
zOthers
Abbott India
Neutral
5,700
-
12,112
2,715
3,153
14.5
14.1
134.3
152.2
42.5
37.4
10.6
8.7
27.4
25.6
4.2
3.5
Bajaj Electricals
Buy
247
341
2,490
4,719
5,287
5.2
5.8
8.6
12.7
28.8
19.5
3.3
2.9
11.4
14.8
0.5
0.5
Finolex Cables
Neutral
232
-
3,544
2,728
3,036
10.8
11.0
14.4
16.8
16.1
13.8
2.4
2.1
15.2
15.3
1.0
0.9
Goodyear India*
Buy
556
655
1,283
1,953
1,766
12.4
12.0
67.4
59.6
8.3
9.3
2.1
1.8
27.7
20.2
0.4
0.4
Hitachi
Neutral
1,336
-
3,632
1,806
2,112
9.0
9.2
28.6
29.1
46.7
45.9
11.6
9.4
28.1
22.6
2.1
1.8
Jyothy Laboratories
Neutral
305
-
5,532
1,620
1,847
11.5
11.5
7.3
8.5
41.9
36.1
5.4
5.0
13.3
14.4
3.3
2.8
MRF
Accumulate
41,127
43,575
17,443
20,727
14,841
19.3
18.6
4,905.8
3,351.9
8.4
12.3
2.7
2.2
37.6
19.6
0.8
1.1
Page Industries
Neutral
13,137
-
14,652
1,929
2,450
19.8
20.1
229.9
299.0
57.1
43.9
25.2
17.5
52.1
47.1
7.6
6.0
Relaxo Footwears
Neutral
530
-
6,357
1,767
2,152
12.3
12.5
19.3
25.1
27.5
21.1
6.8
5.2
27.7
27.8
3.7
3.0
Siyaram Silk Mills
Buy
960
1,221
900
1,653
1,873
11.7
12.2
99.3
122.1
9.7
7.9
1.7
1.5
19.5
20.2
0.7
0.6
Styrolution ABS India*
Neutral
742
-
1,305
1,271
1,440
8.6
9.2
32.0
41.1
23.2
18.1
2.4
2.1
10.7
12.4
1.0
0.9
Tree House
Buy
328
449
1,387
259
324
56.8
56.8
17.0
21.7
19.3
15.1
1.9
1.7
10.1
11.5
5.3
4.4
TVS Srichakra
Buy
2,594
3,210
1,986
2,127
2,388
15.2
14.9
237.7
267.5
10.9
9.7
4.6
3.3
51.7
39.8
1.0
0.8
HSIL
Accumulate
272
302
1,965
2,182
2,404
16.3
16.5
15.8
18.9
17.2
14.4
1.4
1.3
8.4
9.4
1.2
1.1
Kirloskar Engines India
Neutral
284
-
4,106
2,634
3,252
10.1
12.0
10.9
17.4
26.0
16.3
2.9
2.6
11.4
16.8
1.2
0.9
Ltd
M M Forgings
Buy
544
797
657
563
671
22.1
22.9
51.0
66.5
10.7
8.2
2.2
1.8
23.1
24.1
1.3
1.1
Banco Products (India)
Neutral
117
-
836
1,208
1,353
11.0
12.3
10.8
14.5
10.9
8.1
1.2
1.1
11.9
14.5
0.7
0.6
Competent Automobiles Neutral
151
-
93
1,007
1,114
3.1
3.1
23.7
28.2
6.4
5.3
0.9
0.8
13.9
14.6
0.1
0.1
Nilkamal
Accumulate
950
1,005
1,418
1,948
2,147
10.6
10.3
60.0
67.0
15.8
14.2
2.5
2.1
16.8
16.1
0.8
0.7
Visaka Industries
Buy
127
166
201
1,158
1,272
8.6
9.5
23.7
32.7
5.4
3.9
0.5
0.5
10.1
12.5
0.3
0.3
Transport Corporation of
Buy
239
293
1,814
2,830
3,350
8.8
9.0
14.4
18.3
16.6
13.0
2.6
2.2
15.4
17.1
0.8
0.7
India
Elecon Engineering
Buy
71
87
768
1,452
1,596
14.0
14.7
4.4
6.2
16.0
11.3
1.3
1.2
8.6
11.2
0.8
0.7
Surya Roshni
Buy
123
183
537
2,992
3,223
8.3
8.5
14.7
18.3
8.3
6.7
0.8
0.7
9.8
11.0
0.5
0.4
MT Educare
Buy
128
169
510
286
366
18.3
17.7
7.7
9.4
16.6
13.7
3.5
3.1
20.2
21.1
1.7
1.3
Market Outlook
September 29, 2015
Stock Watch
Company Name
Reco
CMP
Target Mkt Cap
Sales ( Čcr )
OPM(%)
EPS (Č)
PER(x)
P/BV(x)
RoE(%)
EV/Sales(x)
(Č)
Price ( Č)
( Č cr )
FY16E FY17E FY16E FY17E FY16E FY17E FY16E FY17E FY16E FY17E FY16E FY17E FY16E FY17E
zOthers
Radico Khaitan
Buy
84
112
1,113
1,565
1,687
11.9
12.4
5.4
6.6
15.5
12.7
1.2
1.1
8.0
9.0
1.2
1.2
Garware Wall Ropes
Buy
328
390
718
875
983
10.4
10.6
23.1
27.8
14.2
11.8
2.0
1.7
14.1
14.8
0.8
0.7
Wonderla Holidays
Accumulate
287
322
1,621
206
308
44.0
43.6
9.0
12.9
31.9
22.2
4.4
4.0
13.7
17.8
7.8
5.2
Linc Pen & Plastics
Buy
151
185
223
340
371
8.3
8.9
10.8
13.2
14.0
11.4
2.2
2.0
16.0
17.1
0.7
0.6
The Byke Hospitality
Accumulate
160
181
643
222
287
20.5
20.5
5.6
7.6
28.4
21.2
5.4
4.4
18.9
20.8
2.9
2.3
Source: Company, Angel Research; Note: *December year end; #September year end; &October year end; Price as on September 28, 2015
Market Outlook
September 29, 2015
Research Team Tel: 022 - 39357800
DISCLAIMER
Angel Broking Private Limited (hereinafter referred to as “Angel”) is a registered Member of National Stock Exchange of India Limited,
Bombay Stock Exchange Limited and MCX Stock Exchange Limited. It is also registered as a Depository Participant with CDSL and
Portfolio Manager with SEBI. It also has registration with AMFI as a Mutual Fund Distributor. Angel Broking Private Limited is a registered
entity with SEBI for Research Analyst in terms of SEBI (Research Analyst) Regulations, 2014 vide registration number INH000000164.
Angel or its associates has not been debarred/ suspended by SEBI or any other regulatory authority for accessing /dealing in securities
Market. Angel or its associates including its relatives/analyst do not hold any financial interest/beneficial ownership of more than 1% in
the company covered by Analyst. Angel or its associates/analyst has not received any compensation / managed or co-managed public
offering of securities of the company covered by Analyst during the past twelve months. Angel/analyst has not served as an officer,
director or employee of company covered by Analyst and has not been engaged in market making activity of the company covered by
Analyst.
This document is solely for the personal information of the recipient, and must not be singularly used as the basis of any investment
decision. Nothing in this document should be construed as investment or financial advice. Each recipient of this document should make
such investigations as they deem necessary to arrive at an independent evaluation of an investment in the securities of the companies
referred to in this document (including the merits and risks involved), and should consult their own advisors to determine the merits and
risks of such an investment.
Reports based on technical and derivative analysis center on studying charts of a stock's price movement, outstanding positions and
trading volume, as opposed to focusing on a company's fundamentals and, as such, may not match with a report on a company's
fundamentals.
The information in this document has been printed on the basis of publicly available information, internal data and other reliable sources
believed to be true, but we do not represent that it is accurate or complete and it should not be relied on as such, as this document is for
general guidance only. Angel Broking Pvt. Limited or any of its affiliates/ group companies shall not be in any way responsible for any
loss or damage that may arise to any person from any inadvertent error in the information contained in this report. Angel Broking Pvt.
Limited has not independently verified all the information contained within this document. Accordingly, we cannot testify, nor make any
representation or warranty, express or implied, to the accuracy, contents or data contained within this document. While Angel Broking
Pvt. Limited endeavors to update on a reasonable basis the information discussed in this material, there may be regulatory, compliance,
or other reasons that prevent us from doing so.
This document is being supplied to you solely for your information, and its contents, information or data may not be reproduced,
redistributed or passed on, directly or indirectly.
Neither Angel Broking Pvt. Limited, nor its directors, employees or affiliates shall be liable for any loss or damage that may arise from or
in connection with the use of this information.
Note: Please refer to the important ‘Stock Holding Disclosure' report on the Angel website (Research Section). Also, please refer to the
latest update on respective stocks for the disclosure status in respect of those stocks. Angel Broking Pvt. Limited and its affiliates may have
investment positions in the stocks recommended in this report.