Market Outlook
June 29, 2016
Market Cues
Domestic Indices
Chg (%)
(Pts)
(Close)
Indian markets are expected to open in green tracing SGX Nifty and Global cues.
BSE Sensex
0.5
122
26,525
Nifty
0.4
33
8,128
US markets closed more than 1.5% up yesterday, lifted by gains in oil prices, as
investors looked for bargains post the Brexit sell-off. Analysts also pointed to
Mid Cap
0.5
55
11,459
improvement in sentiment after initial fears of significant negative spillover from the
Small Cap
0.8
90
11,540
U.K. vote to leave the European Union. Energy gained over 2.6% and financials
Bankex
0.3
61
20,090
closed nearly 2.5% higher to lead all S&P sectors higher.
After 2 days of turmoil in the wake of Brexit vote, European Markets eased as most
Global Indices
Chg (%)
(Pts)
(Close)
of the indices rose by ~2% at yesterday’s close. Recovery at FTSE was seen mostly
Dow Jones
1.6
269
17,410
across sectors that had been hit the most in last 2 trading sessions, i.e. Banks,
Nasdaq
2.1
97
4,692
Property & Airline stocks. Shares of gold miners, which performed well on Monday
FTSE
2.6
158
6,140
were amongst the biggest losers as Gold prices weekened.
Nikkei
0.1
14
15,323
Indian indices gained strength in last couple of hours of trade on Tuesday, as most
Hang Seng
(0.3)
(55)
20,172
of their European counterparts were up by ~2%. FMCG and HDFC Group stocks led
Shanghai Com
0.6
17
2,913
the support to market. Broader markets also participated in the rally as BSE Midcap
and Smallcap indices were up 0.5-0.8%.
Advances / Declines
BSE
NSE
News Analysis
Advances
1,610
1,043
ITC to invest `4,000cr to set up to 9 plants
Declines
1,010
530
Pay panel award likely today
Detailed analysis on Pg2
Unchanged
180
66
Investor’s Ready Reckoner
Volumes (` Cr)
Key Domestic & Global Indicators
BSE
2,635
Stock Watch: Latest investment recommendations on 150+ stocks
NSE
17,067
Refer Pg6 onwards
Top Picks
Net Inflows (` Cr)
Net
Mtd
Ytd
CMP
Target
Upside
Company
Sector
Rating
FII
(69)
3,763
18,132
(`)
(`)
(%)
Amara Raja
Auto/Auto Ancillary
Buy
862
1,076
24.9
MFs
298
633
10,064
HCL Tech
IT
Buy
713
1,000
40.2
LIC Housing
Financials
Buy
498
592
18.9
Top Gainers
Price (`)
Chg (%)
Bharat Electronics
Capital Goods
Accumulate
1,249
1,414
13.2
Deltacorp
98
9.4
Navkar Corporation Others
Buy
219
265
21.1
Adanient
81
7.9
More Top Picks on Pg4
Punjlloyd
21
7.3
Key Upcoming Events
Godrejprop
359
7.2
Previous
Consensus
Gmdcltd
76
6.8
Date
Region
Event Description
Reading
Expectations
June 29 US
Initial Jobless claims
259.0
267.0
Top Losers
Price (`)
Chg (%)
June 30 Euro zone
Euro zone Consumer Confidence
(7.3)
(7.3)
June 30 UK
PMI Manufacturing
50.1
50.1
Mphasis
574
(3.9)
July 01 UK
GDP (YoY)
2.1
2.0
Justdial
600
(3.8)
6.(
More Events on Pg5
Iifl
220
(3.4)
Renuka
17
(3.4)
Aloktext
4
(3.1)
As on June 28, 2016
Market Outlook
June 29, 2016
ITC to invest `4,000cr to set up to 9 plants
ITC has announced that it will invest `4,000cr over the next 2-3 years to set up 8-9
factories across the country towards manufacture of Food Products. ITC's branded
packaged foods division grew by ~11% to clock sales of `7,097cr in FY2016.
Food is the second largest business for ITC after cigarettes. ITC recently expanded
its new Sunfeast Farmlite biscuits portfolio, which caters to the health conscious
consumers, and is looking to tap this fast growing consumer segment. Health
segment of the biscuit market is ~1% of industry now, but is the fastest growing
segment. Management highlighted that their approach is to have a full portfolio
across the segments, as they see this as a big play panning out within the segment,
going forward.
In order to avoid any product quality issues, management claims that the health
benefits are validated by their in-house labs and research centre based at
Bengaluru. The company had recently launched Sugar release control Aashirvaad
Atta for people who have sugar issue, where the claim is backed by in-house lab.
Sunfeast Farmlite biscuits also have multiple variants in Oats range (Oats with
Almonds, Oats with Raisins and Oats with Chocolate). The company entered into
dairy segment with Ghee in October last year and launched dairy whitener in
North East this month. The company is claiming to test waters with all the products
at the pan India level in the long-run.
The proposed capex, recent product launches when coupled with wide distribution
network augurs well for ITC’s long-term growth prospects. We maintain
ACCUMULATE rating on the stock with price target of `380.
Pay panel award likely today
Union Cabinet is expected to consider recommendations of 7th Pay Commission
today. 7th Pay Commission announced 23.55% increase in pay and allowances of
serving central government employees and 24% increase in pension of the retired
officers (over 1cr government employees and pensioners would get benefitted).
Pay panel in Nov-15 recommended 14.27% hike in Basic pay at junior levels,
lowest in last 70 years. The previous 6th Pay Commission recommended 20% hike
which the government doubled while implementing it in 2008. After considering
the increase proposed in allowances, the hike in remunerations comes to 23.55%.
Committee of Secretaries, which is tasked with reviewing the recommendations,
has given its report and post implementation of such hike from Jan 1, 2016, the
total outgo is pegged at `1.02lakh cr.
This announcement in the backdrop of expected strong monsoons, in our view
could boost consumer demand, thereby benefitting most of the consumption and
consumer discretionary related companies.
We expect companies like Bluestar, Voltas, Bajaj Electrical to be the key
beneficiaries from any such announcement. We continue to maintain BUY rating
on these 3 stocks.
Market Outlook
June 29, 2016
Economic and Political News
Centre spends 22% more on MGNREGS in FY16
Govt procures 1.19 lakh tn of pulses to cool prices
Apparel export may fall 5% on global slowdown
Corporate News
SBI to sell non-core assets to raise `3k cr
United Bank gets shareholders' nod to raise `1,000cr
Mumbai Metro faces financial crisis
Market Outlook
June 29, 2016
Top Picks
Large Cap
M
arket Cap
CM
P
T
arget
Upsid
e
Company
Rationale
(` Cr)
(`)
(`)
(%)
To outpace battery industry growth due to better technological
Amara Raja Batteries
14,717
862
1,076
24.9
products leading to market share gains in both the automotive
OEM and replacement segments.
Uptick in defense capex by government, coupled with BELs
Bharat Electronics
29,974
1,249
1,414
13.2
strong market positioning, indicate good times ahead for BEL.
HCL Tech
1,00,643
713
1,000
40.2
Stock is trading at attractive valuations & factors all bad news.
Strong visibility for a robust 20% earnings trajectory, coupled
HDFC Bank
2,95,669
1,168
1,262
8.1
with high quality of earnings on account of high quality retail
business and strategic focus on highly rated corporates.
Back on the growth trend, expect a long term growth of 14% to
Infosys
2,66,687
1,161
1,374
18.3
be a US$20bn in FY2020.
Continues to grow its retail loan book at healthy pace with
LIC Housing Finance
25,115
498
592
18.9
improvement in asset quality. Expect LICHF to post a healthy
loan book which is likely to reflect in a strong earnings growth.
Huge bid pipeline of re-development works at Delhi and other
NBCC
11,550
193
220
14.3
State Governments and opportunity from Smart City, positions
NBCC to report strong growth, going forward.
Strong market positioning within the domestic AC markets to
Voltas
10,378
314
407
29.8
continue, EMP business set to revive
Source: Company, Angel Research
Mid Cap
M
arket Cap
CM
P
T
arget
Upsid
e
Company
Rationale
(` Cr)
(`)
(`)
(%)
Among the top 4 players in the consumer durables segment.
Bajaj Electricals
2,240
222
268
20.9
Improved profitability backed by turn around in E&P segment.
Strong order book lends earnings visibility.
Favourable outlook for AC industry to augur well for Cooling
Blue Star
3,778
420
495
17.9
products business. EMPPAC division's profitability to improve
once operating environment turns around.
With a focus on the low and medium income (LMI) consumer
Dewan Housing
5,897
202
270
33.6
segment, the company has increased its presence in tier-II & III
cities where the growth opportunity is immense.
Strong loan growth backed by diversified loan portfolio and
Equitas Holdings
5,706
170
235
38.1
adequate CAR. ROE & ROA likely to remain decent as risk of
dilution remains low. Attractive valuations considering growth.
Commencement of new projects, downtrend in the interest rate
IL&FS Transport
2,415
73
93
26.7
cycle, to lead to stock re-rating
Economic recovery to have favourable impact on advertising &
circulation revenue growth. Further, the acquisition of a radio
Jagran Prakashan
5,526
169
205
21.3
business (Radio City) would also boost the company's revenue
growth.
Speedier execution and speedier sales, strong revenue visibility
Mahindra Lifespace
1,857
453
554
22.4
in short-to-long run, attractive valuations
Massive capacity expansion along with rail advantage at ICD
Navkar Corporation
3,120
219
265
21.1
as well CFS augurs well for the company
Earnings boost on back of stable material prices and
Radico Khaitan
1,218
92
125
36.5
favourable pricing environment. Valuation discount to peers
provides additional comfort
Strong brands and distribution network would boost growth
Siyaram Silk Mills
1,006
1,073
1,347
25.5
going ahead. Stock currently trades at an inexpensive
valuation.
Source: Company, Angel Research
Market Outlook
June 29, 2016
Key Upcoming Events
Global economic events release calendar
Bloomberg Data
Date
Time
Country
Event Description
Unit
Period
Last Reported
Estimated
Jun 29, 2016
6:00 PM
US
Initial Jobless claims
Thousands Jun 25
259.00
267.00
Jun 30, 2016
2:30 PM Euro Zone
Euro-Zone Consumer Confidence
Value
Jun F
-7.30
(7.30)
1:25 PM Germany
Unemployment change (000's)
Thousands
Jun
-11.00
(5.00)
2:00 PM
UK
PMI Manufacturing
Value
Jun
50.10
50.10
Jul 01, 2016
2:00 PM
UK
GDP (YoY)
% Change
1Q F
2.10
2.00
1:25 PM Germany
PMI Manufacturing
Value
Jun F
54.40
54.40
6:30 AM
China
PMI Manufacturing
Value
Jun
50.10
12:00 AM
July 05, 2016
1:25 PM Germany
PMI Services
Value
Jun F
53.20
July 07, 2016
2:00 PM
UK
Industrial Production (YoY)
% Change
May
1.60
Jul 08, 2016
India
Imports YoY%
% Change
Jun
-13.20
India
Exports YoY%
% Change
Jun
-0.80
6:00 PM
US
Change in Nonfarm payrolls
Thousands
Jun
38.00
180.00
6:00 PM
US
Unnemployment rate
%
Jun
4.70
4.80
Jul 10, 2016
7:00 AM
China
Consumer Price Index (YoY)
% Change
Jun
2.00
1.90
Jul 12, 2016
5:30 PM
India
Industrial Production YoY
% Change
May
(0.80)
Jul 13, 2016
4:30 PM
UK
BOE Announces rates
% Ratio
Jul 14
0.50
Jul 14, 2016
China
Exports YoY%
% Change
Jun
(4.10)
US
Producer Price Index (mom)
% Change
Jun
0.50
12:00 PM
India
Monthly Wholesale Prices YoY%
% Change
Jun
0.79
Source: Bloomberg, Angel Research
Market Outlook
June 29, 2016
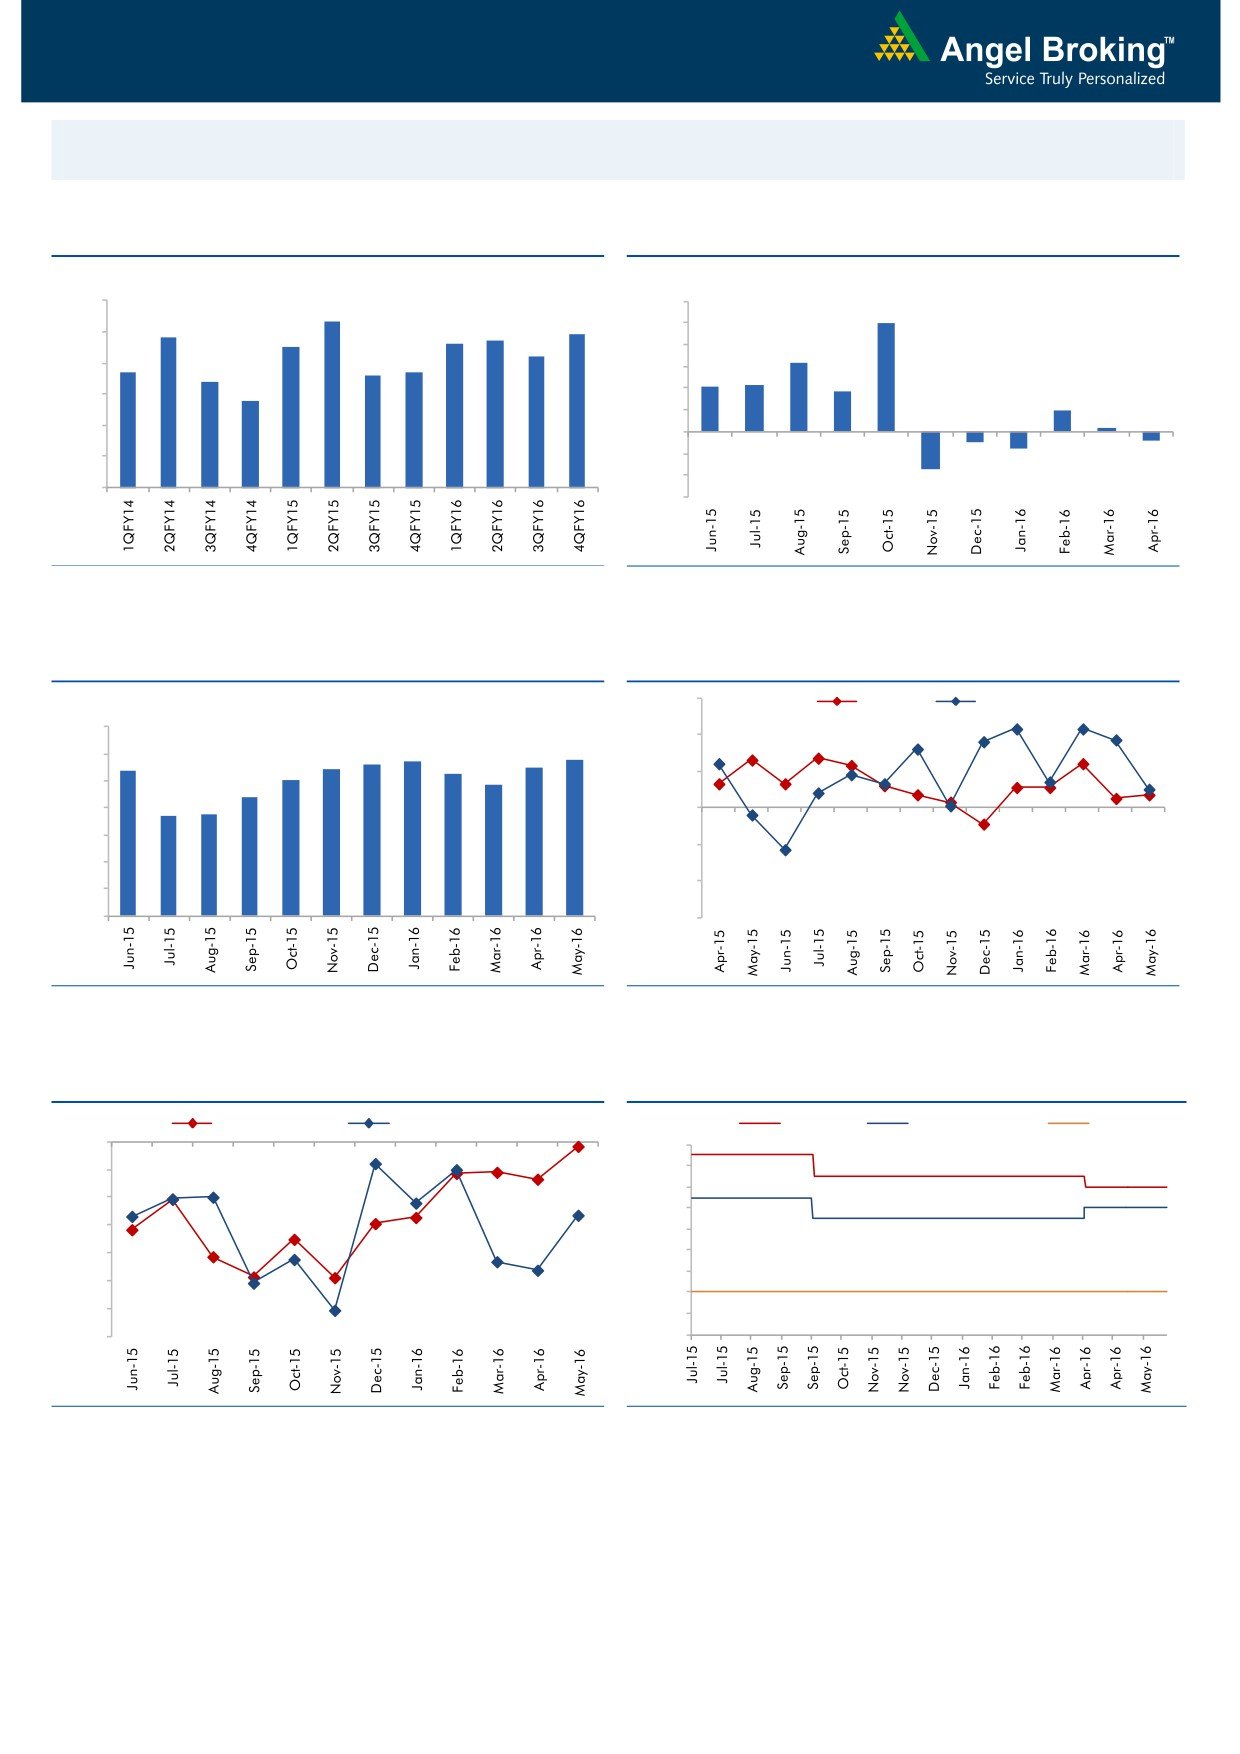
Macro watch
Exhibit 1: Quarterly GDP trends
Exhibit 2: IIP trends
(%)
(%)
9.0
12.0
8.3
9.9
7.8
7.7
7.9
10.0
8.0
7.5
7.6
7.2
8.0
6.3
6.7
6.6
6.7
7.0
6.4
6.0
4.2
4.3
3.7
5.8
4.0
6.0
2.0
2.0
0.3
5.0
-
4.0
(2.0)
(0.9)
(0.8)
(1.6)
(4.0)
3.0
(3.4)
(6.0)
Source: CSO, Angel Research
Source: MOSPI, Angel Research
Exhibit 3: Monthly CPI inflation trends
Exhibit 4: Manufacturing and services PMI
56.0
Mfg. PMI
Services PMI
(%)
7.0
54.0
5.6
5.7
5.8
5.4
5.4
5.5
6.0
5.3
5.0
4.8
52.0
5.0
4.4
3.7
3.7
4.0
50.0
3.0
48.0
2.0
46.0
1.0
-
44.0
Source: MOSPI, Angel Research
Source: Market, Angel Research; Note: Level above 50 indicates expansion
Exhibit 5: Exports and imports growth trends
Exhibit 6: Key policy rates
(%)
Exports yoy growth
Imports yoy growth
(%)
Repo rate
Reverse Repo rate
CRR
0.0
7.50
(5.0)
7.00
6.50
(10.0)
6.00
(15.0)
5.50
(20.0)
5.00
4.50
(25.0)
4.00
(30.0)
3.50
(35.0)
3.00
Source: Bloomberg, Angel Research
Source: RBI, Angel Research
Market Outlook
June 29, 2016
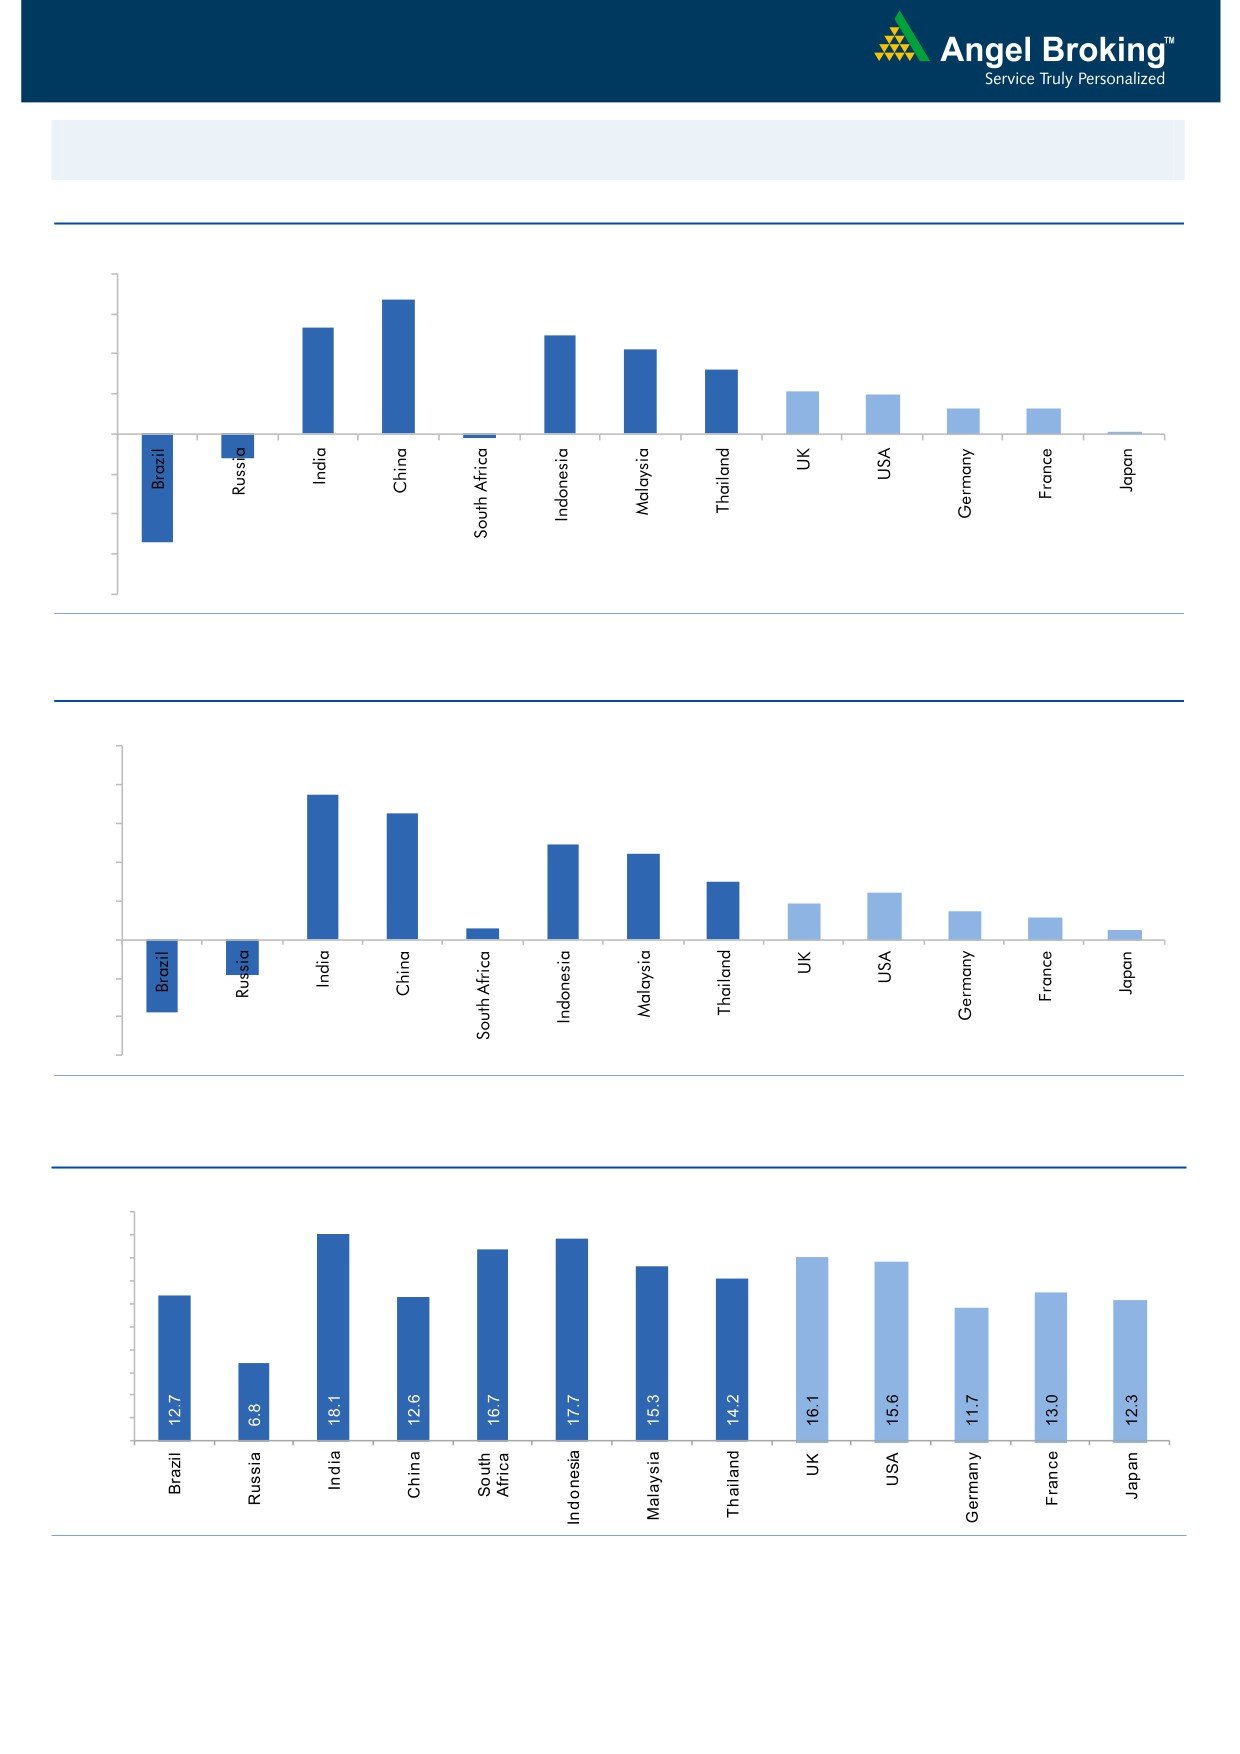
Global watch
Exhibit 1: Latest quarterly GDP Growth (%, yoy) across select developing and developed countries
(%)
8.0
6.7
6.0
5.3
4.9
4.2
4.0
3.2
2.1
2.0
2.0
1.3
1.3
0.1
-
(2.0)
(4.0)
(1.2)
(6.0)
(0.2)
(5.4)
(8.0)
Source: Bloomberg, Angel Research
Exhibit 2: 2016 GDP Growth projection by IMF (%, yoy) across select developing and developed countries
(%)
10.0
7.5
8.0
6.5
6.0
4.9
4.4
4.0
3.0
2.4
1.9
1.5
2.0
1.1
0.6
0.5
(3.8)
(1.8)
-
(2.0)
(4.0)
(6.0)
Source: IMF, Angel Research
Exhibit 3: One year forward P-E ratio across select developing and developed countries
(x)
20.0
18.0
16.0
14.0
12.0
10.0
8.0
6.0
4.0
2.0
-
Source: IMF, Angel Research
Market Outlook
June 29, 2016
Exhibit 4: Relative performance of indices across globe
Returns (%)
Country
Name of index
Closing price
1M
3M
1YR
Brazil
Bovespa
50,007
1.9
(1.6)
(7.2)
Russia
Micex
1,857
(3.0)
(0.5)
12.9
India
Nifty
8,128
(0.4)
5.3
(3.0)
China
Shanghai Composite
2,913
3.9
(1.6)
(38.7)
South Africa
Top 40
45,107
(5.7)
(3.2)
(4.1)
Mexico
Mexbol
44,715
(3.1)
(3.2)
(0.8)
Indonesia
LQ45
834
1.9
1.8
(1.5)
Malaysia
KLCI
1,634
0.2
(4.0)
(5.7)
Thailand
SET 50
905
0.2
1.8
(8.7)
USA
Dow Jones
17,410
(2.3)
(1.3)
(1.2)
UK
FTSE
6,140
(2.0)
0.6
(7.1)
Japan
Nikkei
15,323
(9.0)
(9.3)
(23.3)
Germany
DAX
9,447
(8.2)
(4.5)
(14.9)
France
CAC
4,089
(9.4)
(8.0)
(11.2)
Source: Bloomberg, Angel Research
Stock Watch
June 29, 2016
Company Name
Reco
CMP
Target
Mkt Cap
Sales ( Čcr )
OPM(%)
EPS (Č)
PER(x)
P/BV(x)
RoE(%)
EV/Sales(x)
(Č)
Price ( Č)
( Č cr )
FY16E FY17E
FY16E
FY17E
FY16E
FY17E
FY16E
FY17E
FY16E
FY17E
FY16E
FY17E
FY16E
FY17E
Agri / Agri Chemical
Rallis
Neutral
220
-
4,284
1,612
1,911
13.3
13.3
7.4
9.5
29.8
23.2
4.8
4.3
16.7
18.4
2.6
2.2
United Phosphorus
Accumulate
547
684
23,430
13,083
15,176
18.5
18.5
31.5
37.4
17.4
14.6
3.5
2.9
21.4
21.4
2.2
1.8
Auto & Auto Ancillary
Ashok Leyland
Neutral
99
-
28,174
17,995
21,544
11.4
11.6
3.4
4.7
29.1
21.1
5.1
4.7
17.7
22.2
1.6
1.3
Bajaj Auto
Neutral
2,626
-
75,994
22,709
25,860
20.9
20.1
129.0
143.6
20.4
18.3
6.2
5.4
30.7
29.4
2.9
2.5
Bharat Forge
Buy
742
875
17,263
7,351
8,318
19.9
19.7
31.2
36.5
23.8
20.3
4.3
3.6
19.3
19.2
2.5
2.2
Eicher Motors
Accumulate
19,166
20,044
52,058
15,556
16,747
15.5
17.3
464.8
597.5
41.2
32.1
15.1
11.1
36.2
34.3
3.2
2.9
Gabriel India
Accumulate
91
101
1,312
1,415
1,544
8.7
9.0
4.6
5.4
19.9
16.9
3.6
3.2
18.1
18.9
0.9
0.8
Hero Motocorp
Neutral
3,026
-
60,415
28,244
30,532
15.5
15.9
156.7
168.5
19.3
18.0
7.7
6.5
39.9
36.4
2.1
1.9
Jamna Auto Industries Neutral
170
-
1,354
1,281
1,473
11.2
11.5
7.6
9.2
22.3
18.4
5.6
4.6
25.4
25.2
1.1
0.9
L G Balakrishnan & Bros Neutral
455
-
714
1,254
1,394
11.6
11.8
35.9
41.7
12.7
10.9
1.7
1.5
13.5
13.8
0.7
0.6
Mahindra and Mahindra Neutral
1,408
-
87,472
38,416
42,904
13.7
13.9
54.8
63.4
25.7
22.2
4.0
3.5
15.4
15.8
1.8
1.6
Maruti
Neutral
4,074
-
123,060
57,865
68,104
16.4
16.7
176.3
225.5
23.1
18.1
4.5
3.8
19.4
21.2
2.0
1.6
Minda Industries
Neutral
1,154
-
1,832
2,523
2,890
8.7
9.0
55.0
65.4
21.0
17.7
4.1
3.3
19.3
18.7
0.8
0.7
Motherson Sumi
Accumulate
278
313
36,812
39,343
45,100
8.8
9.1
10.1
12.5
27.6
22.3
8.7
6.8
35.3
34.4
1.0
0.9
Rane Brake Lining
Buy
380
465
301
454
511
11.5
12.0
25.2
31.0
15.1
12.3
2.3
2.0
14.9
16.6
0.8
0.7
Setco Automotive
Neutral
48
-
646
594
741
12.7
13.7
1.7
3.2
28.4
15.1
3.0
2.6
10.4
16.9
1.3
1.1
Tata Motors
Neutral
440
-
127,138
259,686
273,957
13.0
13.4
25.9
29.5
17.0
14.9
2.2
1.9
8.0
9.0
0.7
0.7
TVS Motor
Accumulate
297
330
14,115
11,263
13,122
6.9
8.5
9.2
15.0
32.3
19.8
7.4
5.9
22.7
29.6
1.2
1.0
Amara Raja Batteries
Buy
862
1,076
14,717
4,690
5,429
17.5
17.5
28.5
35.3
30.3
24.4
7.0
5.8
23.1
25.9
3.0
2.6
Exide Industries
Neutral
167
-
14,165
6,950
7,784
14.4
14.8
6.6
7.3
25.3
22.8
3.2
2.9
12.6
12.8
1.6
1.5
Apollo Tyres
Buy
148
183
7,544
12,056
12,714
17.2
16.4
23.0
20.3
6.4
7.3
1.1
1.0
17.7
13.6
0.7
0.7
Ceat
Buy
814
1,119
3,294
6,041
6,597
14.1
13.7
99.5
111.9
8.2
7.3
1.6
1.4
19.6
18.5
0.8
0.6
JK Tyres
Neutral
87
-
1,978
7,446
7,669
15.2
14.0
19.6
18.4
4.5
4.7
1.1
0.9
25.2
19.5
0.7
0.6
Swaraj Engines
Neutral
1,148
-
1,426
552
630
14.2
14.7
44.6
54.1
25.8
21.2
6.0
5.4
23.2
25.6
2.3
2.0
Subros
Neutral
89
-
535
1,293
1,527
11.8
11.9
4.2
6.7
21.2
13.3
1.6
1.5
7.7
11.5
0.7
0.6
Indag Rubber
Neutral
181
-
474
283
329
17.0
17.2
13.0
15.4
13.9
11.7
3.0
2.5
21.8
21.6
1.5
1.2
Capital Goods
ACE
Neutral
46
-
456
660
839
4.7
8.2
1.0
3.9
46.1
11.8
1.4
1.3
3.2
11.3
0.8
0.6
BEML
Buy
840
1,157
3,497
3,277
4,006
6.0
8.9
36.2
64.3
23.2
13.1
1.6
1.5
5.7
11.7
1.1
0.9
Bharat Electronics
Buy
1,249
1,414
29,974
7,295
8,137
20.0
16.8
56.5
58.7
22.1
21.3
3.3
2.9
42.1
44.6
3.0
2.5
Stock Watch
June 29, 2016
Company Name
Reco
CMP
Target
Mkt Cap
Sales ( Čcr )
OPM(%)
EPS (Č)
PER(x)
P/BV(x)
RoE(%)
EV/Sales(x)
(Č)
Price ( Č)
( Č cr )
FY16E
FY17E
FY16E
FY17E
FY16E
FY17E
FY16E
FY17E
FY16E
FY17E
FY16E
FY17E
FY16E
FY17E
Capital Goods
Voltas
Buy
314
407
10,378
5,857
6,511
7.5
7.9
11.7
12.9
26.8
24.3
4.4
3.8
17.1
16.7
1.9
1.7
BGR Energy
Neutral
111
-
804
3,615
3,181
9.5
9.4
16.7
12.4
6.7
9.0
0.6
0.6
10.0
7.0
0.6
0.8
BHEL
Neutral
119
-
29,175
33,722
35,272
10.8
11.7
10.5
14.2
11.4
8.4
0.8
0.8
7.0
9.0
0.9
0.9
Blue Star
Buy
420
495
3,778
3,770
4,351
5.7
6.4
11.4
17.2
36.8
24.5
5.7
5.3
18.4
23.1
1.0
0.9
Crompton Greaves
Neutral
71
-
4,472
13,484
14,687
4.9
6.2
4.5
7.1
15.9
10.1
1.1
1.1
7.2
10.8
0.5
0.4
Greaves Cotton
Neutral
136
-
3,329
1,655
1,755
16.6
16.8
7.4
7.8
18.4
17.5
3.7
3.5
21.1
20.6
2.0
1.9
Inox Wind
Buy
231
286
5,123
4,406
5,605
15.5
15.7
20.4
24.8
11.3
9.3
2.6
1.9
27.9
25.9
1.3
1.0
KEC International
Neutral
139
-
3,577
8,791
9,716
6.1
6.8
5.4
8.2
25.8
17.0
2.6
2.4
10.0
14.0
0.6
0.6
Thermax
Neutral
810
-
9,651
6,413
7,525
7.4
8.5
30.5
39.3
26.6
20.6
4.1
3.6
15.0
17.0
1.4
1.1
VATech Wabag
Neutral
586
-
3,192
2,722
3,336
7.9
8.1
19.5
24.6
30.0
23.8
3.2
2.8
11.1
12.4
1.3
1.1
Cement
ACC
Neutral
1,599
-
30,028
13,151
14,757
16.4
18.3
63.9
83.4
25.0
19.2
3.2
3.0
13.3
16.1
2.0
1.7
Ambuja Cements
Neutral
252
-
39,092
11,564
12,556
19.4
20.7
8.9
10.1
28.3
24.9
3.5
3.4
12.8
13.8
2.7
2.5
HeidelbergCement
Neutral
111
-
2,509
1,772
1,926
13.3
15.4
1.0
3.0
110.7
36.9
2.8
2.6
2.6
7.9
1.9
1.7
India Cements
Neutral
104
-
3,182
4,216
4,840
18.0
19.5
4.0
9.9
25.9
10.5
1.0
1.0
4.0
9.5
1.0
0.8
JK Cement
Neutral
659
-
4,608
3,661
4,742
10.1
15.8
7.5
28.5
87.9
23.1
2.6
2.3
7.5
22.9
1.6
1.2
J K Lakshmi Cement
Neutral
387
-
4,550
2,947
3,616
16.7
19.9
11.5
27.2
33.6
14.2
3.2
2.8
9.8
20.8
1.8
1.4
Mangalam Cements
Neutral
305
-
814
1,053
1,347
10.5
13.3
8.4
26.0
36.3
11.7
1.5
1.4
4.3
12.5
1.1
0.8
Orient Cement
Neutral
175
-
3,591
1,854
2,524
21.2
22.2
7.7
11.1
22.8
15.8
3.3
2.8
13.3
15.7
2.6
1.8
Ramco Cements
Neutral
570
-
13,574
4,036
4,545
20.8
21.3
15.1
18.8
37.8
30.3
4.6
4.1
12.9
14.3
3.5
3.0
Shree Cement^
Neutral
14,177
-
49,389
7,150
8,742
26.7
28.6
228.0
345.5
62.2
41.0
9.2
7.7
15.7
20.3
6.4
5.1
UltraTech Cement
Neutral
3,400
-
93,317
24,669
29,265
18.2
20.6
82.0
120.0
41.5
28.3
4.5
3.9
11.3
14.7
3.6
3.1
Construction
ITNL
Buy
73
93
2,415
7,360
8,682
34.0
32.2
7.0
8.6
10.5
8.5
0.4
0.4
3.2
2.5
3.7
3.5
KNR Constructions
Neutral
528
-
1,486
937
1,470
14.3
14.0
44.2
38.6
12.0
13.7
2.4
2.1
15.4
15.4
1.8
1.2
Larsen & Toubro
Buy
1,473
1,700
137,294
58,870
65,708
8.3
10.3
42.0
53.0
35.1
27.8
2.4
2.2
8.8
11.2
2.5
2.3
Gujarat Pipavav Port
Neutral
161
-
7,800
629
684
51.0
52.2
6.4
5.9
25.2
27.4
3.3
3.1
15.9
12.7
11.8
10.7
MBL Infrastructures
Buy
117
285
485
2,313
2,797
12.2
14.6
19.0
20.0
6.2
5.9
0.6
0.6
11.3
10.6
0.9
0.8
Nagarjuna Const.
Neutral
73
-
4,031
7,892
8,842
8.8
9.1
3.0
5.3
24.2
13.7
1.2
1.1
5.0
8.5
0.7
0.6
PNC Infratech
Neutral
550
-
2,821
1,873
2,288
13.2
13.5
24.0
32.0
22.9
17.2
2.2
2.0
12.1
12.3
1.6
1.3
Simplex Infra
Neutral
266
-
1,318
5,955
6,829
10.3
10.5
16.0
31.0
16.7
8.6
0.9
0.8
5.3
9.9
0.7
0.6
Stock Watch
June 29, 2016
Company Name
Reco
CMP
Target
Mkt Cap
Sales ( Čcr )
OPM(%)
EPS (Č)
PER(x)
P/BV(x)
RoE(%)
EV/Sales(x)
(Č)
Price ( Č)
( Č cr )
FY16E
FY17E
FY16E
FY17E
FY16E
FY17E
FY16E
FY17E
FY16E
FY17E
FY16E
FY17E
FY16E
FY17E
Construction
Power Mech Projects
Neutral
531
-
781
1,539
1,801
12.8
12.7
59.0
72.1
9.0
7.4
1.4
1.1
18.6
16.8
0.6
0.5
Sadbhav Engineering
Accumulate
278
298
4,772
3,186
3,598
10.2
10.3
8.0
9.0
34.8
30.9
3.2
2.8
9.4
9.9
1.8
1.6
NBCC
Accumulate
193
220
11,550
5,838
7,428
6.0
7.9
5.2
8.2
37.0
23.5
1.2
0.9
21.9
28.2
1.8
1.3
MEP Infra
Neutral
40
-
649
1,956
1,876
28.1
30.5
1.3
3.0
30.7
13.3
6.4
4.3
21.2
32.8
1.7
1.7
SIPL
Neutral
97
-
3,427
675
1,042
62.4
64.7
-
-
3.6
4.2
-
-
16.7
11.3
Engineers India
Neutral
203
-
6,847
1,667
1,725
13.5
16.0
9.7
11.4
21.0
17.8
2.5
2.4
11.7
13.4
2.7
2.7
Financials
Allahabad Bank
Neutral
68
-
4,931
8,569
9,392
2.8
2.9
16.3
27.5
4.2
2.5
0.4
0.3
7.6
11.9
-
-
Axis Bank
Neutral
515
-
122,870
26,204
29,738
3.6
3.5
34.5
35.4
14.9
14.5
2.4
2.1
16.8
14.9
-
-
Bank of Baroda
Neutral
154
-
35,565
18,802
21,088
2.0
2.2
(7.4)
13.0
11.9
1.2
1.0
(4.2)
7.3
-
-
Bank of India
Neutral
100
-
9,317
15,972
17,271
1.9
2.0
15.3
33.4
6.5
3.0
0.3
0.3
3.6
7.6
-
-
Canara Bank
Neutral
215
-
11,693
15,441
16,945
2.0
2.1
46.6
70.4
4.6
3.1
0.4
0.4
8.0
11.2
-
-
Dena Bank
Neutral
39
-
2,608
3,440
3,840
2.1
2.3
7.3
10.0
5.4
3.9
0.4
0.3
6.1
7.9
-
-
Dewan Housing Finance Buy
202
270
5,897
1,828
2,225
2.9
3.0
24.9
29.7
8.1
6.8
1.3
1.1
15.1
16.1
-
-
Equitas Holdings
Buy
170
235
5,706
679
1,076
12.4
11.7
6.2
6.7
27.5
25.4
3.4
2.5
13.3
12.5
-
-
Federal Bank
Neutral
56
-
9,613
3,279
3,787
2.8
2.9
3.9
5.5
14.2
10.1
1.2
1.1
8.4
10.8
-
-
HDFC
Neutral
1,229
-
194,301
10,358
11,852
3.3
3.3
41.1
47.0
29.9
26.1
5.7
5.2
24.7
24.9
-
-
HDFC Bank
Accumulate
1,168
1,262
295,669
38,606
47,696
4.4
4.5
48.8
61.4
23.9
19.0
4.1
3.5
18.7
20.0
-
-
ICICI Bank
Neutral
233
-
135,592
34,279
39,262
3.3
3.3
21.0
24.4
11.1
9.6
1.9
1.6
14.4
14.7
-
-
IDBI Bank
Neutral
68
-
14,010
9,625
10,455
1.8
1.8
8.5
14.2
8.0
4.8
0.5
0.5
5.9
9.3
-
-
Indian Bank
Neutral
141
-
6,765
6,160
6,858
2.5
2.5
24.5
29.8
5.8
4.7
0.5
0.4
7.7
8.6
-
-
LIC Housing Finance
Buy
498
592
25,115
3,179
3,758
2.6
2.6
32.9
40.6
15.1
12.3
2.8
2.4
19.6
20.7
-
-
Oriental Bank
Neutral
107
-
3,695
7,643
8,373
2.4
2.4
37.2
45.4
2.9
2.4
0.3
0.2
8.2
9.4
-
-
Punjab Natl.Bank
Neutral
104
-
20,461
23,122
26,022
2.8
2.8
7.0
21.6
14.9
4.8
0.8
0.7
3.4
10.0
-
-
South Ind.Bank
Neutral
20
-
2,707
1,965
2,185
2.5
2.5
2.5
3.3
8.1
6.1
0.8
0.7
9.5
11.7
-
-
St Bk of India
Neutral
216
-
167,909
79,958
86,061
2.6
2.6
13.4
20.7
16.2
10.5
1.3
1.2
11.5
12.8
-
-
Union Bank
Neutral
127
-
8,748
12,646
14,129
2.3
2.4
31.0
39.1
4.1
3.3
0.4
0.4
9.8
11.4
-
-
Vijaya Bank
Neutral
38
-
3,781
3,536
3,827
1.9
1.9
5.5
6.7
6.9
5.7
0.6
0.5
7.8
8.8
-
-
Yes Bank
Neutral
1,069
-
45,011
7,190
9,011
3.2
3.3
58.2
69.7
18.4
15.4
3.3
2.8
19.2
19.6
-
-
FMCG
Asian Paints
Neutral
980
-
94,001
15,534
17,445
17.7
16.8
18.4
19.6
53.4
50.0
18.9
17.8
34.6
35.6
6.2
5.5
Stock Watch
June 29, 2016
Company Name
Reco
CMP
Target
Mkt Cap
Sales ( Čcr )
OPM(%)
EPS (Č)
PER(x)
P/BV(x)
RoE(%)
EV/Sales(x)
(Č)
Price ( Č)
( Č cr )
FY16E FY17E
FY16E
FY17E
FY16E
FY17E
FY16E
FY17E
FY16E
FY17E
FY16E
FY17E
FY16E
FY17E
FMCG
Britannia
Neutral
2,743
-
32,912
8,481
9,795
14.0
14.1
65.5
78.3
41.9
35.0
19.8
16.3
38.3
41.2
3.8
3.3
Colgate
Neutral
897
-
24,407
4,136
4,632
22.5
23.3
22.2
25.3
40.4
35.5
24.6
21.9
68.6
67.5
5.6
5.0
Dabur India
Neutral
313
-
55,008
9,370
10,265
17.6
17.3
7.3
8.1
42.6
38.6
11.1
10.1
31.7
30.6
5.6
5.1
GlaxoSmith Con*
Accumulate
5,878
6,118
24,719
4,519
5,142
19.6
19.8
164.3
191.2
35.8
30.7
9.9
8.4
30.8
29.9
4.7
4.1
Godrej Consumer
Neutral
1,532
-
52,173
9,003
10,335
18.1
18.7
34.1
41.8
44.9
36.7
9.7
8.3
23.9
24.8
6.1
5.3
HUL
Neutral
888
-
192,131
33,299
35,497
17.1
17.1
18.9
20.0
47.0
44.4
41.2
35.9
87.6
80.8
5.6
5.2
ITC
Accumulate
368
380
296,419
36,837
39,726
38.8
38.7
12.2
13.5
30.1
27.3
8.4
7.4
27.8
26.9
7.2
6.7
Marico
Neutral
256
-
33,074
6,151
6,966
17.2
17.3
5.4
6.4
47.5
40.1
14.9
11.8
33.2
32.4
5.2
4.6
Nestle*
Neutral
6,457
-
62,252
9,393
10,507
22.2
22.3
106.8
121.8
60.5
53.0
21.2
19.1
34.8
36.7
6.2
5.6
Tata Global
Accumulate
128
137
8,069
8,635
9,072
9.8
9.9
5.8
7.2
22.0
17.8
2.0
1.9
6.8
7.4
0.9
0.9
Procter & Gamble
Buy
6,133
7,369
19,908
2,588
2,939
23.3
23.2
130.2
146.2
47.1
42.0
93.9
90.1
27.6
25.3
7.4
6.4
Hygiene
IT
HCL Tech^
Buy
713
1,000
100,643
37,061
30,781
21.5
20.5
51.4
40.0
13.9
17.8
3.6
2.6
20.1
20.3
2.5
2.7
Infosys
Accumulate
1,161
1,374
266,687
62,441
70,558
27.5
27.5
59.0
65.3
19.7
17.8
4.0
3.6
22.2
22.4
4.1
3.5
TCS
Accumulate
2,462
3,004
485,080
108,646
122,770
28.3
28.3
123.7
141.0
19.9
17.5
6.6
6.0
33.1
34.6
4.3
3.7
Tech Mahindra
Buy
501
700
48,647
26,494
30,347
16.3
17.0
32.2
37.5
15.6
13.4
3.4
2.9
21.7
21.8
1.8
1.5
Wipro
Buy
542
680
134,011
50,808
56,189
23.7
23.8
37.3
40.7
14.5
13.3
2.8
2.5
19.2
17.7
2.1
1.7
Media
D B Corp
Neutral
376
-
6,909
2,025
2,187
27.4
27.4
17.4
18.9
21.6
19.9
4.9
4.4
22.9
23.7
3.4
3.1
HT Media
Neutral
78
-
1,804
2,495
2,673
12.9
13.2
6.8
7.2
11.4
10.8
0.9
0.8
7.5
7.8
0.3
0.3
Jagran Prakashan
Buy
169
205
5,526
2,107
2,355
33.5
28.0
10.1
10.8
16.8
15.7
3.9
3.4
23.3
21.7
2.7
2.4
Sun TV Network
Neutral
355
-
13,998
2,510
2,763
71.8
71.5
21.9
24.8
16.2
14.3
3.8
3.5
22.8
24.3
5.2
4.7
Hindustan Media
Neutral
273
-
2,001
914
1,016
21.7
21.5
21.9
23.3
12.5
11.7
2.2
1.9
18.0
16.2
1.6
1.4
Ventures
Metals & Mining
Coal India
Buy
313
380
197,797
76,167
84,130
19.9
22.3
22.4
25.8
14.0
12.1
5.0
4.9
35.5
41.0
1.9
1.7
Hind. Zinc
Neutral
172
-
72,697
14,641
14,026
50.4
50.4
17.7
16.0
9.8
10.8
1.5
1.4
16.2
13.2
2.5
2.3
Hindalco
Neutral
118
-
24,377
104,356
111,186
8.7
9.5
6.7
11.1
17.6
10.7
0.6
0.6
3.5
5.9
0.7
0.7
JSW Steel
Neutral
1,427
-
34,501
42,308
45,147
16.4
20.7
(10.3)
49.5
28.8
1.6
1.5
(1.0)
5.6
1.8
1.7
NMDC
Neutral
92
-
36,416
8,237
10,893
46.6
44.5
10.0
11.7
9.2
7.9
1.0
0.9
12.5
13.0
4.1
3.1
SAIL
Neutral
43
-
17,739
45,915
53,954
7.2
10.5
1.5
4.4
28.5
9.8
0.4
0.4
2.3
4.1
1.0
0.9
Vedanta
Neutral
123
-
36,510
71,445
81,910
26.2
26.3
12.9
19.2
9.6
6.4
0.7
0.6
7.2
8.9
0.9
0.7
Tata Steel
Neutral
311
-
30,249
126,760
137,307
8.9
11.3
6.4
23.1
49.0
13.5
1.0
1.0
2.0
7.1
0.8
0.8
Stock Watch
June 29, 2016
Company Name
Reco
CMP
Target
Mkt Cap
Sales ( Čcr )
OPM(%)
EPS (Č)
PER(x)
P/BV(x)
RoE(%)
EV/Sales(x)
(Č)
Price ( Č)
( Č cr )
FY16E FY17E
FY16E
FY17E
FY16E
FY17E
FY16E
FY17E
FY16E
FY17E
FY16E
FY17E
FY16E
FY17E
Oil & Gas
Cairn India
Neutral
134
-
25,123
11,323
12,490
49.4
51.0
20.7
20.7
6.5
6.5
0.4
0.4
6.4
6.1
1.4
0.8
GAIL
Neutral
378
-
47,936
64,856
70,933
9.1
9.6
24.0
28.9
15.8
13.1
1.3
1.3
8.8
9.6
0.9
0.8
ONGC
Neutral
211
-
180,606
154,564
145,998
36.8
37.4
20.8
22.6
10.2
9.3
1.0
0.9
10.1
9.7
1.4
1.5
Petronet LNG
Neutral
285
-
21,353
29,691
31,188
5.8
6.2
12.8
13.4
22.3
21.2
3.3
3.0
15.8
14.8
0.8
0.7
Indian Oil Corp
Accumulate
435
455
105,604
359,607
402,760
5.9
6.1
42.5
48.7
10.2
8.9
1.4
1.2
14.1
14.4
0.4
0.3
Reliance Industries
Buy
958
1,150
310,691
304,775
344,392
12.6
13.4
91.3
102.6
10.5
9.3
1.2
1.1
11.8
12.0
0.9
0.8
Pharmaceuticals
Alembic Pharma
Neutral
541
-
10,191
3,274
3,802
26.9
19.4
35.0
28.7
15.5
18.8
6.8
5.2
55.6
31.2
3.2
2.7
Aurobindo Pharma
Accumulate
730
856
42,720
14,923
17,162
22.0
23.0
35.7
42.8
20.5
17.1
6.0
4.5
34.0
30.2
3.5
3.0
Aventis*
Accumulate
4,221
4,738
9,720
2,049
2,375
15.4
17.3
115.4
153.5
36.6
27.5
6.0
4.7
19.3
25.8
4.6
3.9
Cadila Healthcare
Buy
320
400
32,744
9,469
11,246
21.2
22.0
14.9
17.1
21.5
18.7
6.1
4.8
28.8
26.6
3.4
2.9
Cipla
Buy
497
605
39,925
13,979
16,447
20.2
18.6
25.7
27.5
19.3
18.1
3.2
2.7
17.6
16.1
2.7
2.2
Dr Reddy's
Accumulate
3,266
3,476
55,694
15,471
17,479
24.6
24.6
138.2
152.4
23.6
21.4
4.3
3.7
19.7
18.7
3.4
3.0
Dishman Pharma
Neutral
138
-
2,223
1,733
1,906
21.5
21.5
10.1
10.0
13.6
13.8
1.6
1.5
10.5
11.2
1.9
1.7
GSK Pharma*
Neutral
3,489
-
29,553
2,870
3,158
20.0
22.1
59.5
68.3
58.6
51.1
17.3
17.8
28.5
34.3
9.9
9.1
Indoco Remedies
Neutral
272
-
2,508
1,033
1,199
15.9
18.2
9.4
13.6
29.0
20.0
4.3
3.7
15.7
19.7
2.6
2.3
Ipca labs
Buy
487
750
6,139
3,363
3,909
12.9
18.6
13.4
28.0
36.3
17.4
2.6
2.3
7.4
14.0
1.9
1.6
Lupin
Buy
1,543
1,809
69,578
13,702
15,912
23.7
26.4
50.5
58.1
30.6
26.6
6.3
5.2
22.9
21.4
5.2
4.2
Sun Pharma
Buy
766
950
184,401
28,163
32,610
25.8
30.7
17.4
26.9
44.0
28.5
4.2
3.6
13.0
16.6
5.8
4.8
Power
Tata Power
Neutral
72
-
19,473
35,923
37,402
22.6
22.8
4.1
5.2
17.8
14.0
1.4
1.3
7.5
9.3
1.5
1.4
NTPC
Neutral
148
-
122,115
87,271
99,297
23.5
23.5
11.8
13.3
12.6
11.1
1.4
1.3
11.5
12.2
2.4
2.2
Power Grid
Accumulate
156
170
81,351
20,702
23,361
86.7
86.4
12.1
13.2
12.9
11.8
1.9
1.7
15.6
15.1
8.7
8.1
Real Estate
MLIFE
Buy
453
554
1,857
826
1,011
20.1
21.9
22.7
30.7
19.9
14.7
1.2
1.1
6.0
7.4
4.1
3.1
Telecom
Bharti Airtel
Neutral
357
-
142,827
101,748
109,191
32.1
31.7
12.0
12.5
29.8
28.6
2.1
1.9
6.9
6.7
2.0
1.9
Idea Cellular
Neutral
104
-
37,556
34,282
36,941
32.0
31.5
5.9
6.2
17.7
16.8
1.6
1.5
9.9
9.3
1.7
1.6
zOthers
Abbott India
Neutral
4,489
-
9,538
2,715
3,153
14.5
14.1
134.3
152.2
33.4
29.5
8.3
6.9
27.4
25.6
3.3
2.8
Bajaj Electricals
Buy
222
268
2,240
4,612
5,351
5.6
5.7
23.4
18.0
9.5
12.4
2.9
2.6
12.5
14.4
0.5
0.4
Finolex Cables
Neutral
349
-
5,334
2,520
2,883
12.2
12.0
12.7
14.2
27.5
24.6
3.8
3.3
13.6
13.5
1.9
1.6
Goodyear India*
Accumulate
513
582
1,184
1,800
1,600
11.7
11.5
58.7
52.9
8.7
9.7
2.0
1.7
24.6
18.7
0.4
0.4
Hitachi
Neutral
1,315
-
3,576
1,779
2,081
7.8
8.8
21.8
33.4
60.3
39.3
9.7
7.9
17.4
22.1
2.0
1.7
Stock Watch
June 29, 2016
Company Name
Reco
CMP
Target
Mkt Cap
Sales ( Čcr )
OPM(%)
EPS (Č)
PER(x)
P/BV(x)
RoE(%)
EV/Sales(x)
(Č)
Price ( Č)
( Č cr )
FY16E
FY17E
FY16E
FY17E
FY16E
FY17E
FY16E
FY17E
FY16E
FY17E
FY16E
FY17E
FY16E
FY17E
zOthers
Jyothy Laboratories
Neutral
296
-
5,360
1,620
1,847
11.5
11.5
7.3
8.5
40.6
34.9
5.3
4.9
13.3
14.4
3.1
2.7
MRF
Buy
32,880
45,575
13,945
20,316
14,488
21.4
21.1
5,488.0
3,798.0
6.0
8.7
2.0
1.7
41.1
21.2
0.6
0.9
Page Industries
Neutral
13,752
-
15,339
1,929
2,450
19.8
20.1
229.9
299.0
59.8
46.0
26.4
18.3
52.1
47.1
8.2
6.4
Relaxo Footwears
Neutral
495
-
5,940
1,767
2,152
12.3
12.5
19.3
25.1
25.7
19.7
6.3
4.9
27.7
27.8
3.0
2.5
Siyaram Silk Mills
Buy
1,073
1,347
1,006
1,619
1,799
11.6
11.6
93.5
104.9
11.5
10.2
2.0
1.7
17.1
16.4
0.8
0.8
Styrolution ABS India* Neutral
607
-
1,067
1,271
1,440
8.6
9.2
32.0
41.1
18.9
14.8
1.9
1.7
10.7
12.4
0.8
0.7
TVS Srichakra
Buy
2,362
2,932
1,809
2,035
2,252
15.9
15.3
248.6
268.1
9.5
8.8
4.1
3.0
43.6
33.9
0.9
0.8
HSIL
Accumulate
272
310
1,968
2,123
2,384
16.1
16.5
15.0
18.9
18.1
14.4
1.4
1.3
8.0
9.4
1.3
1.1
Kirloskar Engines India
Neutral
266
-
3,841
2,403
2,554
8.6
9.9
9.2
10.5
28.9
25.3
2.8
2.7
9.7
10.7
1.2
1.1
Ltd
M M Forgings
Buy
425
546
512
511
615
21.7
21.6
43.1
55.8
9.8
7.6
1.8
1.5
19.9
21.2
1.3
1.0
Banco Products (India) Neutral
144
-
1,027
1,208
1,353
11.0
12.3
10.8
14.5
13.3
9.9
1.5
1.4
11.9
14.5
0.8
0.7
Competent Automobiles Neutral
140
-
86
1,040
1,137
3.2
3.1
25.7
28.0
5.4
5.0
0.8
0.7
15.0
14.3
0.1
0.1
Nilkamal
Neutral
1,144
-
1,707
1,871
2,031
10.7
10.5
63.2
69.8
18.1
16.4
3.0
2.5
17.6
16.6
1.0
0.9
Visaka Industries
Buy
153
162
243
1,020
1,120
8.7
9.1
13.9
20.1
11.0
7.6
0.7
0.7
6.4
8.7
0.4
0.4
Transport Corporation of
Neutral
307
-
2,353
2,830
3,350
8.8
9.0
14.4
18.3
21.4
16.8
3.3
2.9
15.4
17.1
0.9
0.8
India
Elecon Engineering
Neutral
61
-
663
1,359
1,482
10.3
13.7
0.8
3.9
75.8
15.7
1.2
1.2
1.6
7.8
0.8
0.7
Surya Roshni
Buy
177
201
776
2,992
3,223
8.1
8.4
14.7
18.3
12.0
9.7
1.1
1.0
9.7
11.0
0.5
0.5
MT Educare
Neutral
163
-
648
286
366
18.3
17.7
7.7
9.4
21.1
17.4
4.4
3.9
20.2
21.1
2.4
1.8
Radico Khaitan
Buy
92
125
1,218
1,543
1,659
12.6
13.0
5.8
6.3
15.8
14.5
1.4
1.3
8.5
8.6
1.3
1.2
Garware Wall Ropes
Buy
357
460
782
828
898
11.2
10.3
28.3
29.0
12.6
12.3
2.1
1.8
16.8
14.9
0.9
0.8
Wonderla Holidays
Neutral
404
-
2,283
206
308
44.0
43.6
9.0
12.9
44.9
31.3
6.1
5.6
13.7
17.8
10.4
6.9
Linc Pen & Plastics
Accumulate
243
235
360
344
382
9.1
9.1
12.4
13.1
19.7
18.6
3.5
3.1
18.0
16.7
1.0
0.9
The Byke Hospitality
Neutral
161
-
647
222
287
20.5
20.5
5.6
7.6
28.6
21.4
5.4
4.4
18.9
20.8
3.1
2.4
Interglobe Aviation
Neutral
1,020
-
36,755
17,022
21,122
20.7
14.5
63.9
53.7
16.0
19.0
23.9
19.6
149.9
103.2
2.1
1.7
Coffee Day Enterprises
Neutral
250
-
5,151
2,692
2,964
17.0
18.6
-
4.7
-
52.8
3.1
2.9
0.2
5.5
2.4
2.2
Ltd
Navneet Education
Neutral
93
-
2,219
998
1,062
24.1
24.0
5.8
6.1
16.2
15.3
3.6
3.1
22.0
20.6
2.1
2.0
Navkar Corporation
Buy
219
265
3,120
347
408
43.2
42.9
6.7
6.8
32.8
32.3
2.4
2.2
7.3
6.9
8.7
7.9
UFO Moviez
Neutral
527
-
1,454
558
619
32.0
33.2
22.5
30.0
23.4
17.6
2.8
2.4
12.0
13.8
2.5
2.1
VRL Logistics
Neutral
310
-
2,827
1,725
1,902
16.5
16.7
12.2
14.6
25.5
21.3
5.3
4.7
20.8
21.9
1.6
1.4
Stock Watch
June 29, 2016
Company Name
Reco
CMP
Target Mkt Cap
Sales ( Čcr )
OPM(%)
EPS (Č)
PER(x)
P/BV(x)
RoE(%)
EV/Sales(x)
(Č)
Price ( Č)
( Č cr )
FY16E FY17E FY16E FY17E FY16E FY17E FY16E FY17E FY16E FY17E FY16E FY17E FY16E FY17E
zOthers
Team Lease Serv.
Neutral
917
-
1,567
2,565
3,229
1.3
1.5
15.2
22.8
60.4
40.3
4.8
4.3
8.0
10.7
0.5
0.4
S H Kelkar & Co.
Neutral
214
-
3,092
928
1,036
15.3
15.1
4.9
6.1
43.3
35.0
4.1
3.7
9.4
10.7
3.2
2.8
Quick Heal
Neutral
261
-
1,829
339
408
27.8
27.3
7.1
7.7
36.9
33.7
3.1
3.1
8.5
9.3
3.8
3.2
Narayana Hrudaya
Neutral
314
-
6,419
1,603
1,873
10.9
11.5
1.0
2.6
329.7
118.8
7.9
7.3
2.4
6.1
4.1
3.5
Manpasand Bever.
Neutral
546
-
2,733
540
836
19.9
19.6
10.2
16.9
53.3
32.3
4.3
3.9
8.1
12.0
4.7
3.0
Source: Company, Angel Research; Note: *December year end; #September year end; &October year end; Price as on June 28, 2016
Market Outlook
June 29, 2016
Research Team Tel: 022 - 39357800
DISCLAIMER
Angel Broking Private Limited (hereinafter referred to as “Angel”) is a registered Member of National Stock Exchange of India Limited,
Bombay Stock Exchange Limited and Metropolitian Stock Exchange of India Limited. It is also registered as a Depository Participant with
CDSL and Portfolio Manager with SEBI. It also has registration with AMFI as a Mutual Fund Distributor. Angel Broking Private Limited is a
registered entity with SEBI for Research Analyst in terms of SEBI (Research Analyst) Regulations, 2014 vide registration number
INH000000164. Angel or its associates has not been debarred/ suspended by SEBI or any other regulatory authority for accessing
/dealing in securities Market. Angel or its associates including its relatives/analyst do not hold any financial interest/beneficial ownership
of more than 1% in the company covered by Analyst. Angel or its associates/analyst has not received any compensation / managed or co
-managed public offering of securities of the company covered by Analyst during the past twelve months. Angel/analyst has not served as
an officer, director or employee of company covered by Analyst and has not been engaged in market making activity of the company
covered by Analyst.
This document is solely for the personal information of the recipient, and must not be singularly used as the basis of any investment
decision. Nothing in this document should be construed as investment or financial advice. Each recipient of this document should make
such investigations as they deem necessary to arrive at an independent evaluation of an investment in the securities of the companies
referred to in this document (including the merits and risks involved), and should consult their own advisors to determine the merits and
risks of such an investment.
Reports based on technical and derivative analysis center on studying charts of a stock's price movement, outstanding positions and
trading volume, as opposed to focusing on a company's fundamentals and, as such, may not match with a report on a company's
fundamentals.
The information in this document has been printed on the basis of publicly available information, internal data and other reliable sources
believed to be true, but we do not represent that it is accurate or complete and it should not be relied on as such, as this document is for
general guidance only. Angel Broking Pvt. Limited or any of its affiliates/ group companies shall not be in any way responsible for any
loss or damage that may arise to any person from any inadvertent error in the information contained in this report. Angel Broking Pvt.
Limited has not independently verified all the information contained within this document. Accordingly, we cannot testify, nor make any
representation or warranty, express or implied, to the accuracy, contents or data contained within this document. While Angel Broking
Pvt. Limited endeavors to update on a reasonable basis the information discussed in this material, there may be regulatory, compliance,
or other reasons that prevent us from doing so.
This document is being supplied to you solely for your information, and its contents, information or data may not be reproduced,
redistributed or passed on, directly or indirectly.
Neither Angel Broking Pvt. Limited, nor its directors, employees or affiliates shall be liable for any loss or damage that may arise from or
in connection with the use of this information.
Note: Please refer to the important ‘Stock Holding Disclosure' report on the Angel website (Research Section). Also, please refer to the
latest update on respective stocks for the disclosure status in respect of those stocks. Angel Broking Pvt. Limited and its affiliates may have
investment positions in the stocks recommended in this report.