Market Outlook
February 29, 2016
Market Cues
Domestic Indices
Chg (%)
(Pts)
(Close)
Indian markets are expected to open on a Negative note tracking the SGX Nifty and
BSE Sensex
0.8
178
23,154
its Asian peers.
Nifty
0.8
59
7,030
US markets failed to sustain its initial gains and turned in a lackluster performance
Mid Cap
0.3
28
9,573
on Friday. The choppiness came as traders reacted to release of US economic data.
Small Cap
(0.4)
(43)
9,555
Early in the session, the commerce department had released reports showing
Bankex
1.5
233
15,648
increase in personal income and spends, easing concerns of recession. However,
the data also led to renewed worries about the outlook for interest rates.
Global Indices
Chg (%)
(Pts)
(Close)
The European markets ended Friday's session in the green, as jump in metals prices
Dow Jones
(0.3)
(57)
16,640
boosted mining companies and encouraging company updates also supported the
Nasdaq
0.2
8
4,590
market. The markets also got support from positive opening witnessed in the US
FTSE
1.4
83
6,096
markets.
Nikkei
0.3
48
16,188
Indian markets posted their first gains in four sessions on Friday after the economic
Hang Seng
2.5
475
19,364
survey from the finance ministry called for fiscal prudence and stable inflation.
Shanghai Com
0.9
26
2,767
News & Result Analysis
Jaypee sells cement biz to UltraTech for `16,500cr
Advances / Declines
BSE
NSE
Aurobindo Pharma gets US FDA nod for anti-HIV tablets
Advances
1,010
586
Detailed analysis on Pg2
Declines
1,488
926
Investor’s Ready Reckoner
Unchanged
167
70
Key Domestic & Global Indicators
Stock Watch: Latest investment recommendations on 150+ stocks
Volumes (` Cr)
Refer Pg4 onwards
BSE
1,924
NSE
14,083
Top Picks
CMP
Target
Upside
Company
Sector
Rating
(`)
(`)
(%)
Net Inflows (` Cr)
Net
Mtd
Ytd
Amara Raja Batteries Auto & Auto Ancillary
Buy
861
1,040
20.8
FII
(1,063)
(5,697)
(22,652)
HCL Tech
IT
Buy
819
1,038
26.7
MFs
210
3,300
78,895
LIC Housing Finance Financials
Buy
409
592
44.8
Bharat Electronics
Capital Goods
Buy
1,056
1,414
33.9
Navkar Corporation Others
Buy
156
265
69.9
Top Gainers
Price (`)
Chg (%)
More Top Picks on Pg3
Dhfl
152
7.0
Igl
516
5.3
Key Upcoming Events
Previous
Consensus
Pvr
687
5.0
Date
Region
Event Description
Reading
Expectations
Mothersumi
220
4.6
Mar 1 Germany
PMI Manufacturing
50.2
50.2
Dlf
87
4.5
UK
PMI Manufacturing
52.9
52.3
China
PMI Manufacturing
49.4
49.4
Top Losers
Price (`)
Chg (%)
Mar 3 US
Initial Jobless Claims (000’s)
272
--
6.(
Monsanto
1,592
(7.0)
Jppower
4
(5.3)
Natcopharm
422
(5.2)
Tataelxsi
1,681
(5.1)
Niittech
427
(4.4)
As on February 26, 2016
Market Outlook
February 29, 2016
Jaypee sells cement biz to UltraTech for `16,500cr
As per stock exchange notification, UltraTech cement has entered into binding
Memorandum of Understanding with Jaiprakash (JP) Associates for acquisition of
its identified cement plants having total cement capacity of 22.4 million tonnes per
annum (MTPA) at an enterprise valuation of `16,500cr
The acquisition is said to give the company access to newer markets of Satna, UP
East, Himchal Pradesh and coastal Andhra and is also in-line with company’s
strategy of increasing its overall capacity to 100 MTPA over the next few years.
As for JP the company has been in the process of reducing its debt via
disinvestment over the past two years and the deal will enable substantial debt
reduction for the company.
If the deal goes through, then JP Associates assets will be valued at ~US$110
EV/Tonne which is on a lower side and hence should be positive for Ultratech. We
maintain our Accumulate recommendation on the stock.
Aurobindo Pharma gets US FDA nod for anti-HIV tablets
As per media reports, Aurobindo Pharma has received tentative approval from the
United States Food and Drug Administration (USFDA) for its Ritonavir tablets which
is used for treatment of human immunodeficiency virus (HIV) infection. USFDA has
given tentative approval to Aurobindo Pharma's Ritonavir tablets in the strength of
100 mg, as per the regulator. We currently have a Buy rating on the stock.
Economic and Political News
PM for electrification of 200 villages every week
Centre's green nod to `114cr multi-product SEZ in AP
Re-bidding for Bhedabahal UMPP by March end
Govt to invest `25,000cr on transportation in Assam: Gadkari
Corporate News
NLC pays `229cr interim dividend to Union govt
FCIL to sell land parcel for `1,500cr to revive Sindri unit
DLF awards `800cr contract to L&T
Yes Bank targets 2.5% market share by 2020, retail big thrust
Market Outlook
February 29, 2016
Top Picks
Large Cap
M
arket Cap
CM
P
T
arget
Upsid
e
Company
Rationale
(` Cr)
(`)
(`)
(%)
To outpace battery industry growth due to better technological
Amara Raja Batteries
14,704
861
1,040
20.8
products leading to market share gains in both the automotive
OEM and replacement segments.
Earnings to grow strongly given the MHCV cyclical upturn.
Ashok Leyland
24,346
86
111
29.7
Focus on exports and LCV's provides additional growth
avenue.
Uptick in defense capex by government when coupled with
Bharat Electronics
25,338
1,056
1,414
33.9
BELs strong market positioning, indicate that good times are
ahead for BEL.
The stock is trading at attractive valuations and is factoring all
HCL Tech
1,15,539
819
1,038
26.7
the bad news.
Strong visibility for a robust 20% earnings trajectory, coupled
HDFC Bank
2,42,467
960
1,262
31.5
with high quality of earnings on account of high quality retail
business and strategic focus on highly rated corporates.
Back on the growth trend, expect a long term growth of 14%
Infosys
2,57,499
1,121
1,347
20.2
to be a US$20bn in FY2020.
LICHF continues to grow its retail loan book at a healthy pace
with improvement in asset quality. We expect the company to
LIC Housing Finance
20,621
409
592
44.8
post a healthy loan book which is likely to reflect in a strong
earnings growth.
Huge bid pipeline of re-development works at Delhi and other
NBCC
10,438
870
1,089
25.2
State Governments and opportunity from Smart City, positions
NBCC to report strong growth, going forward.
New launches to enable outpace industry growth; margins
TVS Motors
12,568
265
330
24.7
expansion to boost earnings.
Source: Company, Angel Research
Mid Cap
M
arket Cap
CM
P
T
arget
Upsid
e
Company
Rationale
(` Cr)
(`)
(`)
(%)
Favourable outlook for the AC industry to augur well for
Cooling products business which is out pacing the market
Blue Star
2,846
316
439
38.7
growth. EMPPAC division's profitability to improve once
operating environment turns around.
Economic recovery to have favourable impact on advertising &
circulation revenue growth. Further, the acquisition of a radio
Jagran Prakashan
4,830
148
189
27.9
business (Radio City) would also boost the company's revenue
growth.
Massive capacity expansion along with rail advantage at ICD
Navkar Corporation
2,224
156
265
69.9
as well CFS augurs well for the company
Earnings boost on back of stable material prices and
Radico Khaitan
1,229
92
156
68.8
favourable pricing environment. Valuation discount to peers
provides additional comfort
Strong brands and distribution network would boost growth
Siyaram Silk Mills
901
962
1,354
40.8
going ahead. Stock currently trades at an inexpensive
valuation.
Source: Company, Angel Research
Market Outlook
February 29, 2016
Key Upcoming Events
Global economic events release calendar
Date
Time
Country
Event Description
Unit
Period
Bloomberg Data
Last Reported Estimated
Mar 1, 2016
2:25PM
Germany
PMI Manufacturing
Value
Feb F
50.20
50.20
3:00PM
UK
PMI Manufacturing
Value
Feb
52.90
52.30
6:30AM
China
PMI Manufacturing
Value
Feb
49.40
49.40
2:25PM
Germany
Unemployment change (000's)
Thousands
Feb
(20.00)
(10.00)
Mar 3, 2016
7:00PM
US
Initial Jobless claims
Thousands
Feb 27
272.00
--
2:25PM
Germany
PMI Services
Value
Feb F
55.10
55.10
Mar 4, 2016
7:00PM
US
Change in Nonfarm payrolls
Thousands
Feb
151.00
195.00
7:00PM
US
Unnemployment rate
%
Feb
4.90
4.90
Mar 8, 2016
China
Exports YoY%
% Change
Feb
(11.20)
--
3:30PM
Euro Zone
Euro-Zone GDP s.a. (QoQ)
% Change
4Q P
0.30
--
Mar 9, 2016
3:00PM
UK
Industrial Production (YoY)
% Change
Jan
(0.40)
--
Mar 10, 2016 7:00AM
China
Consumer Price Index (YoY)
% Change
Feb
1.80
--
India
Imports YoY%
% Change
Feb
(11.00)
--
India
Exports YoY%
% Change
Feb
(13.60)
--
6:15PM
Euro Zone
ECB announces interest rates
%
Mar 10
0.05
--
Mar 14, 2016 12:00PM
India
Monthly Wholesale Prices YoY%
% Change
Feb
(0.90)
--
5:30PM
India
Industrial Production YoY
% Change
Jan
(1.30)
--
Mar 15, 2016
US
Producer Price Index (mom)
% Change
Feb
(0.50)
--
Mar 16, 2016 6:00PM
US
Consumer price index (mom)
% Change
Feb
--
--
6:00PM
US
Housing Starts
Thousands
Feb
1,099.00
--
6:00PM
US
Building permits
Thousands
Feb
1,202.00
--
3:00PM
UK
Jobless claims change
% Change
Feb
(14.80)
--
6:45PM
US
Industrial Production
%
Feb
0.92
--
11:30PM
US
FOMC rate decision
%
Mar 16
0.50
0.50
Mar 17, 2016 3:30PM
Euro Zone
Euro-Zone CPI (YoY)
%
Feb F
0.30
--
5:30PM
UK
BOE Announces rates
% Ratio
Mar 17
0.50
0.50
Mar 21, 2016 7:30PM
US
Existing home sales
Million
Feb
5.47
--
Mar 22, 2016 3:00PM
UK
CPI (YoY)
% Change
Feb
0.30
--
Mar 23, 2016 7:30PM
US
New home sales
Thousands
Feb
494.00
--
Mar 29, 2016 7:30PM
US
Consumer Confidence
S.A./ 1985=100
Mar
92.20
--
Mar 31, 2016 2:00PM
UK
GDP (YoY)
% Change
4Q F
1.90
--
Source: Bloomberg, Angel Research
Market Outlook
February 29, 2016
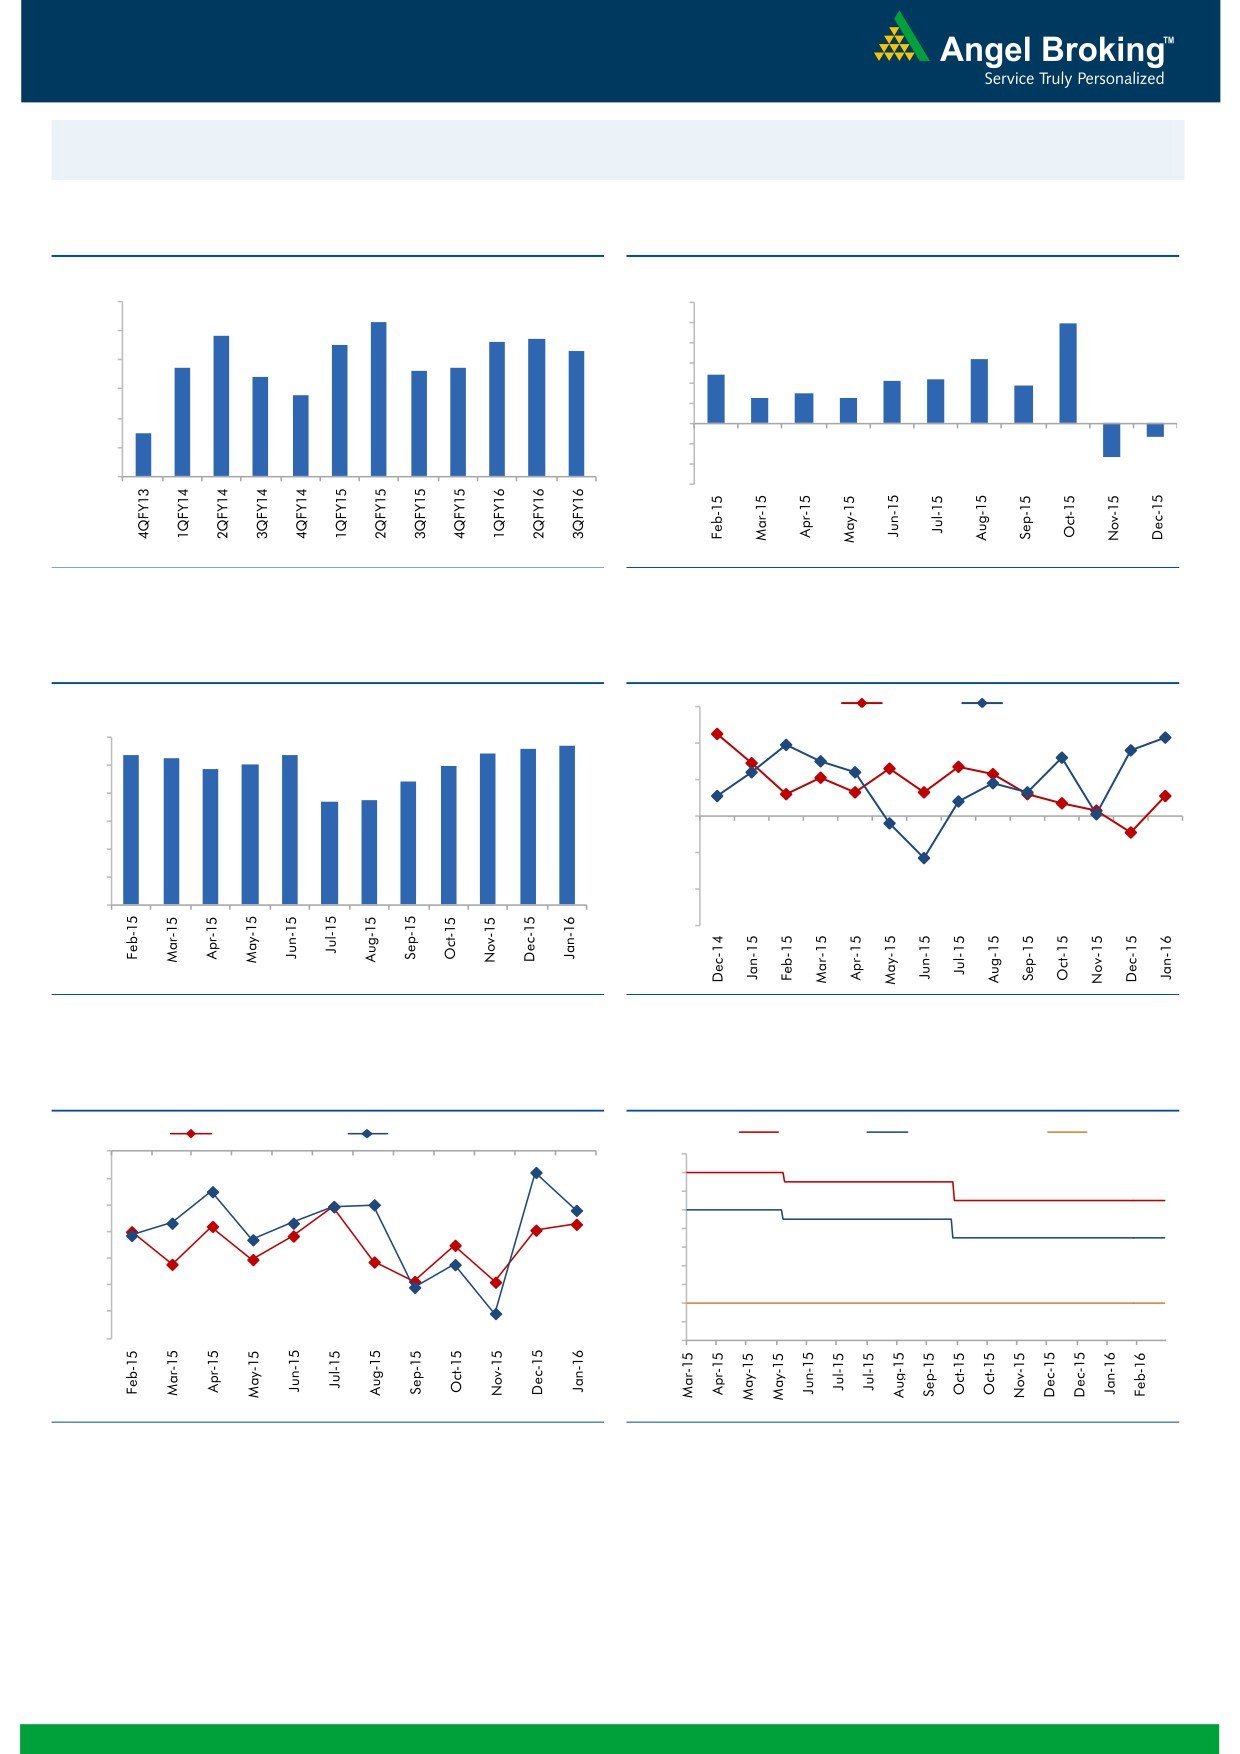
Macro watch
Exhibit 1: Quarterly GDP trends
Exhibit 2: IIP trends
(%)
(%)
9.0
12.0
8.3
9.9
7.8
7.7
10.0
8.0
7.5
7.6
7.3
8.0
6.3
6.7
6.6
6.7
4.8
7.0
6.4
6.0
4.2
4.3
3.7
5.8
3.0
4.0
2.5
2.5
6.0
2.0
5.0
4.5
-
4.0
(2.0)
(1.3)
(4.0)
3.0
(3.4)
(6.0)
Source: CSO, Angel Research
Source: MOSPI, Angel Research
Exhibit 3: Monthly CPI inflation trends
Exhibit 4: Manufacturing and services PMI
(%)
56.0
Mfg. PMI
Services PMI
5.6
5.7
6.0
5.4
5.3
5.4
5.4
54.0
4.9
5.0
5.0
5.0
4.4
3.7
3.7
52.0
4.0
50.0
3.0
2.0
48.0
1.0
46.0
-
44.0
Source: MOSPI, Angel Research
Source: Market, Angel Research; Note: Level above 50 indicates expansion
Exhibit 5: Exports and imports growth trends
Exhibit 6: Key policy rates
(%)
Exports yoy growth
Imports yoy growth
(%)
Repo rate
Reverse Repo rate
CRR
0.0
8.00
(5.0)
7.50
7.00
(10.0)
6.50
(15.0)
6.00
5.50
(20.0)
5.00
(25.0)
4.50
4.00
(30.0)
3.50
(35.0)
3.00
Source: Bloomberg, Angel Research
Source: RBI, Angel Research
Market Outlook
February 29, 2016
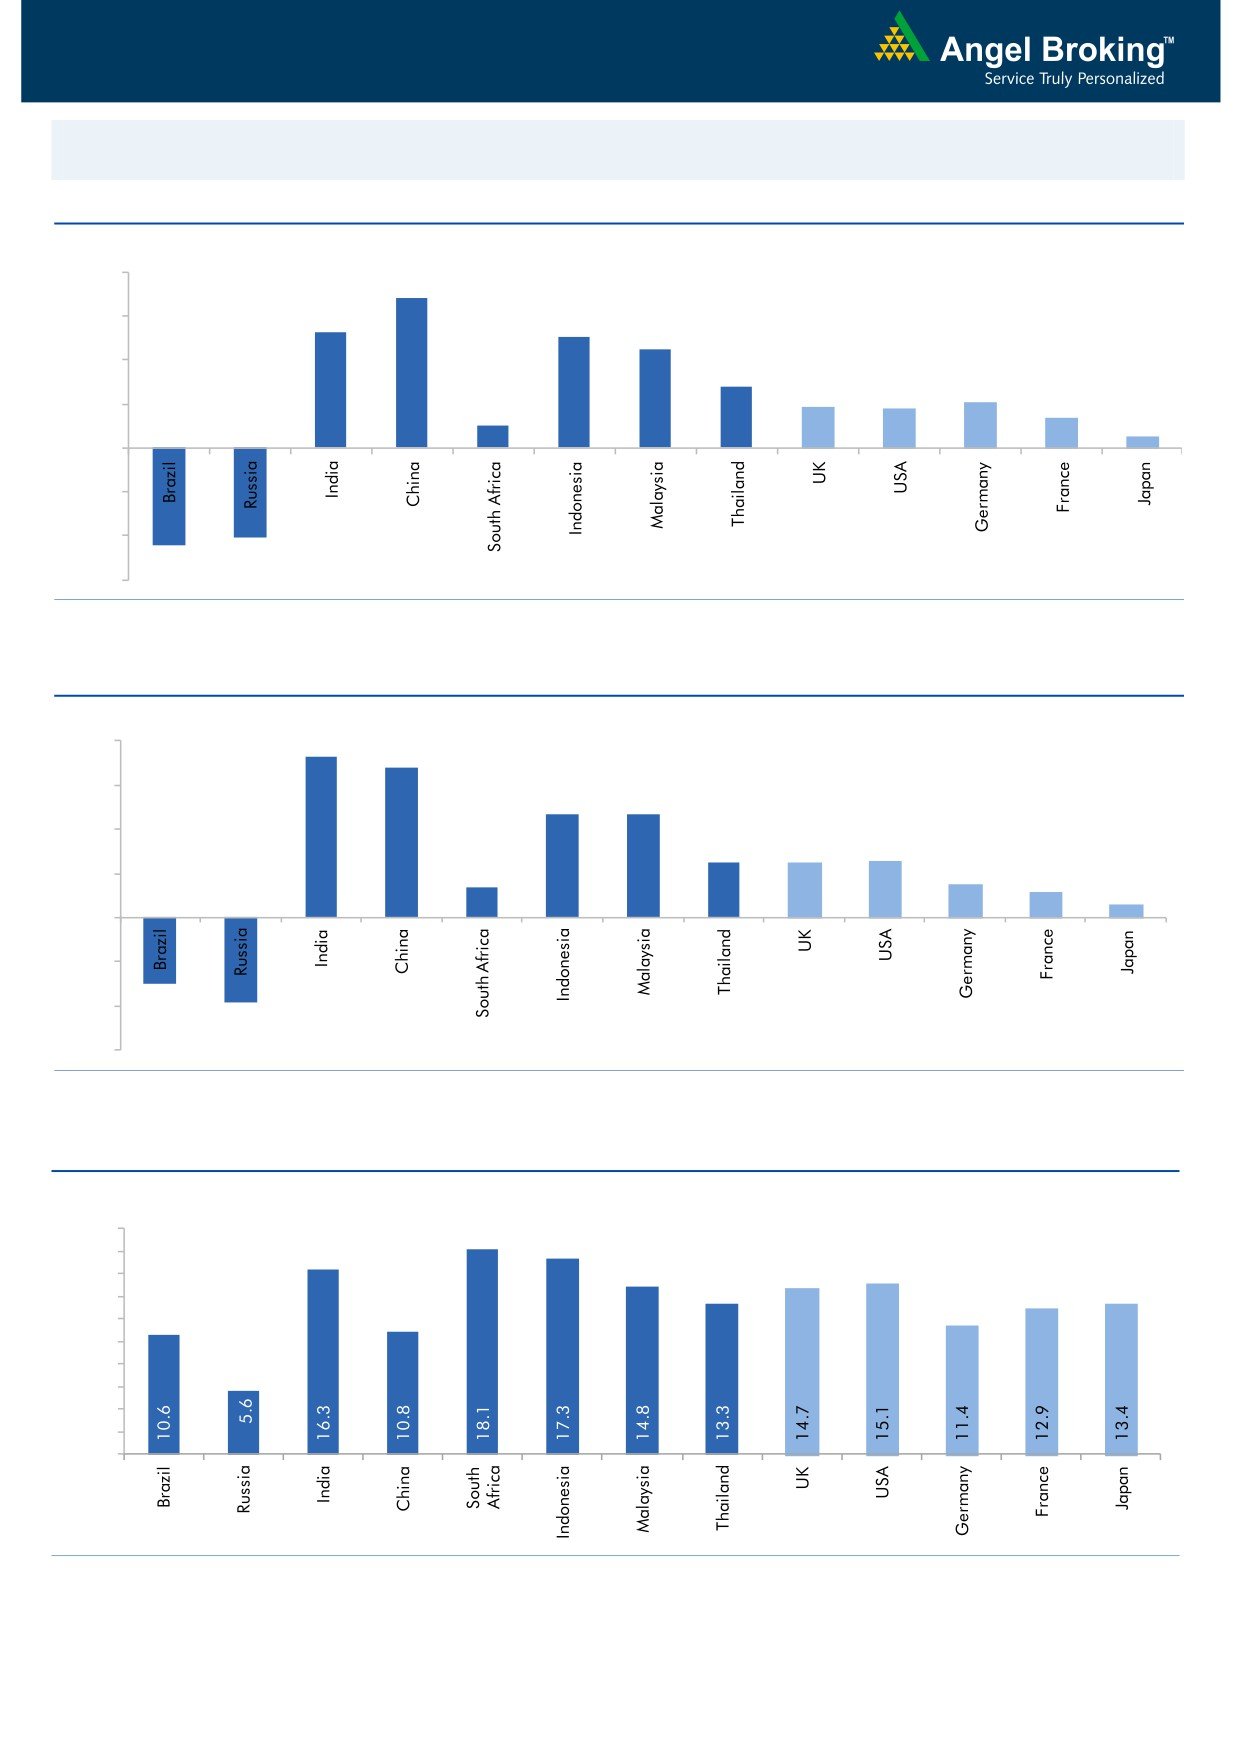
Global watch
Exhibit 1: Latest quarterly GDP Growth (%, yoy) across select developing and developed countries
(%)
8.0
6.8
6.0
5.3
5.0
4.5
4.0
2.8
1.9
1.8
2.1
2.0
1.4
1.0
0.5
-
(2.0)
(4.0)
(4.1)
(4.5)
(6.0)
Source: Bloomberg, Angel Research
Exhibit 2: 2015 GDP Growth projection by IMF (%, yoy) across select developing and developed countries
(%)
8.0
7.3
6.8
6.0
4.7
4.7
4.0
2.5
2.5
2.6
1.4
1.5
2.0
1.2
0.6
-
(2.0)
(3.0)
(4.0)
(3.8)
(6.0)
Source: IMF, Angel Research
Exhibit 3: One year forward P-E ratio across select developing and developed countries
(x)
20.0
18.0
16.0
14.0
12.0
10.0
8.0
6.0
4.0
2.0
-
Source: IMF, Angel Research
Market Outlook
February 29, 2016
Exhibit 4: Relative performance of indices across globe
Returns (%)
Country
Name of index
Closing price
1M
3M
1YR
Brazil
Bovespa
41,593
11.1
(11.3)
(17.3)
Russia
Micex
1,817
7.1
(2.3)
4.6
India
Nifty
7,030
(5.5)
(10.8)
(19.8)
China
Shanghai Composite
2,767
(7.0)
(23.8)
(12.4)
South Africa
Top 40
43,858
1.8
(6.3)
(7.3)
Mexico
Mexbol
43,473
4.7
(2.6)
(0.8)
Indonesia
LQ45
828
5.8
5.2
(10.6)
Malaysia
KLCI
1,663
3.9
0.2
(8.1)
Thailand
SET 50
860
8.2
(4.0)
(19.3)
USA
Dow Jones
16,640
5.1
(6.3)
(8.3)
UK
FTSE
6,096
1.8
(3.8)
(12.2)
Japan
Nikkei
16,188
(3.1)
(18.6)
(11.0)
Germany
DAX
9,513
(3.7)
(13.0)
(16.6)
France
CAC
4,315
(1.3)
(12.6)
(12.9)
Source: Bloomberg, Angel Research
Stock Watch
February 29, 2016
Company Name
Reco
CMP
Target
Mkt Cap
Sales ( Čcr )
OPM(%)
EPS (Č)
PER(x)
P/BV(x)
RoE(%)
EV/Sales(x)
(Č)
Price ( Č)
( Č cr )
FY16E FY17E
FY16E
FY17E
FY16E
FY17E
FY16E
FY17E
FY16E
FY17E
FY16E
FY17E
FY16E
FY17E
Agri / Agri Chemical
Rallis
Neutral
146
-
2,842
2,097
2,415
14.4
14.4
9.5
11.0
15.4
13.3
3.1
2.6
21.1
21.3
1.4
1.2
United Phosphorus
Buy
380
480
16,276
12,500
14,375
18.3
18.3
29.8
35.9
12.7
10.6
2.4
2.0
20.0
20.3
1.4
1.1
Auto & Auto Ancillary
Ashok Leyland
Buy
86
111
24,346
17,995
21,544
11.4
11.6
3.4
4.7
25.2
18.2
4.4
4.1
17.7
22.2
1.3
1.1
Bajaj Auto
Buy
2,237
2,585
64,727
22,709
25,860
20.9
20.1
129.0
143.6
17.3
15.6
5.3
4.6
30.7
29.4
2.4
2.1
Bharat Forge
Buy
742
875
17,271
7,351
8,318
19.9
19.7
31.2
36.5
23.8
20.3
4.3
3.6
19.3
19.2
2.5
2.2
Eicher Motors
Accumulate
18,886
20,044
51,295
15,556
16,747
15.5
17.3
464.8
597.5
40.6
31.6
14.8
10.9
36.2
34.3
3.2
2.9
Gabriel India
Buy
77
101
1,100
1,415
1,544
8.7
9.0
4.6
5.4
16.6
14.2
3.0
2.7
18.1
18.9
0.8
0.7
Hero Motocorp
Accumulate
2,557
2,864
51,063
28,244
30,532
15.5
15.9
156.7
168.5
16.3
15.2
6.5
5.5
39.9
36.4
1.6
1.5
Jamna Auto Industries Buy
122
160
972
1,281
1,473
11.2
11.5
7.6
9.2
16.0
13.2
4.0
3.3
25.4
25.2
0.8
0.7
L G Balakrishnan & Bros Neutral
412
-
647
1,254
1,394
11.6
11.8
35.9
41.7
11.5
9.9
1.6
1.4
13.5
13.8
0.6
0.6
Mahindra and Mahindra Accumulate
1,230
1,364
76,370
38,416
42,904
13.7
13.9
54.8
63.4
22.4
19.4
3.5
3.1
15.4
15.8
1.6
1.4
Maruti
Neutral
3,409
-
102,981
57,865
68,104
16.4
16.7
176.3
225.5
19.3
15.1
3.8
3.2
19.4
21.2
1.6
1.3
Minda Industries
Buy
800
1,047
1,269
2,523
2,890
8.7
9.0
55.0
65.4
14.6
12.2
2.8
2.3
19.3
18.7
0.6
0.5
Motherson Sumi
Buy
220
313
29,080
39,343
45,100
8.8
9.1
10.1
12.5
21.8
17.6
6.9
5.4
35.3
34.4
0.8
0.7
Rane Brake Lining
Buy
344
465
272
454
511
11.5
12.0
25.2
31.0
13.7
11.1
2.0
1.8
14.9
16.6
0.7
0.7
Setco Automotive
Neutral
32
-
422
594
741
12.7
13.7
1.7
3.2
18.6
9.9
2.0
1.7
10.4
16.9
1.2
1.0
Tata Motors
Buy
302
371
87,251
259,686
273,957
13.0
13.4
25.9
29.5
11.7
10.2
1.5
1.3
8.0
9.0
0.5
0.5
TVS Motor
Buy
265
330
12,568
11,263
13,122
6.9
8.5
9.2
15.0
28.8
17.6
6.6
5.2
22.7
29.6
1.1
0.9
Amara Raja Batteries
Buy
861
1,040
14,704
4,892
5,871
17.4
17.6
28.8
37.1
29.9
23.2
7.0
5.6
23.4
24.1
3.0
2.4
Exide Industries
Buy
129
162
10,991
6,950
7,784
14.4
14.8
6.6
7.3
19.6
17.7
2.5
2.3
12.6
12.8
1.3
1.2
Apollo Tyres
Buy
155
183
7,895
12,056
12,714
17.2
16.4
23.0
20.3
6.7
7.6
1.2
1.0
17.7
13.6
0.7
0.7
Ceat
Buy
931
1,119
3,764
6,041
6,597
14.1
13.7
99.5
111.9
9.4
8.3
1.8
1.5
19.6
18.5
0.8
0.7
JK Tyres
Neutral
76
-
1,724
7,446
7,669
15.2
14.0
19.6
18.4
3.9
4.1
1.0
0.8
25.2
19.5
0.6
0.5
Swaraj Engines
Accumulate
820
919
1,018
552
630
14.2
14.7
44.6
54.1
18.4
15.2
4.3
3.9
23.2
25.6
1.7
1.4
Subros
Accumulate
77
81
461
1,293
1,527
11.8
11.9
4.2
6.7
18.3
11.5
1.4
1.3
7.7
11.5
0.7
0.6
Indag Rubber
Neutral
152
-
399
283
329
17.0
17.2
13.0
15.4
11.7
9.9
2.6
2.1
21.8
21.6
1.1
0.9
Capital Goods
ACE
Neutral
35
-
351
660
839
4.7
8.2
1.0
3.9
35.5
9.1
1.1
1.0
3.2
11.3
0.7
0.5
BEML
Buy
954
1,157
3,971
3,277
4,006
6.0
8.9
36.2
64.3
26.3
14.8
1.8
1.7
5.7
11.7
1.3
1.0
Bharat Electronics
Buy
1,056
1,414
25,338
7,737
8,634
16.8
17.2
54.0
61.5
19.6
17.2
2.8
2.5
39.3
45.6
2.4
2.0
Stock Watch
February 29, 2016
Company Name
Reco
CMP
Target
Mkt Cap
Sales ( Čcr )
OPM(%)
EPS (Č)
PER(x)
P/BV(x)
RoE(%)
EV/Sales(x)
(Č)
Price ( Č)
( Č cr )
FY16E
FY17E
FY16E
FY17E
FY16E
FY17E
FY16E
FY17E
FY16E
FY17E
FY16E
FY17E
FY16E
FY17E
Capital Goods
Voltas
Buy
226
353
7,465
5,363
5,963
8.0
9.1
11.0
13.8
20.5
16.4
3.2
2.8
16.2
17.9
1.3
1.2
BGR Energy
Neutral
92
-
666
3,615
3,181
9.5
9.4
16.7
12.4
5.5
7.4
0.5
0.5
10.0
7.0
0.6
0.8
BHEL
Neutral
95
-
23,277
33,722
35,272
10.8
11.7
10.5
14.2
9.1
6.7
0.7
0.6
7.0
9.0
0.8
0.7
Blue Star
Buy
316
439
2,846
3,548
3,977
6.3
6.9
13.7
17.2
23.1
18.4
5.8
3.8
26.1
25.4
0.9
0.8
Crompton Greaves
Neutral
128
-
8,010
13,484
14,687
4.9
6.2
4.5
7.1
28.4
18.0
2.0
1.9
7.2
10.8
0.7
0.7
Greaves Cotton
Neutral
119
-
2,916
1,655
1,755
16.6
16.8
7.4
7.8
16.1
15.3
3.2
3.1
21.1
20.6
1.7
1.6
Inox Wind
Buy
219
458
4,853
4,980
5,943
17.0
17.5
26.6
31.6
8.2
6.9
2.5
1.8
35.0
30.0
1.1
0.9
KEC International
Neutral
104
-
2,663
8,791
9,716
6.1
6.8
5.4
8.2
19.2
12.6
1.9
1.8
10.0
14.0
0.5
0.5
Thermax
Neutral
741
-
8,827
6,413
7,525
7.4
8.5
30.5
39.3
24.3
18.9
3.7
3.3
15.0
17.0
1.4
1.1
Cement
ACC
Neutral
1,195
-
22,435
13,151
14,757
16.4
18.3
63.9
83.4
18.7
14.3
2.4
2.2
13.3
16.1
1.5
1.3
Ambuja Cements
Neutral
189
-
29,261
11,564
12,556
19.4
20.7
8.9
10.1
21.2
18.7
2.7
2.5
12.8
13.8
2.2
2.0
HeidelbergCement
Neutral
64
-
1,439
1,772
1,926
13.3
15.4
1.0
3.0
63.5
21.2
1.6
1.5
2.6
7.9
1.4
1.2
India Cements
Neutral
68
-
2,073
4,216
4,840
18.0
19.5
4.0
9.9
16.9
6.8
0.7
0.6
4.0
9.5
0.8
0.6
JK Cement
Buy
480
605
3,353
3,661
4,742
10.1
15.8
7.5
28.5
63.9
16.8
1.9
1.7
7.5
22.9
1.4
1.0
J K Lakshmi Cement
Neutral
266
-
3,135
2,947
3,616
16.7
19.9
11.5
27.2
23.2
9.8
2.2
1.9
9.8
20.8
1.5
1.2
Mangalam Cements
Neutral
161
-
430
1,053
1,347
10.5
13.3
8.4
26.0
19.2
6.2
0.8
0.8
4.3
12.5
0.8
0.6
Orient Cement
Neutral
137
-
2,796
1,854
2,524
21.2
22.2
7.7
11.1
17.7
12.3
2.6
2.2
13.3
15.7
2.2
1.6
Ramco Cements
Neutral
355
-
8,454
4,036
4,545
20.8
21.3
15.1
18.8
23.5
18.9
2.9
2.6
12.9
14.3
2.6
2.2
Shree Cement^
Neutral
10,344
-
36,035
7,150
8,742
26.7
28.6
228.0
345.5
45.4
29.9
6.7
5.6
15.7
20.3
4.8
3.8
UltraTech Cement
Accumulate
2,775
3,107
76,165
24,669
29,265
18.2
20.6
82.0
120.0
33.9
23.1
3.6
3.2
11.3
14.7
3.2
2.7
Construction
ITNL
Neutral
65
-
2,140
7,360
8,825
34.0
35.9
7.0
9.0
9.3
7.2
0.3
0.3
3.2
3.7
3.7
3.6
KNR Constructions
Buy
462
603
1,300
937
1,470
14.3
14.0
44.2
38.6
10.5
12.0
2.1
1.8
15.4
15.4
1.5
1.0
Larsen & Toubro
Buy
1,111
1,310
103,459
58,870
65,708
8.3
10.3
42.0
53.0
26.5
21.0
1.8
1.7
8.8
11.2
2.0
1.8
Gujarat Pipavav Port
Neutral
150
-
7,232
629
684
51.0
52.2
6.4
5.9
23.4
25.4
3.1
2.8
15.9
12.7
11.2
10.1
MBL Infrastructures
Buy
120
285
497
2,313
2,797
12.2
14.6
19.0
20.0
6.3
6.0
0.7
0.6
11.3
10.6
0.9
0.8
Nagarjuna Const.
Neutral
61
-
3,394
7,892
8,842
8.8
9.1
3.0
5.3
20.4
11.5
1.0
0.9
5.0
8.5
0.7
0.6
PNC Infratech
Buy
465
558
2,383
1,873
2,288
13.2
13.5
24.0
32.0
19.4
14.5
1.9
1.7
12.1
12.3
1.4
1.1
Simplex Infra
Neutral
201
-
992
5,955
6,829
10.3
10.5
16.0
31.0
12.5
6.5
0.7
0.6
5.3
9.9
0.7
0.6
Power Mech Projects
Neutral
575
-
846
1,539
1,801
12.8
12.7
59.0
72.1
9.8
8.0
1.5
1.2
18.6
16.8
0.6
0.5
Stock Watch
February 29, 2016
Company Name
Reco
CMP
Target
Mkt Cap
Sales ( Čcr )
OPM(%)
EPS (Č)
PER(x)
P/BV(x)
RoE(%)
EV/Sales(x)
(Č)
Price ( Č)
( Č cr )
FY16E
FY17E
FY16E
FY17E
FY16E
FY17E
FY16E
FY17E
FY16E
FY17E
FY16E
FY17E
FY16E
FY17E
Construction
Sadbhav Engineering
Buy
208
289
3,561
3,481
4,219
10.7
10.8
8.2
11.7
25.3
17.7
2.4
2.1
10.3
13.5
1.3
1.1
NBCC
Buy
870
1,089
10,438
5,816
7,382
6.9
7.7
29.6
39.8
29.4
21.9
5.3
4.2
24.1
26.7
1.5
1.2
MEP Infra
Neutral
39
-
626
1,956
1,876
28.1
30.5
1.3
3.0
29.6
12.8
6.2
4.2
21.2
32.8
1.7
1.7
SIPL
Neutral
77
-
2,719
675
1,042
62.4
64.7
-
-
2.9
3.3
-
-
15.7
10.6
Financials
Allahabad Bank
Neutral
44
-
2,645
8,569
9,392
2.8
2.9
16.3
27.5
2.7
1.6
0.3
0.2
7.6
11.9
-
-
Axis Bank
Buy
386
494
91,900
26,473
31,527
3.5
3.6
35.7
43.5
10.8
8.9
1.8
1.6
17.9
18.9
-
-
Bank of Baroda
Neutral
133
-
30,565
18,485
21,025
1.9
2.0
13.5
21.1
9.9
6.3
0.8
0.7
7.3
10.6
-
-
Bank of India
Neutral
84
-
6,808
15,972
17,271
1.9
2.0
15.3
33.4
5.5
2.5
0.3
0.2
3.6
7.6
-
-
Canara Bank
Neutral
161
-
8,764
15,441
16,945
2.0
2.1
46.6
70.4
3.5
2.3
0.3
0.3
8.0
11.2
-
-
Dena Bank
Neutral
26
-
1,678
3,440
3,840
2.1
2.3
7.3
10.0
3.6
2.6
0.3
0.2
6.1
7.9
-
-
Federal Bank
Neutral
46
-
7,910
3,477
3,999
3.0
3.0
5.0
6.2
9.2
7.4
0.9
0.8
10.6
11.9
-
-
HDFC
Neutral
1,055
-
166,572
10,358
11,852
3.3
3.3
41.1
47.0
25.7
22.4
4.9
4.4
24.7
24.9
-
-
HDFC Bank
Buy
960
1,262
242,467
38,309
47,302
4.3
4.3
49.3
61.1
19.5
15.7
3.4
2.9
18.5
19.7
-
-
ICICI Bank
Buy
185
254
107,451
34,279
39,262
3.3
3.3
21.0
24.4
8.8
7.6
1.5
1.3
14.4
14.7
-
-
IDBI Bank
Neutral
56
-
10,574
9,625
10,455
1.8
1.8
8.5
14.2
6.5
3.9
0.4
0.4
5.9
9.3
-
-
Indian Bank
Neutral
77
-
3,715
6,160
6,858
2.5
2.5
24.5
29.8
3.2
2.6
0.3
0.2
7.7
8.6
-
-
LIC Housing Finance
Buy
409
592
20,621
3,101
3,745
2.5
2.5
33.0
40.2
12.4
10.2
2.3
2.0
19.7
20.5
-
-
Oriental Bank
Neutral
79
-
2,355
7,643
8,373
2.4
2.4
37.2
45.4
2.1
1.7
0.2
0.2
8.2
9.4
-
-
Punjab Natl.Bank
Neutral
73
-
14,236
23,638
26,557
2.8
2.8
17.9
27.2
4.1
2.7
0.4
0.3
8.5
12.0
-
-
South Ind.Bank
Neutral
17
-
2,255
1,965
2,185
2.5
2.5
2.5
3.3
6.7
5.1
0.7
0.6
9.5
11.7
-
-
St Bk of India
Accumulate
156
177
121,293
79,958
86,061
2.6
2.6
13.4
20.7
11.7
7.6
1.0
0.9
11.5
12.8
-
-
Union Bank
Neutral
109
-
7,469
12,646
14,129
2.3
2.4
31.0
39.1
3.5
2.8
0.4
0.3
9.8
11.4
-
-
Vijaya Bank
Neutral
30
-
2,590
3,536
3,827
1.9
1.9
5.5
6.7
5.5
4.5
0.5
0.4
7.8
8.8
-
-
Yes Bank
Accumulate
686
767
28,826
7,190
9,011
3.2
3.3
58.2
69.7
11.8
9.9
2.1
1.8
19.2
19.6
-
-
FMCG
Asian Paints
Neutral
861
-
82,577
16,553
19,160
16.0
16.2
17.7
21.5
48.7
40.0
12.9
11.6
29.4
31.2
4.8
4.2
Britannia
Neutral
2,715
-
32,572
8,481
9,795
14.0
14.1
65.5
78.3
41.5
34.7
19.6
16.1
38.3
41.2
3.7
3.2
Colgate
Neutral
834
-
22,685
4,836
5,490
19.5
19.7
48.5
53.2
17.2
15.7
12.6
11.0
99.8
97.5
4.6
4.0
Dabur India
Accumulate
240
267
42,281
9,370
10,265
17.1
17.2
7.3
8.1
32.8
29.7
9.9
8.0
33.7
30.6
4.4
4.0
GlaxoSmith Con*
Accumulate
5,564
6,118
23,402
4,919
5,742
17.2
17.4
168.3
191.2
33.1
29.1
9.4
8.0
28.8
28.9
4.3
3.7
Stock Watch
February 29, 2016
Company Name
Reco
CMP
Target
Mkt Cap
Sales ( Čcr )
OPM(%)
EPS (Č)
PER(x)
P/BV(x)
RoE(%)
EV/Sales(x)
(Č)
Price ( Č)
( Č cr )
FY16E FY17E
FY16E
FY17E
FY16E
FY17E
FY16E
FY17E
FY16E
FY17E
FY16E
FY17E
FY16E
FY17E
FMCG
Godrej Consumer
Neutral
1,199
-
40,845
10,168
12,886
16.1
16.1
32.1
38.4
37.4
31.2
7.6
7.0
19.7
21.0
4.1
3.2
HUL
Neutral
851
-
184,059
34,940
38,957
17.5
17.7
20.8
24.7
40.9
34.4
45.5
36.4
110.5
114.2
5.1
4.5
ITC
Buy
291
359
233,913
36,804
38,776
37.9
37.9
12.2
12.9
23.9
22.6
6.6
5.8
27.7
25.8
5.9
5.6
Marico
Neutral
238
-
30,674
6,551
7,766
15.7
16.0
10.4
12.5
22.9
19.0
6.7
5.5
33.2
32.4
4.6
3.9
Nestle*
Buy
5,107
6,646
49,244
11,291
12,847
22.2
22.3
158.9
184.6
32.1
27.7
16.8
15.1
55.0
57.3
4.2
3.7
Tata Global
Buy
105
144
6,611
8,635
9,072
9.8
9.9
6.5
7.6
16.1
13.8
1.6
1.5
6.8
7.4
0.7
0.7
IT
HCL Tech^
Buy
819
1,038
115,539
42,038
47,503
21.2
21.5
51.5
57.7
15.9
14.2
3.4
2.7
21.5
18.8
2.4
1.9
Infosys
Buy
1,121
1,347
257,499
61,850
69,981
27.5
27.5
59.4
65.7
18.9
17.1
4.0
3.4
21.2
20.1
3.4
2.9
TCS
Buy
2,215
2,854
436,391
108,487
122,590
28.3
28.5
122.8
138.4
18.0
16.0
6.9
6.2
38.0
38.9
3.6
3.2
Tech Mahindra
Buy
417
530
40,352
26,524
29,177
16.2
17.0
28.8
33.6
14.5
12.4
2.8
2.4
19.3
19.1
1.3
1.1
Wipro
Buy
532
680
131,337
50,808
56,189
23.7
23.8
37.3
40.7
14.3
13.1
2.7
2.5
19.2
17.7
2.0
1.7
Media
D B Corp
Buy
309
356
5,678
2,241
2,495
27.8
27.9
21.8
25.6
14.2
12.1
3.7
3.3
26.7
28.5
2.5
2.2
HT Media
Neutral
80
-
1,865
2,495
2,603
11.2
11.2
7.3
8.6
11.0
9.3
0.9
0.8
7.4
8.1
0.3
0.2
Jagran Prakashan
Buy
148
189
4,830
2,170
2,355
27.2
26.2
8.9
9.9
16.6
14.9
3.5
3.0
20.9
20.5
2.1
2.0
Sun TV Network
Neutral
319
-
12,589
2,779
3,196
70.2
70.5
22.8
27.3
14.0
11.7
3.5
3.1
26.7
28.3
4.3
3.7
Hindustan Media
Neutral
260
-
1,908
920
1,031
20.0
20.0
19.2
20.9
13.5
12.5
2.2
1.9
16.4
15.3
1.6
1.4
Ventures
Metals & Mining
Coal India
Buy
311
380
196,660
76,167
84,130
19.9
22.3
22.4
25.8
13.9
12.1
5.0
4.9
35.5
41.0
1.9
1.7
Hind. Zinc
Accumulate
162
175
68,619
14,641
14,026
50.4
50.4
17.7
16.0
9.2
10.2
1.4
1.3
16.2
13.2
2.3
2.2
Hindalco
Neutral
69
-
14,341
104,356
111,186
8.7
9.5
6.7
11.1
10.3
6.3
0.4
0.4
3.5
5.9
0.7
0.6
JSW Steel
Neutral
1,100
-
26,591
42,308
45,147
16.4
20.7
(10.3)
49.5
22.2
1.2
1.2
(1.0)
5.6
1.7
1.6
NMDC
Neutral
80
-
31,698
8,237
10,893
46.6
44.5
10.0
11.7
8.0
6.9
0.9
0.8
12.5
13.0
3.6
2.8
SAIL
Neutral
35
-
14,331
45,915
53,954
7.2
10.5
1.5
4.4
23.0
7.9
0.3
0.3
2.3
4.1
1.0
0.9
Vedanta
Neutral
72
-
21,287
71,445
81,910
26.2
26.3
12.9
19.2
5.6
3.7
0.4
0.4
7.2
8.9
0.7
0.6
Tata Steel
Neutral
248
-
24,125
126,760
137,307
8.9
11.3
6.4
23.1
39.0
10.8
0.8
0.8
2.0
7.1
0.8
0.7
Oil & Gas
Cairn India
Neutral
124
-
23,220
11,323
12,490
49.4
51.0
20.7
20.7
6.0
6.0
0.4
0.4
6.4
6.1
1.1
0.5
GAIL
Neutral
304
-
38,511
64,856
70,933
9.1
9.6
24.0
28.9
12.7
10.5
1.1
1.0
8.8
9.6
0.8
0.7
ONGC
Neutral
215
-
183,943
154,564
167,321
36.8
37.4
28.6
32.5
7.5
6.6
1.0
0.9
12.7
13.5
1.4
1.3
Petronet LNG
Neutral
233
-
17,460
29,691
31,188
5.8
6.2
12.8
13.4
18.2
17.3
2.7
2.4
15.8
14.8
0.7
0.6
Indian Oil Corp
Buy
364
455
88,450
359,607
402,760
5.9
6.1
42.5
48.7
8.6
7.5
1.2
1.0
14.1
14.4
0.4
0.3
Stock Watch
February 29, 2016
Company Name
Reco
CMP
Target
Mkt Cap
Sales ( Čcr )
OPM(%)
EPS (Č)
PER(x)
P/BV(x)
RoE(%)
EV/Sales(x)
(Č)
Price ( Č)
( Č cr )
FY16E FY17E
FY16E
FY17E
FY16E
FY17E
FY16E
FY17E
FY16E
FY17E
FY16E
FY17E
FY16E
FY17E
Oil & Gas
Reliance Industries
Buy
951
1,150
307,905
304,775
344,392
12.6
13.4
91.3
102.6
10.4
9.3
1.2
1.1
11.8
12.0
0.9
0.8
Pharmaceuticals
Alembic Pharma
Neutral
607
-
11,447
3,274
3,802
26.9
19.4
35.0
28.7
17.4
21.2
7.7
5.8
55.6
31.2
3.5
2.9
Aurobindo Pharma
Buy
615
856
35,978
14,923
17,162
22.0
23.0
35.7
42.8
17.2
14.4
5.1
3.8
34.0
30.2
2.8
2.4
Aventis*
Neutral
4,165
-
9,592
2,082
2,371
17.4
20.8
118.2
151.5
35.2
27.5
5.2
4.1
19.9
25.5
4.3
3.6
Cadila Healthcare
Accumulate
321
352
32,837
10,224
11,840
21.0
22.0
14.6
17.6
22.0
18.2
6.0
4.7
30.8
29.0
3.3
2.7
Cipla
Buy
524
605
42,077
13,979
16,447
20.2
18.6
25.7
27.5
20.4
19.1
3.3
2.9
17.6
16.1
3.0
2.5
Dr Reddy's
Buy
2,993
3,933
51,040
16,838
19,575
25.0
23.1
167.5
178.8
17.9
16.7
3.8
3.1
23.1
20.4
3.0
2.5
Dishman Pharma
Neutral
305
-
2,459
1,733
1,906
21.5
21.5
17.0
19.9
17.9
15.3
1.8
1.6
10.5
11.2
1.9
1.7
GSK Pharma*
Neutral
3,150
-
26,681
2,870
3,158
20.0
22.1
59.5
68.3
52.9
46.1
15.6
16.1
28.5
34.3
8.8
8.0
Indoco Remedies
Neutral
253
-
2,334
1,033
1,199
15.9
18.2
9.4
13.6
26.9
18.6
4.0
3.4
15.7
19.7
2.3
2.0
Ipca labs
Buy
569
900
7,176
3,363
3,909
12.9
18.6
13.4
28.0
42.4
20.3
3.0
2.7
7.4
14.0
2.4
2.1
Lupin
Neutral
1,728
-
77,841
13,092
16,561
25.0
27.0
50.4
68.3
34.3
25.3
7.1
5.6
22.8
24.7
5.7
4.4
Sun Pharma
Accumulate
871
950
209,633
28,163
32,610
25.8
30.7
17.4
26.9
50.1
32.4
4.8
4.1
13.0
16.6
6.9
5.8
Power
Tata Power
Neutral
58
-
15,565
35,923
37,402
22.6
22.8
4.1
5.2
14.2
11.2
1.1
1.0
7.5
9.3
1.4
1.3
NTPC
Buy
121
146
100,059
87,271
99,297
23.5
23.5
11.8
13.3
10.3
9.1
1.2
1.1
11.5
12.2
2.2
1.9
Power Grid
Buy
133
170
69,816
20,702
23,361
86.7
86.4
12.1
13.2
11.1
10.1
1.6
1.5
15.6
15.1
8.3
7.7
Telecom
Bharti Airtel
Neutral
319
-
127,317
101,748
109,191
32.1
31.7
12.0
12.5
26.5
25.5
1.8
1.7
6.9
6.7
1.9
1.7
Idea Cellular
Neutral
105
-
37,967
34,282
36,941
32.0
31.5
5.9
6.2
17.9
17.0
1.6
1.5
9.9
9.3
1.7
1.6
zOthers
Abbott India
Neutral
4,815
-
10,232
2,715
3,153
14.5
14.1
134.3
152.2
35.9
31.6
9.0
7.4
27.4
25.6
3.5
2.9
Bajaj Electricals
Buy
157
237
1,588
4,719
5,287
5.2
5.8
8.6
12.7
18.4
12.4
2.1
1.8
11.4
14.8
0.3
0.3
Finolex Cables
Neutral
240
-
3,676
2,520
2,883
12.2
12.0
12.7
14.2
19.0
16.9
2.6
2.3
13.6
13.5
1.2
1.0
Goodyear India*
Buy
450
582
1,039
1,800
1,600
11.7
11.5
58.7
52.9
7.7
8.5
1.7
1.5
24.6
18.7
0.4
0.3
Hitachi
Neutral
969
-
2,635
1,779
2,081
7.8
8.8
21.8
33.4
44.5
29.0
7.2
5.8
17.4
22.1
1.5
1.3
Jyothy Laboratories
Neutral
261
-
4,722
1,620
1,847
11.5
11.5
7.3
8.5
35.8
30.8
4.6
4.3
13.3
14.4
2.8
2.4
MRF
Buy
32,308
45,575
13,702
20,316
14,488
21.4
21.1
5,488.0
3,798.0
5.9
8.5
2.0
1.6
41.1
21.2
0.6
0.8
Page Industries
Neutral
10,027
-
11,184
1,929
2,450
19.8
20.1
229.9
299.0
43.6
33.5
19.2
13.4
52.1
47.1
5.8
4.6
Relaxo Footwears
Neutral
384
-
4,604
1,767
2,152
12.3
12.5
19.3
25.1
19.9
15.3
4.9
3.8
27.7
27.8
2.7
2.2
Siyaram Silk Mills
Buy
962
1,354
901
1,636
1,815
11.5
11.5
89.9
104.1
10.7
9.2
1.8
1.5
17.9
17.8
0.7
0.6
Styrolution ABS India*
Neutral
498
-
876
1,271
1,440
8.6
9.2
32.0
41.1
15.6
12.1
1.6
1.4
10.7
12.4
0.7
0.6
Stock Watch
February 29, 2016
Company Name
Reco
CMP
Target
Mkt Cap
Sales ( Čcr )
OPM(%)
EPS (Č)
PER(x)
P/BV(x)
RoE(%)
EV/Sales(x)
(Č)
Price ( Č)
( Č cr )
FY16E
FY17E
FY16E
FY17E
FY16E
FY17E
FY16E
FY17E
FY16E
FY17E
FY16E
FY17E
FY16E
FY17E
zOthers
TVS Srichakra
Buy
2,064
3,217
1,580
2,035
2,252
15.9
15.3
248.6
268.1
8.3
7.7
3.6
2.6
43.6
33.9
0.8
0.7
HSIL
Buy
232
302
1,674
2,123
2,384
16.1
16.5
15.0
18.9
15.4
12.3
1.2
1.1
8.0
9.4
1.1
1.0
Kirloskar Engines India
Neutral
210
-
3,038
2,403
2,554
8.6
9.9
9.2
10.5
22.9
20.0
2.2
2.1
9.7
10.7
0.9
0.8
Ltd
M M Forgings
Buy
393
614
474
511
615
21.7
21.6
43.1
55.8
9.1
7.0
1.7
1.4
19.9
21.2
1.1
0.9
Banco Products (India) Neutral
92
-
657
1,208
1,353
11.0
12.3
10.8
14.5
8.5
6.3
1.0
0.9
11.9
14.5
0.5
0.4
Competent Automobiles Neutral
127
-
78
1,040
1,137
3.2
3.1
25.7
28.0
4.9
4.5
0.7
0.7
15.0
14.3
0.1
0.1
Nilkamal
Neutral
930
-
1,388
1,871
2,031
10.7
10.5
63.2
69.8
14.7
13.3
2.4
2.1
17.6
16.6
0.8
0.7
Visaka Industries
Buy
92
144
146
1,086
1,197
9.9
10.3
21.5
28.8
4.3
3.2
0.4
0.4
9.6
11.6
0.4
0.3
Transport Corporation of
Neutral
220
-
1,677
2,830
3,350
8.8
9.0
14.4
18.3
15.3
12.0
2.4
2.1
15.4
17.1
0.7
0.6
India
Elecon Engineering
Neutral
47
-
509
1,359
1,482
10.3
13.7
0.8
3.9
58.2
12.0
1.0
0.9
1.6
7.8
0.7
0.7
Surya Roshni
Buy
124
201
544
2,992
3,223
8.1
8.4
14.7
18.3
8.5
6.8
0.8
0.7
9.7
11.0
0.5
0.4
MT Educare
Neutral
144
-
572
286
366
18.3
17.7
7.7
9.4
18.6
15.3
3.9
3.4
20.2
21.1
1.9
1.4
Radico Khaitan
Buy
92
156
1,229
1,517
1,635
12.7
13.4
5.8
7.1
15.9
13.0
1.4
1.3
8.6
9.6
1.3
1.2
Garware Wall Ropes
Buy
281
473
614
862
974
11.2
11.2
24.9
29.6
11.3
9.5
1.7
1.5
15.1
15.4
0.7
0.6
Wonderla Holidays
Neutral
346
-
1,952
206
308
44.0
43.6
9.0
12.9
38.4
26.8
5.2
4.8
13.7
17.8
9.4
6.2
Linc Pen & Plastics
Accumulate
171
185
253
340
371
8.3
8.9
10.8
13.2
15.8
13.0
2.5
2.2
16.0
17.1
0.8
0.7
The Byke Hospitality
Neutral
153
-
613
222
287
20.5
20.5
5.6
7.6
27.1
20.2
5.1
4.2
18.9
20.8
2.8
2.2
Interglobe Aviation
Neutral
833
-
30,029
17,022
21,122
20.7
14.5
63.9
53.7
13.0
15.5
19.5
16.0
149.9
103.2
1.8
1.4
Coffee Day Enterprises
Neutral
225
-
4,637
2,692
2,964
17.0
18.6
-
4.7
-
47.5
2.8
2.6
0.2
5.5
2.1
2.0
Ltd
Navneet Education
Neutral
83
-
1,977
998
1,062
24.1
24.0
5.8
6.1
14.4
13.6
3.2
2.8
22.0
20.6
2.1
1.9
Navkar Corporation
Buy
156
265
2,224
365
436
38.3
37.5
5.6
5.9
27.7
26.5
1.7
1.6
6.3
6.1
6.9
6.0
Source: Company, Angel Research; Note: *December year end; #September year end; &October year end; Price as on February 26, 2016
Market Outlook
February 29, 2016
Research Team Tel: 022 - 39357800
DISCLAIMER
Angel Broking Private Limited (hereinafter referred to as “Angel”) is a registered Member of National Stock Exchange of India Limited,
Bombay Stock Exchange Limited and Metropolitian Stock Exchange of India Limited. It is also registered as a Depository Participant with
CDSL and Portfolio Manager with SEBI. It also has registration with AMFI as a Mutual Fund Distributor. Angel Broking Private Limited is a
registered entity with SEBI for Research Analyst in terms of SEBI (Research Analyst) Regulations, 2014 vide registration number
INH000000164. Angel or its associates has not been debarred/ suspended by SEBI or any other regulatory authority for accessing
/dealing in securities Market. Angel or its associates including its relatives/analyst do not hold any financial interest/beneficial ownership
of more than 1% in the company covered by Analyst. Angel or its associates/analyst has not received any compensation / managed or co
-managed public offering of securities of the company covered by Analyst during the past twelve months. Angel/analyst has not served as
an officer, director or employee of company covered by Analyst and has not been engaged in market making activity of the company
covered by Analyst.
This document is solely for the personal information of the recipient, and must not be singularly used as the basis of any investment
decision. Nothing in this document should be construed as investment or financial advice. Each recipient of this document should make
such investigations as they deem necessary to arrive at an independent evaluation of an investment in the securities of the companies
referred to in this document (including the merits and risks involved), and should consult their own advisors to determine the merits and
risks of such an investment.
Reports based on technical and derivative analysis center on studying charts of a stock's price movement, outstanding positions and
trading volume, as opposed to focusing on a company's fundamentals and, as such, may not match with a report on a company's
fundamentals.
The information in this document has been printed on the basis of publicly available information, internal data and other reliable sources
believed to be true, but we do not represent that it is accurate or complete and it should not be relied on as such, as this document is for
general guidance only. Angel Broking Pvt. Limited or any of its affiliates/ group companies shall not be in any way responsible for any
loss or damage that may arise to any person from any inadvertent error in the information contained in this report. Angel Broking Pvt.
Limited has not independently verified all the information contained within this document. Accordingly, we cannot testify, nor make any
representation or warranty, express or implied, to the accuracy, contents or data contained within this document. While Angel Broking
Pvt. Limited endeavors to update on a reasonable basis the information discussed in this material, there may be regulatory, compliance,
or other reasons that prevent us from doing so.
This document is being supplied to you solely for your information, and its contents, information or data may not be reproduced,
redistributed or passed on, directly or indirectly.
Neither Angel Broking Pvt. Limited, nor its directors, employees or affiliates shall be liable for any loss or damage that may arise from or
in connection with the use of this information.
Note: Please refer to the important ‘Stock Holding Disclosure' report on the Angel website (Research Section). Also, please refer to the
latest update on respective stocks for the disclosure status in respect of those stocks. Angel Broking Pvt. Limited and its affiliates may have
investment positions in the stocks recommended in this report.