Market Outlook
January 29, 2016
Market Cues
Domestic Indices
Chg (%)
(Pts)
(Close)
Indian markets are expected to open in red tracking the SGX Nifty.
BSE Sensex
(0.1)
(23)
24,470
U.S. indices ended in green as rise in oil prices and gains in Facebook outweighed
Nifty
(0.2)
(13)
7,425
pressure from declines in biotech stocks and concerns about economic growth. The
Mid Cap
(0.4)
(37)
10,211
major averages ended off session highs but recovered from an intraday dip into
Small Cap
(0.0)
(4)
10,755
negative territory.
Bankex
(0.9)
(161)
17,481
FTSE 100 endured another wildly unpredictable trading session. The blue-chip index
rallied 0.5% before nose-diving 1%. Volatility was spurred by huge swings in oil
Global Indices
Chg (%)
(Pts)
(Close)
amid rumors of production cuts. Brent crude spiked up after reports Saudi Arabia
Dow Jones
0.8
125
16,070
had proposed that oil-producing countries slash output by up to 5%. Commodity
stocks were among top FTSE risers. Royal Dutch shares advanced 2%, while BG
Nasdaq
0.9
39
4,507
Group added 1.4%. Both oil majors enjoyed an additional boost after BG’s
FTSE
(1.0)
(59)
5,932
shareholders voted through Shell’s £40bn takeover.
Nikkei
(0.7)
(122)
17,041
Hang Seng
0.8
143
19,196
Indian market ended lower amid volatility on January Future and Options (F&O)
Shanghai Com
(2.9)
(80)
2,656
series expiry day. Sensex has shed 6.3% and Nifty lost 6.6% in the Jan series. Bears
tightened grip on Dalal Street as US Fed spooked global markets on health of the
US economy. Banking and Capital Good indices fell most losing 1-2% from previous
Advances / Declines
BSE
NSE
close. FMCG index led by HUL and ITC gained the most today.
Advances
1,241
730
Declines
1,329
805
News & Result Analysis
Engineers India Ltd (EIL) OFS: SUBSCRIBE
Unchanged
175
68
Result Review: Rane Brake Lining, GPPL, Maruti, ICICI, Jyothy Labs
Detailed analysis on Pg2
Volumes (` Cr)
Investor’s Ready Reckoner
BSE
2,451
NSE
20,783
Key Domestic & Global Indicators
Stock Watch: Latest investment recommendations on 150+ stocks
Refer P7 onwards
Net Inflows (` Cr)
Net
Mtd
Ytd
FII
(170)
(11,848)
(4,031)
Top Picks
MFs
302
6,117
75,367
CMP
Target
Upside
Company
Sector
Rating
(`)
(`)
(%)
Amara Raja Batteries Auto & Auto Ancillary
Buy
819
1,040
27.0
Top Gainers
Price (`)
Chg (%)
HCL Tech
IT
Buy
844
1,132
22.9
Bhusanstl
40
9.5
Larsen & Toubro
Construction
Buy
1,077
1,646
52.3
Finolexind
306
9.3
LIC Housing Finance Financials
Buy
474
592
24.8
Gruh
259
7.2
Navkar Corporation Others
Buy
195
265
35.7
Niittech
512
6.5
More Top Picks on Pg6
Cairn
119
5.3
Key Upcoming Events
Previous
Consensus
Date
Region
Event Description
Reading
Expectations
Top Losers
Price (`)
Chg (%)
Jan 29
USA
GDP (QoQ, Annualised)
2.00
0.80
Jubilant
317
(6.0)
Feb 01
UK
PMI Manufacturing
51.90
51.80
Relinfra
438
(4.7)
Feb 02
Ger
Unemployment change (‘000s)
(14.00)
(9.50)
Cesc
432
(3.8)
India
RBI Repo Rate
6.75
6.75
6.(
Gail
356
(3.1)
Ncc
64
(3.0)
As on January 28, 2015
Market Outlook
January 29, 2016
Engineers India Ltd (EIL) OFS: SUBSCRIBE
To ride on Hydro-carbons capex cycle: Reduction in oil subsidy during FY2014-15
has led to improvement in cash flows of PSU oil marketing companies (OMCs) in
the last 12-18 months. In our view, improved cash flows and higher utilization
levels of OMCs would drive the next leg of capex on their part. We anticipate
OMCs to pursue capex of
~`57,000-67,500cr during FY2016-18E.
`13,000-15,500cr of such capex should see awarding in the next 12 months.
Engineers India (EIL) is engaged in design and consulting works, which is front
ended, and draws business when an OMC pursues capex. Given that domestic
consulting players lack bandwidth and are unable to meet qualification criterion
for getting contracted coupled with foreign players lacking comfort to work with
domestic PSUs, positions EIL to emerge as strong beneficiary from uptick in the
Hydro-carbon awarding activity. Also, order wins from International markets could
act as fillip in terms of the company achieving order inflow growth in future. On
the whole, we expect EIL to report Order Book CAGR of 13% during FY2015-18E
to `5,214cr (translating into an OB/LTM sales ratio of 2.7x).
Margins to improve, going forward: On the back of improved outlook on the order
book, we expect revenues to report a 3.6% CAGR during FY2015-18E. Given the
expected shift in business mix, we expect EBITDA margins to improve from 13.3%
in FY2015 to 19.1% in FY2018E. Given the company’s cash rich status, and its
minimal capex requirement, we expect EBITDA margin expansion to flow down to
PAT level. We expect PAT margins to expand from 18.0% in FY2015 to 24.2% in
FY2018E.
Attractive valuations: EIL’s stock price in recent times has corrected owing to
weakness in order awarding and depressed earnings being reported. At closing
price of `194, EIL stock factors in all the near-term concerns. At the offer-for-sale
(OFS) price of `189, EIL stock trades at FY2017E P/E multiple of 16.5x. On
considering 5% discount for retail investors, translating into an OFS price of `180,
EIL stock is available at FY2017E P/E ratio of 15.7x which is attractive considering
the cash rich status of the company (`2,279cr cash as of 2QFY2016) and its
strong market positioning within the domestic Hydro-Carbons consulting space.
Further, in our view this space is likely to see strong awarding activity from here-
on. Accordingly, given the attractive valuation, we recommend investors to apply
for EIL shares in the OFS.
Result Review
Rane Brake Lining (CMP: `392/ TP: `465/Upside: 18.6%)
Rane Brake Lining (RBL) 3QFY2016 results were ahead of our estimates on back of
robust operating performance. Revenues grew 10% yoy to `111.7cr on back of
improved demand scenario in the passenger vehicle space due to festive season,
continued double digit growth in the MHCV segment and pick up in the
replacement demand. RBL OEM segment and aftermarket segment reported
growth of 7% and 11% respectively. Given the raw material control initiatives and
a better product mix, the operating margins expanded 310 bp yoy to 14.5%
coming ahead of our estimates of 13.5%. Net Profit at `10cr almost doubled on
yoy basis and was better than our estimates of `8.9cr. Given the better than
Market Outlook
January 29, 2016
anticipated numbers, we are upgrading our target price to `465 (based on 15x
FY2017 EPS of `31).
Y/E
Sales OPM
PAT
EPS ROE P/E P/BV EV/EBITDA EV/Sales
Mar
(` cr)
(%)
(` cr)
(`)
(%)
(x)
(x)
(x)
(x)
FY2016E
454
11.5
20
25.2 14.9 15.6
2.3
7.0
0.8
FY2017E
511
12.0
25
31.0 16.6 12.6
2.1
6.1
0.7
Gujarat Pipavav Port (CMP: `154/ TP: / Upside:)
For the quarter ended Dec-2015, Gujarat Pipavav Port Ltd (GPPL) reported a
10.3% YoY decline in revenue to `152cr, which is below our expectation of
`170cr. This is owing to 64% YoY decline in Dry Bulk volumes and 9.5% decline in
Container business. Loss in the Dry Bulk business was compensated up to certain
extent by 29% YoY increase in Liquid Cargo business and ramp-up in the Ro-Ro
business. Higher contribution of Liquid Farms business and lower contribution of
low margin Dry Bulk business in our view led to 659bps YoY EBITDA margin
expansion to 57.1%. Despite EBITDA margin expansion, deferred tax of `28cr ate
in to the PAT margins of the company, which declined from 52.7% a year ago to
35.0% in 3QFY2016. Reported PAT of `53cr, was lower than our estimate of
`68cr. Currently, we have NEUTRAL rating on the stock.
Maruti Suzuki (CMP: `4,094/ TP: / Upside:)
Maruti Suzuki India Ltd (MSIL) 3QFY2016 operating results adjusted for one off
items were in line with our estimates. MSIL revenues, expectedly grew 20% yoy to
`15,082cr driven majorly by a robust 16% volume growth. New product launches
coupled with robust festive demand enabled MSIL to clock strong volumes.
Realisation/vehicle grew 4% led by a better product mix. MSIL incurred one off
expenditures to the tune of `175cr during the quarter (`150cr on account of
inventory decretion and `25cr due to higher employee expenses due to higher
bonus declared retrospectively for 21 months). Adjusted for the one off items,
operating margins came in at 15.5% which is line with our estimates. However,
MSIL reported lower other income of `32cr (as against `102cr reported in
corresponding quarter last year) which led to the Adjusted Net Profit coming in at
`1,142cr as against our estimate of `1,270cr. We currently have Neutral rating on
the stock.
Y/E
Sales OPM
PAT
EPS ROE P/E P/BV EV/EBITDA EV/Sales
Mar
(` cr)
(%)
(` cr)
(`)
(%)
(x)
(x)
(x)
(x)
FY2016E
57,865
16.4
20
176.3 19.4 23.2
4.5
12.1
1.9
FY2017E
68,104
16.7
25
225.5 21.2 18.2
3.9
9.6
1.6
ICICI Bank (CMP: `233/ TP: 254/ Upside: 8.9%)
ICICI Bank reported disappointing set of number for 3QFY2016 results with PAT
growth of 4.5% yoy to `3,018cr in 3QFY2016 which was below our expectations.
NII grew at steady pace of 13.3% yoy which was in-line with the expectations likely
due to growth in advances at 15.8% yoy.
Market Outlook
January 29, 2016
However, the bank disappointed on the asset quality front since the Gross NPA
ratio rose by 95bp qoq to 4.72% while the Net NPA ratio rose by 63bps qoq to
2.28% in 3QFY2016. The increase in the NPA ratios is due to decline and
continuing weakness in the global steel cycle; and also due to RBI’s directives of
early and conservative recognition of stressed assets and provisioning thereof
by March 31, 2016. Provisions spiked up 190.3% yoy to `2,844.1cr as compared
to `942.2cr for 2QFY2016 and `979.7cr for 3QFY2015. At CMP, the bank’s core
banking business (after adjusting `67/share towards value of subsidiaries) is
trading at 1.2x FY2017E ABV. We recommend ACCUMULATE rating on the stock.
Y/E
Op. Inc NIM
PAT
EPS
ABV ROA ROE
P/E
P/ABV
Mar
(` cr)
(%)
(` cr)
(`)
(%)
(x)
(x)
(x)
(x)
FY2016E
34,279
3.3
12,244
21.0
124.6
1.5
14.4
11.1
1.9
FY2017E
39,262
3.3
14,222
24.4
147.4
1.6
14.7
9.6
1.6
Jyothy Labs (CMP: `283/ TP: / Upside: )
For 3QFY2016, Jyothy Labs reported numbers that were in-line with our estimate.
Its consolidated top-line for the quarter increased by 6.9% YoY to `385cr, which is
marginally lower than our estimates of `392cr. Aided by benign input prices, the
gross margins witnessed a 205bp YoY expansion to 52.5% against our estimate of
199bp. On account of lower Employee Stock Options (ESOP) expense (`2.5 cr
against `11.8cr in 3QFY15), the employee expense declined by 9.3% YoY to
`44cr. On percentage of sales basis, employee expense declined by 205bp YoY to
11.5% of sales while other expenses increased by 93bp YoY to 27.8% of sales.
Aided by lower raw material cost and employee expense, the EBITDA grew by
40.5% YoY to `51cr which is in-line with our estimate of `50cr. The EBITDA
margin at 13.2% is higher than our estimate of 12.6% owing to lower than
expected ESOP related expense. On the back of better operating performance,
lower interest outgo (`0.8cr vs. `3.7cr for 3QFY15) and higher other income, the
net profit grew by 47.8% YoY to `39cr which is marginally higher than our
estimate of `36cr.
On segmental basis, revenue from Home Care segment grew by an impressive
25.1% YoY to `82cr while Soaps and Detergent segment grew by modest 3.8%
YoY to `287cr. The Home Care segment reported profit of `6cr (vs. `0.7cr in
3QFY15) while EBIT for the Soaps and Detergent came in at `43cr as against
`42cr in 3QFY15. We currently have a NEUTRAL rating on the stock.
Quarterly Bloomberg Brokers Consensus Estimate
JSW Steel Ltd (Consol)- January 29, 2016
Particulars (` cr)
3QFY16E
3QFY15
y-o-y (%)
2QFY16
q-o-q (%)
Net sales
9,099
12,927
(29.6)
10,743
(15.3)
EBITDA
1,189
2,295
(48.2)
1,729
(31.2)
EBITDA margin (%)
13.1
17.8
16.1
Net profit
(196)
329
(159.6)
117
(267.5)
Market Outlook
January 29, 2016
NTPC Ltd- January 29, 2016
Particulars (` cr)
3QFY16E
3QFY15
y-o-y (%)
2QFY16
q-o-q (%)
Net sales
19,002
18,739
1.4
17,723
7.2
EBITDA
4,629
4,659
(0.6)
4,030
14.9
EBITDA margin (%)
24.4
24.9
22.7
Net profit
2,265
3,074
(26.3)
2,898
(21.8)
L&T Ltd (Consol)- January 29, 2016
Particulars (` cr)
3QFY16E
3QFY15
y-o-y (%)
2QFY16
q-o-q (%)
Net sales
26,377
23,848
10.6
23,393
12.8
EBITDA
3,082
2,890
6.6
2,591
19.0
EBITDA margin (%)
11.7
12.1
11.1
Net profit
1,043
866
20.4
996
4.7
Siemens India Ltd - January 29, 2016
Particulars (` cr)
3QFY16E
3QFY15
y-o-y (%)
2QFY16
q-o-q (%)
Net sales
2,293
2,322
(1.2)
3,231
(29.0)
EBITDA
196
253
(22.5)
282
(30.4)
EBITDA margin (%)
8.5
10.9
8.7
Net profit
122
168
(27.6)
219
(44.4)
Yes Bank Ltd - January 29, 2016
Particulars (` cr)
3QFY16E
3QFY15
y-o-y (%)
2QFY16
q-o-q (%)
PAT
635
540
17.6
610
4.1
Economic and Political News
Govt may award 10k km of road projects in FY16
Make in India, Smart Cities likely to create 5 lakh new jobs in FY17
New housing launches fall sharply, at 5-yr low in ‘15
Corporate News
Axiata, Airtel to merge Bangladesh ops
Religare gets CCI nod to sell 51% in MF biz to partner Invesco
USFDA red-flags lack of controls at Wockhardt's unit
Jaypee Group may sell more assets to cut debt
Market Outlook
January 29, 2016
Top Picks ★★★★★
Large Cap
Market Cap
CMP
Target
Upside
Company
Rationale
(` Cr)
(`)
(`)
(%)
To outpace battery industry growth due to better technological
Amara Raja Batteries
14,048
819
1,040
27.0
products leading to market share gains in both the automotive
OEM and replacement segments.
Earnings to grow strongly given the MHCV cyclical upturn.
Ashok Leyland
25,101
88
111
25.9
Focus on exports and LCV's provides additional growth
avenue.
The stock is trading at attractive valuations and is factoring all
HCL Tech
117,713
844
1,038
22.9
the bad news.
Strong visibility for a robust 20% earnings trajectory, coupled
HDFC Bank
261,561
1,033
1,262
22.2
with high quality of earnings on account of high quality retail
business and strategic focus on highly rated corporates.
Back on the growth trend, expect a long term growth of 14%
Infosys
261,473
1,131
1,347
19.1
to be a US$20bn in FY2020.
Well positioned to benefit from such expected gradual
recovery in the overall domestic capex cycle, given its presence
Larsen & Toubro
103,113
1,077
1,646
52.8
across various infrastructure segments, its execution
capabilities, and its strong balance sheet.
LICHF continues to grow its retail loan book at a healthy pace
with improvement in asset quality. We expect the company to
LIC Housing Finance
24,204
474
592
24.8
post a healthy loan book which is likely to reflect in a strong
earnings growth.
Source: Company, Angel Research
Mid Cap
Market Cap
CMP
Target
Upside
Company
Rationale
(` Cr)
(`)
(`)
(%)
Favourable outlook for the AC industry to augur well for
Cooling products business which is out pacing the market
Blue Star
3,216
355
439
23.6
growth. EMPPAC division's profitability to improve once
operating environment turns around.
Change in business focus towards high-margin chronic &
Garware Wall Ropes
747
344
473
37.5
lifestyle segments and increasing penetration in Europe and
US
Economic recovery to have favourable impact on advertising &
circulation revenue growth. Further, the acquisition of a radio
Jagran Prakashan
5,388
163
189
16.2
business (Radio City) would also boost the company's revenue
growth.
Massive capacity expansion along with rail advantage at ICD
Navkar Corporation
2,783
195
265
35.7
as well CFS augurs well for the company
Earnings boost on back of stable material prices and
Radico Khaitan
1,509
112
156
39.8
favourable pricing environment. Valuation discount to peers
provides additional comfort
Strong brands and distribution network would boost growth
Siyaram Silk Mills
1,035
1,072
1,354
26.4
going ahead. Stock currently trades at an inexpensive
valuation.
Structural shift in the Lighting industry towards LED lighting will
Surya Roshni
643
147
201
37.1
drive growth.
Source: Company, Angel Research
Market Outlook
January 29, 2016
Key Upcoming Events
Result Calendar
Date
Company
United Phosphorus, TVS Motor, Siemens, Suzlon Energy, Thermax, Blue Star, Yes Bank, Jagran Prakashan, PVR, JSW
Jan 29, 2016
Steel , Banco, Elecon Engineering, Indoco Remedies, NTPC
Jan 30, 2016
IDFC, Shriram Trans., Marico, Electrosteel Castings, Relaxo
Feb 1, 2016
Tech Mahindra, Transport Corporation of India
Feb 2, 2016
Amara Raja Batteries, Cummins India, Crompton Greaves
Feb 3, 2016
Mangalam Cement, Hexaware, IOC
Feb 4, 2016
Bajaj Auto, ABB, J K Lakshmi Cements, Mphasis, Tata Steel, Styrolution, Visaka Industries, Aventis
Feb 5, 2016
Bosch India, Lupin, Cadila Healthcare, Tata Power Co., PTC India
Feb 8, 2016
GlaxoSmith Con, Sterling Tools
Feb 9, 2016
Motherson Sumi, Apollo Tyres, Ramco Cements, Britannia, Dr Reddy's, CESC
Feb 10, 2016
Ambuja Cements, ACC, India Cements, Rural Elec.Corp., GSK Pharma, NHPC
Feb 11, 2016
Page Industries
Feb 12, 2016
M&M, FAG Bearings, Nestle
Source: Bloomberg, Angel Research
Global economic events release calendar
Date
Time
Country
Event Description
Unit
Period
Bloomberg Data
Last Reported Estimated
Jan 29, 2016
7:00PM US
GDP Qoq (Annualised)
% Change
4Q A
2.00
0.80
Feb 1, 2016
3:00PM UK
PMI Manufacturing
Value
Jan
51.90
51.80
6:30AM China
PMI Manufacturing
Value
Jan
49.70
49.60
Feb 2, 2016
2:25PM Germany
Unemployment change (000's)
Thousands
Jan
(14.00)
(9.50)
11:00AM India
RBI Reverse Repo rate
%
Feb 2
5.75
5.75
11:00AM India
RBI Repo rate
%
Feb 2
6.75
6.75
11:00AM India
RBI Cash Reserve ratio
%
Feb 2
4.00
4.00
Feb 4, 2016
5:30PM UK
BOE Announces rates
% Ratio
Feb 4
0.50
0.50
Feb 5, 2016
7:00PM US
Change in Nonfarm payrolls
Thousands
Jan
292.00
200.00
7:00PM US
Unnemployment rate
%
Jan
5.00
5.00
Feb 10, 2016
India
Imports YoY%
% Change
Jan
(3.90)
--
India
Exports YoY%
% Change
Jan
(14.70)
--
3:00PM UK
Industrial Production (YoY)
% Change
Dec
0.90
--
Feb 12, 2016 7:30AM India
Industrial Production YoY
% Change
Dec
(3.20)
--
3:30PM Euro Zone
Euro-Zone GDP s.a. (QoQ)
% Change
4Q A
0.30
--
12:30PM Germany
GDP nsa (YoY)
% Change
4Q P
1.80
--
Feb 15, 2016 12:00PM India
Monthly Wholesale Prices YoY%
% Change
Jan
(0.73)
--
China
Exports YoY%
% Change
Jan
(1.40)
--
Source: Bloomberg, Angel Research
Market Outlook
January 29, 2016
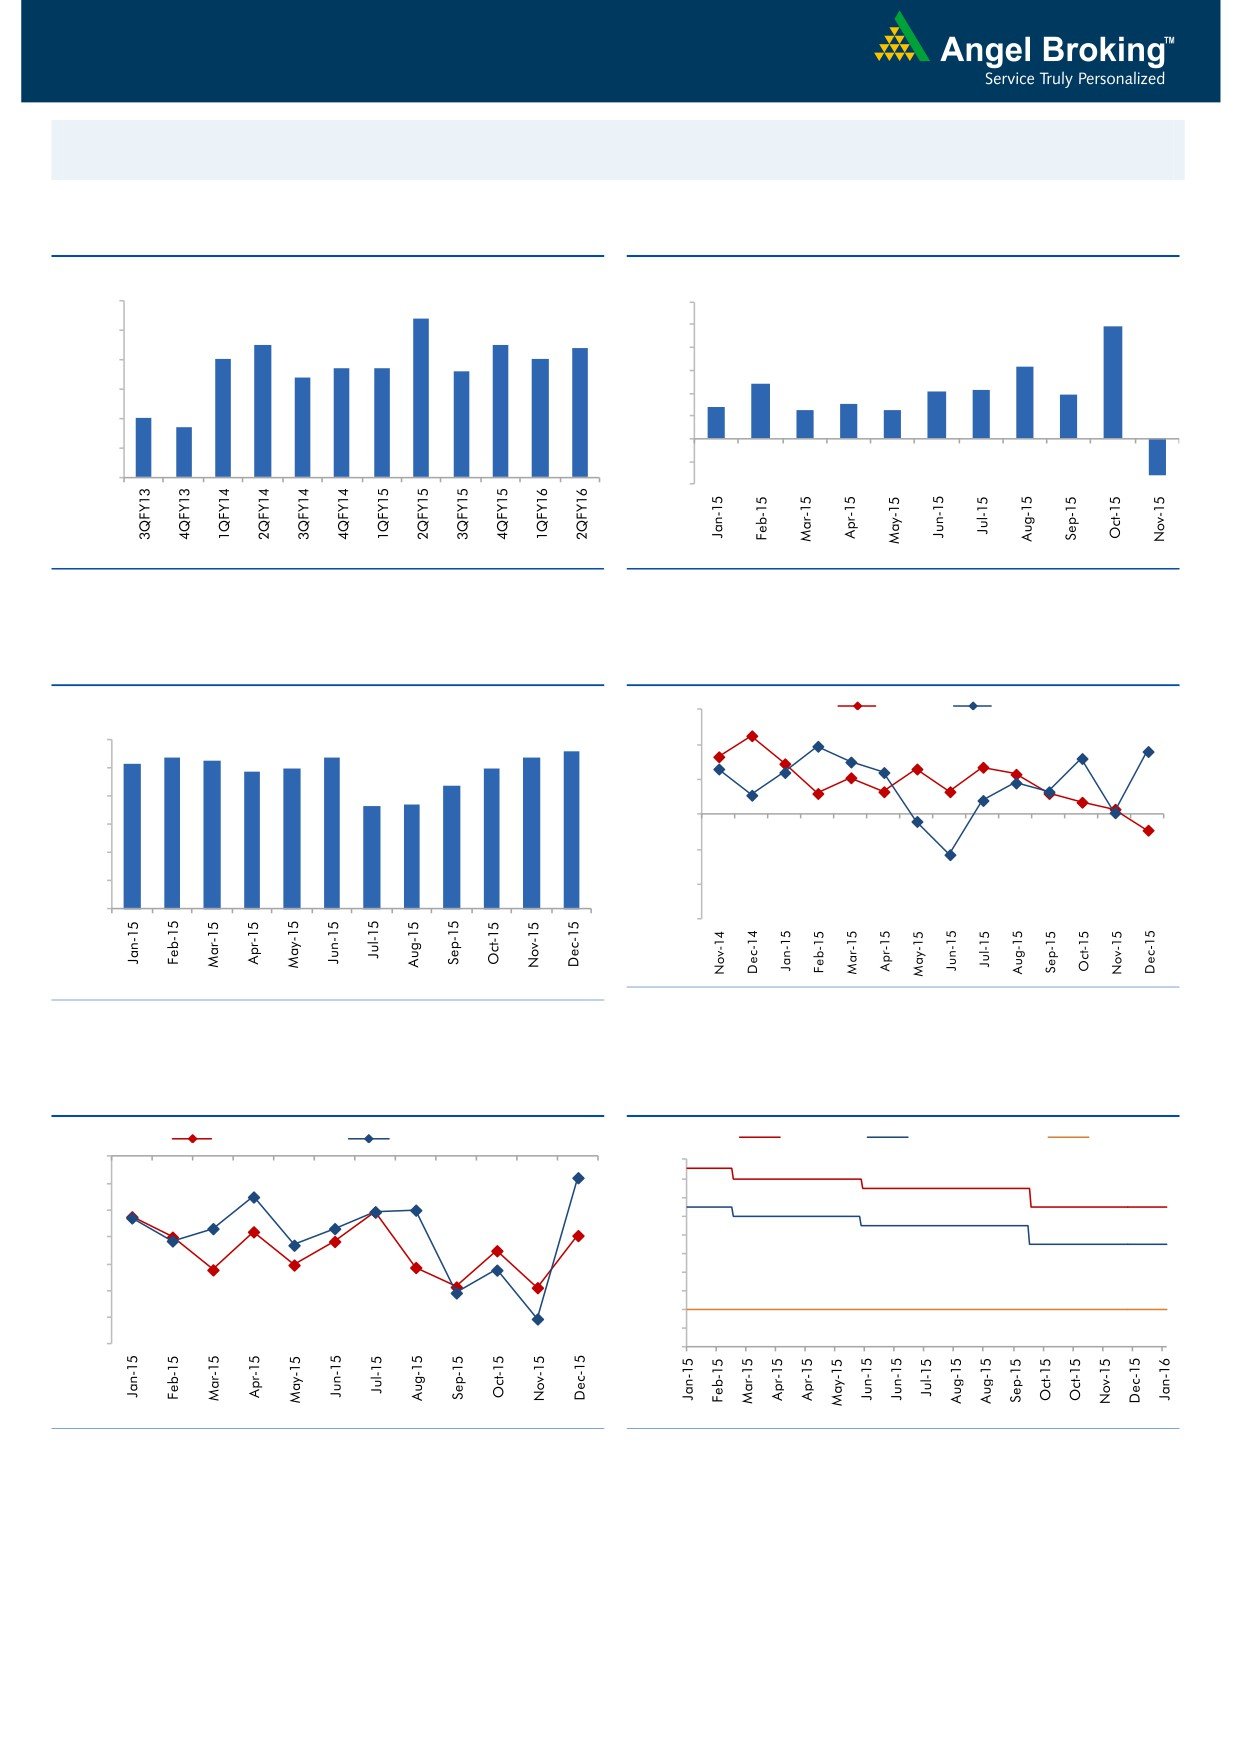
Macro watch
Exhibit 1: Quarterly GDP trends
Exhibit 2: IIP trends
(%)
(%)
9.0
8.4
12.0
9.9
7.5
7.5
10.0
8.0
7.4
7.0
7.0
6.7
6.7
8.0
6.3
6.6
7.0
6.4
6.0
4.8
4.2
4.3
3.8
6.0
2.8
3.0
4.0
2.5
2.5
5.0
4.7
5.0
2.0
-
4.0
(2.0)
3.0
(4.0)
(3.2)
Source: CSO, Angel Research
Source: MOSPI, Angel Research
Exhibit 3: Monthly CPI inflation trends
Exhibit 4: Manufacturing and services PMI
(%)
56.0
Mfg. PMI
Services PMI
5.6
6.0
5.4
5.3
5.4
5.4
54.0
5.2
5.0
5.0
4.9
5.0
4.4
52.0
3.7
3.7
4.0
50.0
3.0
2.0
48.0
1.0
46.0
-
44.0
Source: Market, Angel Research; Note: Level above 50 indicates expansion
Source: MOSPI, Angel Research
Exhibit 5: Exports and imports growth trends
Exhibit 6: Key policy rates
(%)
Exports yoy growth
Imports yoy growth
(%)
Repo rate
Reverse Repo rate
CRR
0.0
8.00
(5.0)
7.50
7.00
(10.0)
6.50
(15.0)
6.00
5.50
(20.0)
5.00
(25.0)
4.50
4.00
(30.0)
3.50
(35.0)
3.00
Source: Bloomberg, Angel Research
Source: RBI, Angel Research
Market Outlook
January 29, 2016
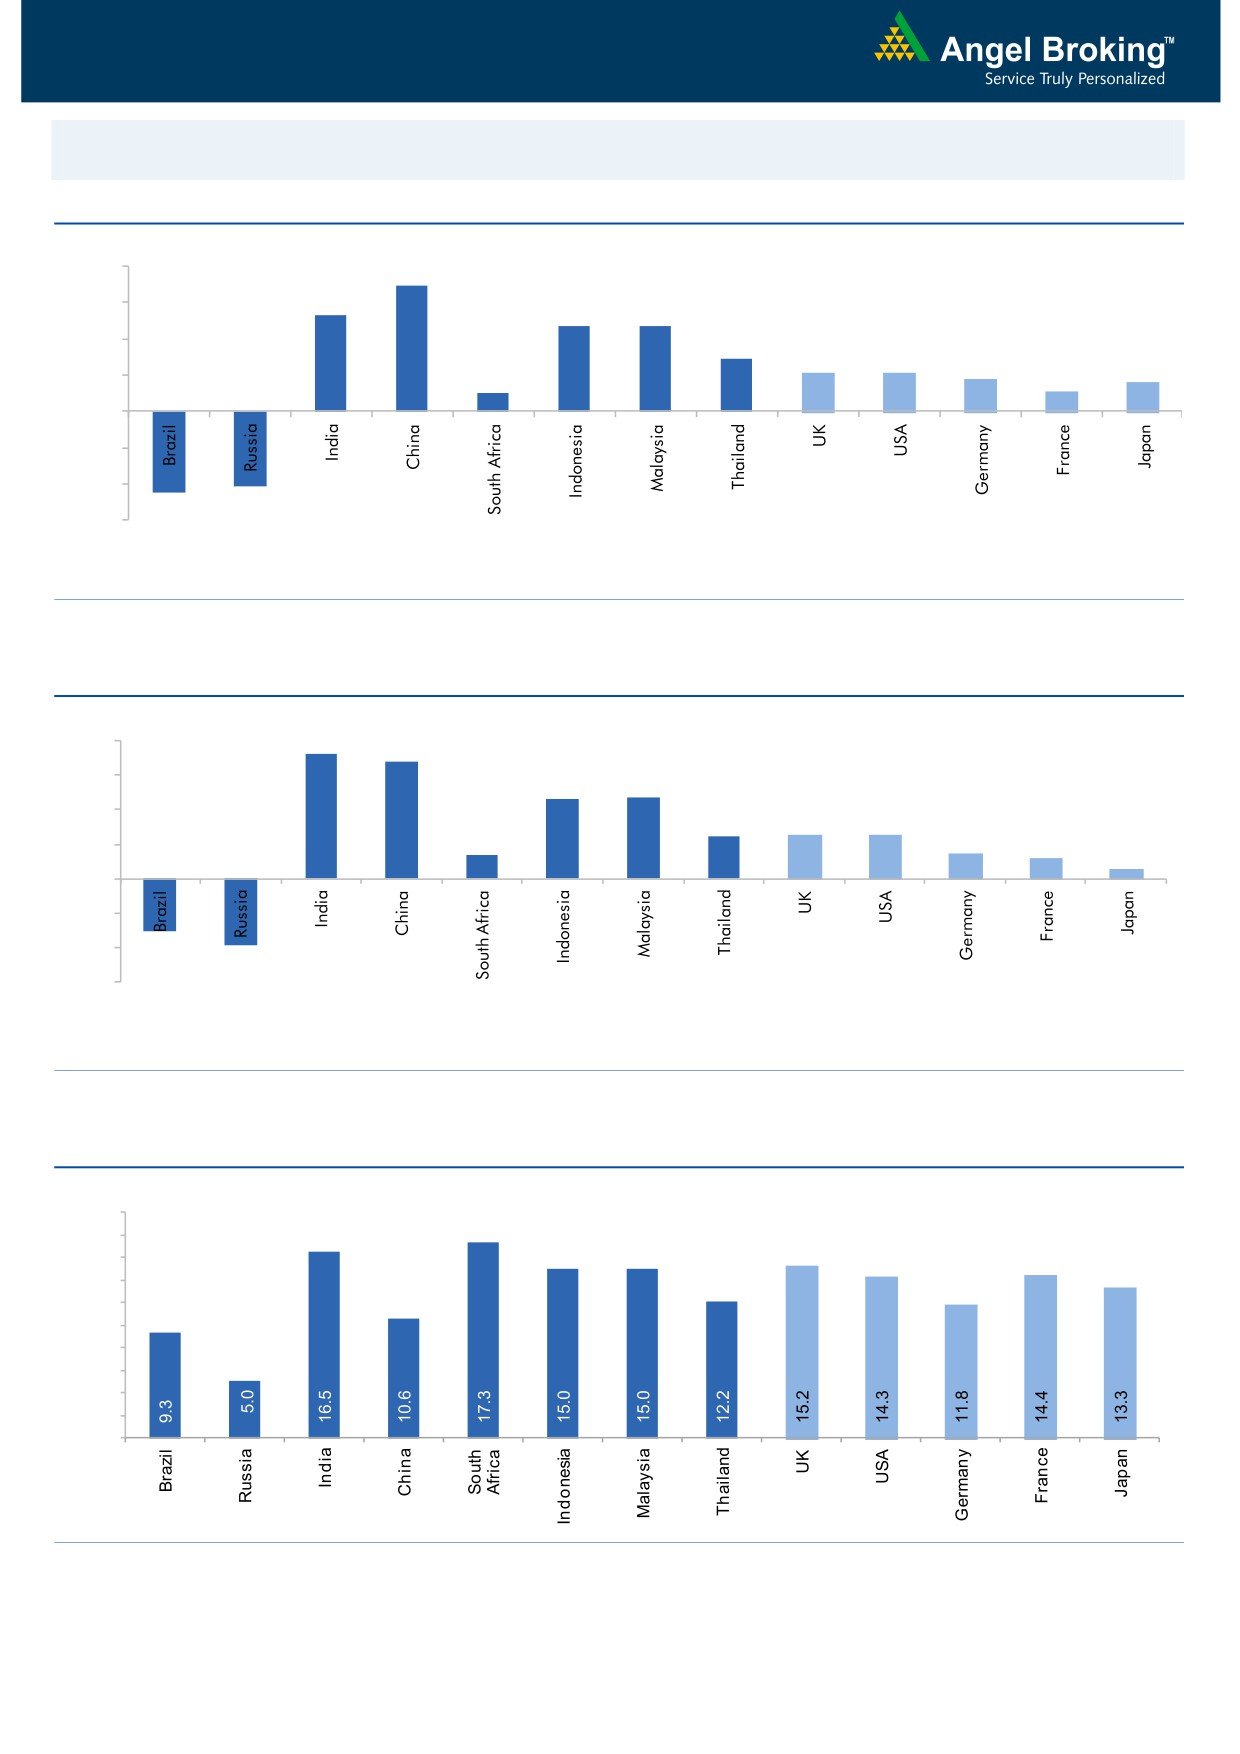
Global watch
Exhibit 1: Latest quarterly GDP Growth (%, yoy) across select developing and developed countries
(%)
8.0
6.9
5.3
6.0
4.7
4.7
4.0
2.9
2.1
2.1
1.8
2.0
1.0
1.1
1.6
-
(2.0)
(4.0)
(4.1)
(4.5)
(6.0)
Source: Bloomberg, Angel Research
Exhibit 2: 2015 GDP Growth projection by IMF (%, yoy) across select developing and developed countries
(%)
7.3
8.0
6.8
6.0
4.7
4.7
4.0
2.5
2.5
2.6
1.4
1.5
2.0
1.2
0.6
-
(2.0)
(4.0)
(3.0)
(3.8)
(6.0)
Source: IMF, Angel Research
Exhibit 3: One year forward P-E ratio across select developing and developed countries
(x)
20.0
18.0
16.0
14.0
12.0
10.0
8.0
6.0
4.0
2.0
-
Source: IMF, Angel Research
Market Outlook
January 29, 2016
Exhibit 4: Relative performance of indices across globe
Returns (%)
Country
Name of index
Closing price
1M
3M
1YR
Brazil
Bovespa
38,630
(16.1)
(19.4)
(21.6)
Russia
Micex
1,772
(6.4)
(5.9)
3.4
India
Nifty
7,425
(5.8)
(11.3)
(13.9)
China
Shanghai Composite
2,656
(19.4)
(12.9)
(9.3)
South Africa
Top 40
43,746
(7.4)
(12.8)
(3.4)
Mexico
Mexbol
42,393
(6.1)
(7.9)
(2.2)
Indonesia
LQ45
795
1.7
(0.1)
(14.4)
Malaysia
KLCI
1,635
(1.7)
(4.5)
(6.6)
Thailand
SET 50
813
(7.3)
(16.0)
(23.8)
USA
Dow Jones
16,070
(11.2)
(8.4)
(10.2)
UK
FTSE
5,932
(5.2)
(6.8)
(12.1)
Japan
Nikkei
17,041
(9.3)
(7.6)
(1.9)
Germany
DAX
9,640
(10.1)
(7.1)
(10.0)
France
CAC
4,322
(11.8)
(11.7)
(10.8)
Source: Bloomberg, Angel Research
Stock Watch
January 29, 2016
Company Name
Reco
CMP
Target
Mkt Cap
Sales ( Čcr )
OPM(%)
EPS (Č)
PER(x)
P/BV(x)
RoE(%)
EV/Sales(x)
(Č)
Price ( Č)
( Č cr )
FY16E FY17E
FY16E
FY17E
FY16E
FY17E
FY16E
FY17E
FY16E
FY17E
FY16E
FY17E
FY16E
FY17E
Agri / Agri Chemical
Rallis
Neutral
164
-
3,191
2,097
2,415
14.4
14.4
9.5
11.0
17.3
14.9
3.4
3.0
21.1
21.3
1.6
1.4
United Phosphorus
Buy
411
510
17,594
13,698
15,752
17.6
17.6
32.1
38.5
12.8
10.7
2.5
2.1
21.4
21.3
1.4
1.1
Auto & Auto Ancillary
Ashok Leyland
Buy
88
111
25,101
17,995
21,544
11.4
11.6
3.4
4.7
25.9
18.8
4.6
4.2
17.7
22.2
1.4
1.1
Bajaj Auto
Buy
2,270
2,728
65,679
23,695
27,298
21.3
20.4
134.6
151.5
16.9
15.0
5.4
4.6
31.8
30.6
2.4
2.0
Bharat Forge
Accumulate
819
943
19,064
7,867
8,881
20.0
20.3
34.4
41.0
23.8
20.0
4.6
3.8
21.1
20.9
2.6
2.2
Eicher Motors
Buy
15,959
19,036
43,335
15,379
16,498
15.6
16.6
473.2
574.8
33.7
27.8
12.5
9.3
36.7
33.2
2.8
2.6
Gabriel India
Buy
86
101
1,235
1,415
1,544
8.7
9.0
4.6
5.4
18.7
15.9
3.4
3.0
18.1
18.9
0.9
0.8
Hero Motocorp
Accumulate
2,449
2,774
48,894
28,561
31,559
14.7
14.7
151.1
163.2
16.2
15.0
6.3
5.4
38.7
35.6
1.6
1.4
Jamna Auto Industries Neutral
143
-
1,144
1,292
1,486
9.3
9.8
6.0
7.5
23.9
19.1
5.0
4.2
20.7
21.8
1.0
0.8
L G Balakrishnan & Bros Neutral
479
-
752
1,254
1,394
11.6
11.8
35.9
41.7
13.4
11.5
1.8
1.6
13.5
13.8
0.7
0.6
Mahindra and Mahindra Buy
1,201
1,449
74,606
39,031
44,440
13.8
13.9
57.9
67.6
20.8
17.8
3.4
3.0
16.1
16.6
1.5
1.3
Maruti
Neutral
4,094
-
123,658
57,865
68,104
16.4
16.7
176.3
225.5
23.2
18.2
4.5
3.8
19.4
21.2
1.9
1.6
Minda Industries
Accumulate
801
867
1,271
2,567
2,965
8.0
8.3
46.1
57.8
17.4
13.9
2.9
2.4
16.7
17.3
0.6
0.5
Motherson Sumi
Buy
257
313
33,968
39,343
45,100
8.8
9.1
10.1
12.5
25.4
20.5
8.1
6.3
35.3
34.4
1.0
0.8
Rane Brake Lining
Buy
388
465
307
454
511
11.5
12.0
25.2
31.0
15.4
12.5
2.3
2.1
14.9
16.6
0.7
0.6
Setco Automotive
Neutral
32
-
434
594
741
12.7
13.7
1.7
3.2
19.1
10.1
2.0
1.7
10.4
16.9
1.2
1.0
Tata Motors
Buy
334
409
96,433
266,022
312,667
12.8
13.1
26.3
38.3
12.7
8.7
1.7
1.4
8.4
12.1
0.5
0.5
TVS Motor
Buy
292
338
13,856
11,569
13,648
7.3
8.7
10.3
16.1
28.3
18.1
7.0
5.5
24.8
30.5
1.2
1.0
Amara Raja Batteries
Buy
819
1,040
13,991
4,892
5,871
17.4
17.6
28.8
37.1
28.4
22.1
6.6
5.3
23.4
24.1
2.8
2.3
Exide Industries
Buy
118
162
10,056
6,950
7,784
14.4
14.8
6.6
7.3
17.9
16.2
2.3
2.1
12.6
12.8
1.2
1.1
Apollo Tyres
Buy
147
171
7,472
12,146
12,689
16.8
16.0
21.2
19.0
6.9
7.7
1.1
1.0
16.5
13.0
0.7
0.7
Ceat
Buy
919
1,119
3,717
6,041
6,597
14.1
13.7
99.5
111.9
9.2
8.2
1.8
1.5
19.6
18.5
0.8
0.7
JK Tyres
Neutral
91
-
2,072
7,446
7,669
15.2
14.0
19.6
18.4
4.7
5.0
1.2
1.0
25.2
19.5
0.7
0.6
Swaraj Engines
Accumulate
844
919
1,048
552
630
14.2
14.7
44.6
54.1
18.9
15.6
4.4
4.0
23.2
25.6
1.8
1.5
Subros
Neutral
96
-
577
1,293
1,527
11.8
11.9
4.2
6.7
22.9
14.4
1.7
1.6
7.7
11.5
0.8
0.6
Indag Rubber
Neutral
180
-
472
283
329
17.0
17.2
13.0
15.4
13.9
11.7
3.0
2.5
21.8
21.6
1.4
1.1
Capital Goods
ACE
Neutral
39
-
390
660
839
4.7
8.2
1.0
3.9
39.4
10.1
1.2
1.1
3.2
11.3
0.7
0.6
BEML
Neutral
1,064
-
4,432
3,277
4,006
6.0
8.9
29.2
64.3
36.5
16.6
2.0
1.9
5.7
11.7
1.5
1.2
Bharat Electronics
Buy
1,228
1,414
29,467
7,737
8,634
16.8
17.2
54.0
61.0
22.7
20.1
3.2
2.9
39.3
45.6
2.9
2.4
Stock Watch
January 29, 2016
Company Name
Reco
CMP
Target
Mkt Cap
Sales ( Čcr )
OPM(%)
EPS (Č)
PER(x)
P/BV(x)
RoE(%)
EV/Sales(x)
(Č)
Price ( Č)
( Č cr )
FY16E
FY17E
FY16E
FY17E
FY16E
FY17E
FY16E
FY17E
FY16E
FY17E
FY16E
FY17E
FY16E
FY17E
Capital Goods
Voltas
Buy
284
353
9,394
5,363
5,963
8.0
9.1
11.0
13.8
25.8
20.6
4.0
3.5
16.2
17.9
1.7
1.5
BGR Energy
Neutral
114
-
820
3,615
3,181
9.5
9.4
16.7
12.4
6.8
9.2
0.6
0.6
10.0
7.0
0.6
0.8
BHEL
Neutral
137
-
33,495
33,722
35,272
10.8
11.7
10.5
14.2
13.0
9.6
1.0
0.9
7.0
9.0
1.1
1.0
Blue Star
Buy
355
439
3,193
3,548
3,977
6.3
6.9
13.7
17.2
25.9
20.7
6.5
4.2
26.1
25.4
1.0
0.9
Crompton Greaves
Buy
168
204
10,517
13,484
14,687
4.9
6.2
4.5
7.1
37.3
23.6
2.6
2.5
7.2
10.8
0.9
0.8
Greaves Cotton
Neutral
128
-
3,128
1,655
1,755
16.6
16.8
7.4
7.8
17.3
16.4
3.5
3.3
21.1
20.6
1.8
1.7
Inox Wind
Buy
318
458
7,047
4,980
5,943
17.0
17.5
26.6
31.6
11.9
10.1
3.6
2.6
35.0
30.0
1.6
1.3
KEC International
Neutral
123
-
3,166
8,791
9,716
6.1
6.8
5.4
8.2
22.8
15.0
2.3
2.1
10.0
14.0
0.6
0.5
Thermax
Neutral
837
-
9,976
6,413
7,525
7.4
8.5
30.5
39.3
27.5
21.3
4.2
3.7
15.0
17.0
1.6
1.3
Cement
ACC
Buy
1,217
1,630
22,844
13,151
14,757
16.4
18.3
63.9
83.4
19.0
14.6
2.5
2.3
13.3
16.1
1.6
1.3
Ambuja Cements
Buy
193
233
29,990
11,564
12,556
19.4
20.7
8.9
10.1
21.7
19.1
2.7
2.6
12.8
13.8
2.2
2.0
HeidelbergCement
Neutral
69
-
1,565
1,772
1,926
13.3
15.4
1.0
3.0
69.1
23.0
1.8
1.6
2.6
7.9
1.5
1.3
India Cements
Buy
90
112
2,760
4,216
4,840
18.0
19.5
4.0
9.9
22.5
9.1
0.9
0.8
4.0
9.5
1.0
0.8
JK Cement
Buy
504
744
3,525
3,661
4,742
10.1
15.8
18.0
61.0
28.0
8.3
2.0
1.8
7.5
22.9
1.4
1.1
J K Lakshmi Cement
Buy
299
430
3,524
2,947
3,616
16.7
19.9
11.5
27.2
26.0
11.0
2.5
2.1
9.8
20.8
1.6
1.3
Mangalam Cements
Neutral
175
-
467
1,053
1,347
10.5
13.3
8.4
26.0
20.8
6.7
0.9
0.8
4.3
12.5
0.8
0.6
Orient Cement
Buy
146
183
3,000
1,854
2,524
21.2
22.2
7.7
11.1
19.0
13.2
2.7
2.4
13.3
15.7
2.4
1.7
Ramco Cements
Neutral
394
-
9,375
4,036
4,545
20.8
21.3
15.1
18.8
26.1
21.0
3.2
2.8
12.9
14.3
2.8
2.4
Shree Cement^
Neutral
10,161
-
35,396
7,150
8,742
26.7
28.6
228.0
345.5
44.6
29.4
6.6
5.5
15.7
20.3
4.6
3.7
UltraTech Cement
Buy
2,744
3,282
75,288
25,021
30,023
19.1
21.6
89.0
132.0
30.8
20.8
3.6
3.1
12.2
15.9
3.1
2.6
Construction
ITNL
Neutral
79
-
2,604
7,360
8,825
34.0
35.9
7.0
9.0
11.3
8.8
0.4
0.4
3.2
3.7
3.7
3.6
KNR Constructions
Buy
494
673
1,388
937
1,470
14.3
14.0
33.5
38.6
14.7
12.8
2.2
1.9
15.4
15.4
1.6
1.0
Larsen & Toubro
Buy
1,077
1,646
100,306
65,065
77,009
11.5
11.7
61.5
65.6
17.5
16.4
1.8
1.6
13.4
14.0
1.8
1.5
Gujarat Pipavav Port
Neutral
154
-
7,457
629
684
51.0
52.2
6.4
5.9
24.1
26.1
3.2
2.9
15.9
12.7
10.9
9.8
MBL Infrastructures
Buy
165
285
686
2,313
2,797
12.2
14.6
19.0
20.0
8.7
8.3
0.9
0.8
11.3
10.6
1.0
0.9
Nagarjuna Const.
Neutral
62
-
3,450
7,892
8,842
8.8
9.1
3.0
5.3
20.7
11.7
1.0
1.0
5.0
8.5
0.7
0.6
PNC Infratech
Accumulate
508
558
2,608
1,873
2,288
13.2
13.5
24.0
32.0
21.2
15.9
2.1
1.8
12.1
12.3
1.5
1.2
Simplex Infra
Neutral
277
-
1,368
5,955
6,829
10.3
10.5
16.0
31.0
17.3
8.9
0.9
0.8
5.3
9.9
0.7
0.6
Power Mech Projects
Neutral
597
-
878
1,539
1,801
12.8
12.7
59.0
72.1
10.1
8.3
1.5
1.3
18.6
16.8
0.6
0.5
Stock Watch
January 29, 2016
Company Name
Reco
CMP
Target
Mkt Cap
Sales ( Čcr )
OPM(%)
EPS (Č)
PER(x)
P/BV(x)
RoE(%)
EV/Sales(x)
(Č)
Price ( Č)
( Č cr )
FY16E
FY17E
FY16E
FY17E
FY16E
FY17E
FY16E
FY17E
FY16E
FY17E
FY16E
FY17E
FY16E
FY17E
Construction
Sadbhav Engineering
Neutral
300
-
5,138
3,481
4,219
10.7
10.8
8.0
12.0
37.4
25.0
3.5
3.1
10.3
13.5
1.8
1.5
NBCC
Accumulate
978
1,089
11,730
7,382
9,506
7.7
8.6
39.8
54.4
24.6
18.0
5.9
4.7
26.7
29.1
1.3
1.0
MEP Infra
Neutral
44
-
714
1,956
1,876
28.1
30.5
1.3
3.0
33.8
14.7
7.1
4.8
21.2
32.8
1.8
1.8
SIPL
Neutral
89
-
3,140
675
1,042
62.4
64.7
-
-
3.3
3.8
-
-
16.2
10.9
Financials
Allahabad Bank
Neutral
54
-
3,222
8,569
9,392
2.8
2.9
16.3
27.5
3.3
2.0
0.3
0.2
7.6
11.9
-
-
Axis Bank
Buy
407
494
96,748
26,473
31,527
3.5
3.6
35.7
43.5
11.4
9.4
1.9
1.7
17.9
18.9
-
-
Bank of Baroda
Neutral
130
-
29,977
18,485
21,025
1.9
2.0
13.5
21.1
9.7
6.2
0.8
0.7
7.3
10.6
-
-
Bank of India
Neutral
99
-
8,038
15,972
17,271
1.9
2.0
15.3
33.4
6.5
3.0
0.3
0.3
3.6
7.6
-
-
Canara Bank
Neutral
192
-
10,406
15,441
16,945
2.0
2.1
46.6
70.4
4.1
2.7
0.4
0.3
8.0
11.2
-
-
Dena Bank
Neutral
36
-
2,329
3,440
3,840
2.1
2.3
7.3
10.0
5.0
3.6
0.4
0.3
6.1
7.9
-
-
Federal Bank
Neutral
46
-
7,978
3,477
3,999
3.0
3.0
5.0
6.2
9.3
7.4
0.9
0.9
10.6
11.9
-
-
HDFC
Neutral
1,148
-
181,269
10,358
11,852
3.3
3.3
41.1
47.0
28.0
24.4
5.3
4.8
24.7
24.9
-
-
HDFC Bank
Buy
1,033
1,262
260,715
38,309
47,302
4.3
4.3
49.3
61.1
20.9
16.9
3.6
3.1
18.5
19.7
-
-
ICICI Bank
Accumulate
233
254
135,398
34,279
39,262
3.3
3.3
21.0
24.4
11.1
9.6
1.9
1.6
14.4
14.7
-
-
IDBI Bank
Neutral
60
-
11,391
9,625
10,455
1.8
1.8
8.5
14.2
7.0
4.2
0.4
0.4
5.9
9.3
-
-
Indian Bank
Neutral
91
-
4,347
6,160
6,858
2.5
2.5
24.5
29.8
3.7
3.0
0.3
0.3
7.7
8.6
-
-
LIC Housing Finance
Buy
474
592
23,921
3,101
3,745
2.5
2.5
33.0
40.2
14.4
11.8
2.7
2.3
19.7
20.5
-
-
Oriental Bank
Neutral
112
-
3,370
7,643
8,373
2.4
2.4
37.2
45.4
3.0
2.5
0.3
0.2
8.2
9.4
-
-
Punjab Natl.Bank
Neutral
91
-
17,947
23,638
26,557
2.8
2.8
17.9
27.2
5.1
3.4
0.5
0.4
8.5
12.0
-
-
South Ind.Bank
Neutral
18
-
2,491
1,965
2,185
2.5
2.5
2.5
3.3
7.4
5.6
0.7
0.7
9.5
11.7
-
-
St Bk of India
Accumulate
185
202
143,883
82,520
93,299
2.7
2.8
20.0
24.5
9.3
7.6
1.0
0.9
11.5
12.8
-
-
Union Bank
Neutral
125
-
8,624
12,646
14,129
2.3
2.4
31.0
39.1
4.1
3.2
0.4
0.4
9.8
11.4
-
-
Vijaya Bank
Neutral
31
-
2,693
3,536
3,827
1.9
1.9
5.5
6.7
5.7
4.7
0.5
0.4
7.8
8.8
-
-
Yes Bank
Accumulate
674
767
28,270
7,190
9,011
3.2
3.3
58.2
69.7
11.6
9.7
2.1
1.8
19.2
19.6
-
-
FMCG
Asian Paints
Neutral
860
-
82,457
16,553
19,160
16.0
16.2
17.7
21.5
48.6
40.0
12.9
11.6
29.4
31.2
4.8
4.2
Britannia
Neutral
2,674
-
32,076
8,065
9,395
9.6
10.2
47.2
65.5
56.6
40.8
18.8
17.8
38.3
41.2
3.8
3.3
Colgate
Neutral
851
-
23,154
4,836
5,490
19.5
19.7
48.5
53.2
17.6
16.0
12.9
11.2
99.8
97.5
4.7
4.1
Dabur India
Accumulate
243
267
42,782
9,370
10,265
17.1
17.2
7.3
8.1
33.2
30.0
10.0
8.1
33.7
30.6
4.4
4.0
GlaxoSmith Con*
Accumulate
5,800
6,118
24,392
4,919
5,742
17.2
17.4
168.3
191.2
34.5
30.3
9.8
8.3
28.8
28.9
4.4
3.7
Stock Watch
January 29, 2016
Company Name
Reco
CMP
Target
Mkt Cap
Sales ( Čcr )
OPM(%)
EPS (Č)
PER(x)
P/BV(x)
RoE(%)
EV/Sales(x)
(Č)
Price ( Č)
( Č cr )
FY16E FY17E
FY16E
FY17E
FY16E
FY17E
FY16E
FY17E
FY16E
FY17E
FY16E
FY17E
FY16E
FY17E
FMCG
Godrej Consumer
Neutral
1,174
-
39,989
10,168
12,886
16.1
16.1
32.1
38.4
36.6
30.6
7.4
6.9
19.7
21.0
3.9
3.1
HUL
Accumulate
791
815
171,141
34,940
38,957
17.5
17.7
20.8
24.7
38.0
32.0
42.3
33.8
110.5
114.2
4.6
4.1
ITC
Buy
319
382
256,049
41,068
45,068
37.8
37.4
13.9
15.9
22.9
20.0
7.7
6.8
34.1
33.8
5.7
5.2
Marico
Neutral
213
-
27,448
6,551
7,766
15.7
16.0
10.4
12.5
20.5
17.0
6.0
5.0
33.2
32.4
4.1
3.5
Nestle*
Buy
5,474
6,646
52,779
11,291
12,847
22.2
22.3
158.9
184.6
34.4
29.7
18.0
16.2
55.0
57.3
4.5
3.9
Tata Global
Buy
123
144
7,772
8,635
9,072
9.8
9.9
6.5
7.6
19.0
16.2
1.9
1.8
6.8
7.4
0.9
0.8
IT
HCL Tech^
Buy
844
1,038
118,996
42,038
47,503
21.2
21.5
51.5
57.7
16.4
14.6
3.6
2.7
21.5
18.8
2.4
1.9
Infosys
Buy
1,131
1,347
259,865
61,850
69,981
27.5
27.5
59.4
65.7
19.1
17.2
4.0
3.5
21.2
20.1
3.5
3.0
TCS
Buy
2,331
2,854
459,287
108,487
122,590
28.3
28.5
122.8
138.4
19.0
16.8
7.2
6.6
38.0
38.9
3.8
3.3
Tech Mahindra
Buy
500
646
48,381
25,566
28,890
16.0
17.0
26.3
31.9
19.0
15.7
3.4
2.9
17.9
18.6
1.7
1.4
Wipro
Buy
547
719
135,173
50,808
58,713
23.7
23.8
37.3
42.3
14.7
12.9
2.8
2.5
19.0
17.9
2.3
1.8
Media
D B Corp
Accumulate
312
356
5,725
2,241
2,495
27.8
27.9
21.8
25.6
14.3
12.2
3.7
3.3
26.7
28.5
2.5
2.3
HT Media
Neutral
79
-
1,827
2,495
2,603
11.2
11.2
7.3
8.6
10.8
9.1
0.9
0.8
7.4
8.1
0.2
0.2
Jagran Prakashan
Accumulate
163
189
5,317
2,170
2,355
27.2
26.2
8.9
9.9
18.3
16.4
3.8
3.4
20.9
20.5
2.4
2.2
Sun TV Network
Neutral
354
-
13,955
2,779
3,196
70.2
70.5
22.8
27.3
15.5
13.0
3.8
3.5
26.7
28.3
4.8
4.1
Hindustan Media
Neutral
278
-
2,039
920
1,031
20.0
20.0
19.2
20.9
14.5
13.3
2.4
2.0
16.4
15.3
1.8
1.6
Ventures
Metals & Mining
Coal India
Buy
306
380
193,028
76,167
84,130
19.9
22.3
22.4
25.8
13.6
11.8
4.9
4.8
35.5
41.0
1.9
1.7
Hind. Zinc
Accumulate
165
175
69,633
14,641
14,026
50.4
50.4
17.7
16.0
9.3
10.3
1.4
1.3
16.2
13.2
2.2
2.0
Hindalco
Neutral
70
-
14,403
104,356
111,186
8.7
9.5
6.7
11.1
10.4
6.3
0.4
0.4
3.5
5.9
0.7
0.6
JSW Steel
Neutral
1,093
-
26,424
42,308
45,147
16.4
20.7
(10.3)
49.5
22.1
1.2
1.2
(1.0)
5.6
1.7
1.6
NMDC
Neutral
79
-
31,143
8,237
10,893
46.6
44.5
10.0
11.7
7.9
6.7
0.9
0.8
12.5
13.0
3.7
2.8
SAIL
Neutral
43
-
17,697
45,915
53,954
7.2
10.5
1.5
4.4
28.5
9.8
0.4
0.4
2.3
4.1
1.0
0.9
Vedanta
Neutral
67
-
19,952
71,445
81,910
26.2
26.3
12.9
19.2
5.2
3.5
0.4
0.3
7.2
8.9
0.7
0.5
Tata Steel
Neutral
254
-
24,708
126,760
137,307
8.9
11.3
6.4
23.1
40.0
11.0
0.8
0.8
2.0
7.1
0.8
0.7
Oil & Gas
Cairn India
Neutral
124
-
23,201
11,323
12,490
49.4
51.0
20.7
20.7
6.0
6.0
0.4
0.4
6.4
6.1
1.0
0.4
GAIL
Neutral
361
-
45,798
64,856
70,933
9.1
9.6
24.0
28.9
15.1
12.5
1.3
1.2
8.8
9.6
0.9
0.8
ONGC
Neutral
220
-
188,050
154,564
167,321
36.8
37.4
28.6
32.5
7.7
6.8
1.0
0.9
12.7
13.5
1.4
1.3
Petronet LNG
Neutral
243
-
18,259
29,691
31,188
5.8
6.2
12.8
13.4
19.0
18.1
2.8
2.5
15.8
14.8
0.7
0.7
Indian Oil Corp
Accumulate
399
455
96,766
359,607
402,760
5.9
6.1
42.5
48.7
9.4
8.2
1.3
1.1
14.1
14.4
0.4
0.3
Stock Watch
January 29, 2016
Company Name
Reco
CMP
Target
Mkt Cap
Sales ( Čcr )
OPM(%)
EPS (Č)
PER(x)
P/BV(x)
RoE(%)
EV/Sales(x)
(Č)
Price ( Č)
( Č cr )
FY16E FY17E
FY16E
FY17E
FY16E
FY17E
FY16E
FY17E
FY16E
FY17E
FY16E
FY17E
FY16E
FY17E
Oil & Gas
Reliance Industries
Buy
1,017
1,150
329,415
304,775
344,392
12.6
13.4
91.3
102.6
11.1
9.9
1.3
1.1
11.8
12.0
1.0
0.8
Pharmaceuticals
Alembic Pharma
Neutral
593
-
11,172
2,658
3,112
24.1
20.2
24.6
23.9
24.1
24.8
8.6
6.6
42.5
30.2
4.3
3.6
Aurobindo Pharma
Accumulate
810
856
47,298
14,923
17,162
22.0
23.0
35.7
42.8
22.7
18.9
6.7
5.0
34.0
30.2
3.5
3.0
Aventis*
Neutral
4,183
-
9,634
2,082
2,371
17.4
20.8
118.2
151.5
35.4
27.6
5.2
4.2
19.9
25.5
4.3
3.6
Cadila Healthcare
Buy
299
352
30,646
10,224
11,840
21.0
22.0
14.6
17.6
20.5
17.0
5.6
4.4
30.8
29.0
3.1
2.6
Cipla
Accumulate
578
636
46,427
14,211
16,611
20.6
19.0
27.0
28.9
21.4
20.0
3.6
3.1
18.4
16.8
3.3
2.7
Dr Reddy's
Buy
3,007
3,933
51,282
16,838
19,575
25.0
23.1
167.5
178.8
18.0
16.8
3.8
3.2
23.1
20.4
2.9
2.5
Dishman Pharma
Neutral
331
-
2,669
1,733
1,906
21.5
21.5
17.0
19.9
19.5
16.6
2.0
1.8
10.5
11.2
2.0
1.8
GSK Pharma*
Neutral
3,218
-
27,261
2,870
3,158
20.0
22.1
59.5
68.3
54.1
47.1
16.0
16.4
28.5
34.3
9.0
8.2
Indoco Remedies
Neutral
316
-
2,911
1,033
1,199
15.9
18.2
9.4
13.6
33.6
23.2
5.0
4.2
15.7
19.7
2.9
2.5
Ipca labs
Buy
646
900
8,154
3,363
3,909
12.9
18.6
13.4
28.0
48.2
23.1
3.5
3.0
7.4
14.0
2.7
2.3
Lupin
Neutral
1,707
-
76,902
13,092
16,561
25.0
27.0
50.4
68.3
33.9
25.0
7.0
5.5
22.8
24.7
5.5
4.3
Sun Pharma
Buy
835
950
200,855
28,163
32,610
25.8
30.7
17.4
26.9
48.0
31.0
4.6
3.9
13.0
16.6
6.5
5.4
Power
Tata Power
Neutral
60
-
16,228
35,923
37,402
22.6
22.8
4.1
5.2
14.8
11.7
1.1
1.1
7.5
9.3
1.4
1.3
NTPC
Accumulate
144
157
118,817
87,064
98,846
23.5
23.5
11.7
13.2
12.3
10.9
1.4
1.3
11.4
12.1
2.4
2.1
Power Grid
Buy
144
170
75,204
20,702
23,361
86.7
86.4
12.1
13.2
11.9
10.9
1.8
1.6
15.6
15.1
8.4
7.8
Telecom
Bharti Airtel
Neutral
291
-
116,444
101,748
109,191
32.1
31.7
12.0
12.5
24.3
23.3
1.7
1.6
6.9
6.7
1.8
1.6
Idea Cellular
Neutral
105
-
37,714
34,282
36,941
32.0
31.5
5.9
6.2
17.8
16.9
1.6
1.5
9.9
9.3
1.7
1.6
zOthers
Abbott India
Neutral
5,059
-
10,750
2,715
3,153
14.5
14.1
134.3
152.2
37.7
33.2
9.4
7.8
27.4
25.6
3.6
3.1
Bajaj Electricals
Buy
182
290
1,835
4,719
5,287
5.2
5.8
8.6
12.7
21.2
14.4
2.4
2.1
11.4
14.8
0.4
0.4
Finolex Cables
Neutral
225
-
3,446
2,520
2,883
12.2
12.0
12.7
14.2
17.8
15.9
2.4
2.2
13.6
13.5
1.2
1.0
Goodyear India*
Buy
493
622
1,137
1,888
1,680
12.1
11.9
62.2
56.6
7.9
8.7
1.9
1.6
25.9
19.7
0.4
0.4
Hitachi
Neutral
1,144
-
3,112
1,779
2,081
7.8
8.8
21.8
33.4
52.5
34.2
8.5
6.9
17.4
22.1
1.8
1.5
Jyothy Laboratories
Neutral
283
-
5,123
1,620
1,847
11.5
11.5
7.3
8.5
38.8
33.4
5.0
4.7
13.3
14.4
3.1
2.6
MRF
Buy
35,712
45,575
15,146
20,316
14,488
21.4
21.1
5,488.0
3,798.0
6.5
9.4
2.2
1.8
41.1
21.2
0.7
0.9
Page Industries
Neutral
11,999
-
13,384
1,929
2,450
19.8
20.1
229.9
299.0
52.2
40.1
23.0
16.0
52.1
47.1
7.1
5.6
Relaxo Footwears
Neutral
469
-
5,626
1,767
2,152
12.3
12.5
19.3
25.1
24.4
18.7
6.0
4.6
27.7
27.8
3.2
2.6
Siyaram Silk Mills
Buy
1,072
1,354
1,004
1,636
1,815
11.5
11.5
89.9
104.1
11.9
10.3
2.0
1.7
17.9
17.8
0.8
0.7
Styrolution ABS India*
Neutral
672
-
1,182
1,271
1,440
8.6
9.2
32.0
41.1
21.0
16.4
2.1
1.9
10.7
12.4
0.9
0.8
Stock Watch
January 29, 2016
Company Name
Reco
CMP
Target
Mkt Cap
Sales ( Čcr )
OPM(%)
EPS (Č)
PER(x)
P/BV(x)
RoE(%)
EV/Sales(x)
(Č)
Price ( Č)
( Č cr )
FY16E
FY17E
FY16E
FY17E
FY16E
FY17E
FY16E
FY17E
FY16E
FY17E
FY16E
FY17E
FY16E
FY17E
zOthers
TVS Srichakra
Buy
2,563
3,240
1,962
2,101
2,338
15.7
15.0
248.6
270.0
10.3
9.5
4.5
3.2
43.6
34.0
1.0
0.8
HSIL
Accumulate
273
302
1,970
2,123
2,384
16.1
16.5
15.0
18.9
18.1
14.4
1.4
1.3
8.0
9.4
1.3
1.1
Kirloskar Engines India
Neutral
240
-
3,469
2,471
2,826
8.8
10.4
9.1
13.3
26.3
18.0
2.5
2.3
9.7
13.4
1.1
0.9
Ltd
M M Forgings
Buy
467
614
564
511
615
21.7
21.6
43.1
55.8
10.8
8.4
2.0
1.6
19.9
21.2
1.3
1.0
Banco Products (India) Neutral
126
-
898
1,208
1,353
11.0
12.3
10.8
14.5
11.7
8.7
1.3
1.2
11.9
14.5
0.7
0.6
Competent Automobiles Neutral
145
-
89
1,040
1,137
3.2
3.1
25.7
28.0
5.6
5.2
0.8
0.7
15.0
14.3
0.1
0.1
Nilkamal
Neutral
1,331
-
1,987
1,910
2,083
10.5
10.3
63.3
69.2
21.0
19.2
3.4
2.9
17.6
16.5
1.1
0.9
Visaka Industries
Buy
108
144
171
1,086
1,197
9.9
10.3
21.5
28.8
5.0
3.7
0.5
0.4
9.6
11.6
0.4
0.3
Transport Corporation of
Neutral
230
-
1,753
2,830
3,350
8.8
9.0
14.4
18.3
16.0
12.6
2.5
2.2
15.4
17.1
0.8
0.7
India
Elecon Engineering
Buy
64
85
698
1,369
1,533
13.7
14.9
3.3
6.1
19.3
10.6
1.3
1.2
6.6
11.4
0.9
0.8
Surya Roshni
Buy
147
201
643
2,992
3,223
8.1
8.4
14.7
18.3
10.0
8.0
0.9
0.8
9.7
11.0
0.5
0.5
MT Educare
Neutral
164
-
653
286
366
18.3
17.7
7.7
9.4
21.2
17.5
4.5
3.9
20.2
21.1
2.2
1.6
Radico Khaitan
Buy
112
156
1,485
1,565
1,687
12.2
13.0
5.7
7.1
19.6
15.7
1.7
1.5
8.3
9.6
1.4
1.3
Garware Wall Ropes
Buy
344
473
753
862
974
11.2
11.2
24.9
29.6
13.8
11.6
2.1
1.8
15.1
15.4
0.9
0.7
Wonderla Holidays
Neutral
396
-
2,235
206
308
44.0
43.6
9.0
12.9
44.0
30.7
6.0
5.4
13.7
17.8
11.0
7.3
Linc Pen & Plastics
Neutral
210
-
311
340
371
8.3
8.9
10.8
13.2
19.5
15.9
3.1
2.7
16.0
17.1
1.0
0.9
The Byke Hospitality
Neutral
157
-
628
222
287
20.5
20.5
5.6
7.6
27.8
20.7
5.2
4.3
18.9
20.8
2.9
2.2
Interglobe Aviation
Neutral
903
-
32,553
17,022
21,122
20.7
14.5
63.9
53.7
14.1
16.8
21.2
17.4
149.9
103.2
2.0
1.6
Coffee Day Enterprises
Neutral
253
-
5,208
2,692
2,964
17.0
18.6
-
4.7
-
53.4
3.1
2.9
0.2
5.5
2.3
2.1
Ltd
Navneet Education
Neutral
89
-
2,124
998
1,062
24.1
24.0
5.8
6.1
15.5
14.6
3.4
3.0
22.0
20.6
2.2
2.1
Navkar Corporation
Buy
195
265
2,786
365
436
38.3
37.5
5.6
5.9
34.7
33.2
2.2
2.0
6.3
6.1
8.4
7.2
Source: Company, Angel Research; Note: *December year end; #September year end; &October year end; Price as on January 28, 2016
Market Outlook
January 29, 2016
Research Team Tel: 022 - 39357800
DISCLAIMER
Angel Broking Private Limited (hereinafter referred to as “Angel”) is a registered Member of National Stock Exchange of India Limited,
Bombay Stock Exchange Limited and Metropolitian Stock Exchange of India Limited. It is also registered as a Depository Participant with
CDSL and Portfolio Manager with SEBI. It also has registration with AMFI as a Mutual Fund Distributor. Angel Broking Private Limited is a
registered entity with SEBI for Research Analyst in terms of SEBI (Research Analyst) Regulations, 2014 vide registration number
INH000000164. Angel or its associates has not been debarred/ suspended by SEBI or any other regulatory authority for accessing
/dealing in securities Market. Angel or its associates including its relatives/analyst do not hold any financial interest/beneficial ownership
of more than 1% in the company covered by Analyst. Angel or its associates/analyst has not received any compensation / managed or co
-managed public offering of securities of the company covered by Analyst during the past twelve months. Angel/analyst has not served as
an officer, director or employee of company covered by Analyst and has not been engaged in market making activity of the company
covered by Analyst.
This document is solely for the personal information of the recipient, and must not be singularly used as the basis of any investment
decision. Nothing in this document should be construed as investment or financial advice. Each recipient of this document should make
such investigations as they deem necessary to arrive at an independent evaluation of an investment in the securities of the companies
referred to in this document (including the merits and risks involved), and should consult their own advisors to determine the merits and
risks of such an investment.
Reports based on technical and derivative analysis center on studying charts of a stock's price movement, outstanding positions and
trading volume, as opposed to focusing on a company's fundamentals and, as such, may not match with a report on a company's
fundamentals.
The information in this document has been printed on the basis of publicly available information, internal data and other reliable sources
believed to be true, but we do not represent that it is accurate or complete and it should not be relied on as such, as this document is for
general guidance only. Angel Broking Pvt. Limited or any of its affiliates/ group companies shall not be in any way responsible for any
loss or damage that may arise to any person from any inadvertent error in the information contained in this report. Angel Broking Pvt.
Limited has not independently verified all the information contained within this document. Accordingly, we cannot testify, nor make any
representation or warranty, express or implied, to the accuracy, contents or data contained within this document. While Angel Broking
Pvt. Limited endeavors to update on a reasonable basis the information discussed in this material, there may be regulatory, compliance,
or other reasons that prevent us from doing so.
This document is being supplied to you solely for your information, and its contents, information or data may not be reproduced,
redistributed or passed on, directly or indirectly.
Neither Angel Broking Pvt. Limited, nor its directors, employees or affiliates shall be liable for any loss or damage that may arise from or
in connection with the use of this information.
Note: Please refer to the important ‘Stock Holding Disclosure' report on the Angel website (Research Section). Also, please refer to the
latest update on respective stocks for the disclosure status in respect of those stocks. Angel Broking Pvt. Limited and its affiliates may have
investment positions in the stocks recommended in this report.