Market Outlook
December 28, 2015
Market Cues
Domestic Indices
Chg (%)
(Pts)
(Close)
Indian markets are expected to open flat to negative tracking the SGX Nifty and its
BSE Sensex
(0.0)
(12)
25,839
Asian peers.
Nifty
(0.1)
(5)
7,861
Wall street was led by a choppy trading session as many traders looked to get a
Mid Cap
0.3
31
11,018
head start on the upcoming three-day weekend, as the markets closed earlier than
Small Cap
0.5
57
11,731
usual. However, the major averages eventually ended the session mixed. While the
Bankex
(0.4)
(80)
19,207
Nasdaq inched up 0.1% to 5,048, the Dow 0.3% to 17,552 and the S&P 500
dipped 0.2% to 2,061.
Global Indices
Chg (%)
(Pts)
(Close)
The European markets were mixed in thin trade on the day prior to Christmas, with
many of them, including the U.K., France and the Netherlands, open only for half
Dow Jones
(0.3)
(50)
17,552
the trading session. On a light day for economic news, the British Bankers'
Nasdaq
0.1
3
5,049
Association said UK house purchase approvals unexpectedly declined in November,
FTSE
0.2
14
6,255
after a rebound in the previous month. The Euro Stoxx 50 index of eurozone
Nikkei
(0.1)
(21)
18,769
bluechip stocks fell 0.2%, while the Stoxx Europe 50 index, which includes some
Hang Seng
0.4
98
22,138
major U.K. companies, slid 0.3%.
Shanghai Com
0.4
15
3,628
Indian shares ended Thursday's lackluster session slightly lower ahead of Christmas
holiday weekend. The decline was attributed to profit taking and a lack of political
Advances / Declines
BSE
NSE
consensus to push through key legislations, especially the GST and Real Estate Bills.
Commodity-related stocks witnessed broad-based buying, with Hindalco, Cairn
Advances
1,562
862
India and Vedanta climbing 2-3%.
Declines
1,117
649
Unchanged
233
76
News & Result Analysis
Future Consumer Enterprise to raise `368cr from PE, promoters
Volumes (` Cr)
GAIL to buy 5% stake in consortium building TAPI pipeline
Detailed analysis on Pg2
BSE
2,733
NSE
13,391
Investor’s Ready Reckoner
Key Domestic & Global Indicators
Net Inflows (` Cr)
Net
Mtd
Ytd
Stock Watch: Latest investment recommendations on 150+ stocks
FII
614
(2,031)
10,819
Refer P4 onwards
MFs
38
2,520
68,975
Top Picks
CMP
Target
Upside
Company
Sector
Rating
Top Gainers
Price (`)
Chg (%)
(`)
(`)
(%)
Axis Bank
Financials
Buy
451
630
39.7
Pipavavdoc
100
20.0
HCL Tech
IT
Buy
860
1,132
31.6
Relinfra
493
7.7
ICICI Bank
Financials
Buy
258
354
37.3
Punjlloyd
28
6.3
Ashok Leyland
Automobiles
Buy
88
111
26.2
Bfutilitie
669
5.6
Larsen & Toubro
Construction
Buy
1,295
1,646
27.2
Biocon
508
5.4
More Top Picks on Pg3
Top Losers
Price (`)
Chg (%)
Key Upcoming Events
Previous
Consensus
Pmcfin
1
(9.8)
Date
Region
Event Description
Reading
Expectations
Neyvelilig
80
(2.5)
Dec 29
USA
Initial Jobless claims - Dec19 (in thousands)
271
270
Jetairways
609
(2.4)
Jan 8
India
Imports YoY% - Dec (% change)
(30.26)
-
Kailash
2
(2.3)
Jan 8
India
Exports YoY% - Dec (% change)
(24.43)
-
Sci
97
(2.1)
Jan 8
USA
Change in Nonfarm payrolls -Dec (in thousands)
211
200
As on December 24, 2015
Market Outlook
December 28, 2015
Future Consumer Enterprise to raise `368cr from PE, promoters
Future Group's food firm Future Consumer Enterprise said it plans to raise around
`368cr from promoters and PE fund Black River Food 2 Pte Ltd to finance its
various expansion plans and business initiatives.
The food company will issue compulsorily convertible debentures (CCDs) of face
value `100,000 per CCD to Black River Food 2 Pte Ltd, a wholly-owned subsidiary
of Food Fund. The Future Group company will raise $10mn through an issue of
warrants to its promoters.
The primary purpose of the fund-raising is to finance various expansion plans and
business initiatives of Future Consumer Enterprise (FCEL) and improvement of costs
and maturity profile of existing debt.
GAIL to buy 5% stake in consortium building TAPI pipeline
State-owned GAIL India Ltd will take 5% stake in the international consortium
building the
$8.7 billion Turkmenistan-Afghanistan-Pakistan-India (TAPI) gas
pipeline.
The four nations building the pipeline had in August agreed to co-own the project
and a joint venture company with participation of each country is to be set up to
build and operate the 1,814-kilometre line.
The TAPI pipeline will have a capacity to carry 90 million standard cubic metres a
day (mmscmd) gas for 30 years and is planned to become operational in 2018.
India and Pakistan were originally to get 38 mmscmd each while the remaining 14
mmscmd was to be supplied to Afghanistan. We maintain our Neutral view on the
stock.
Economic and Political News
Petroleum products to be out of GST for now: CEA
India did well in year of global economic turmoil: Jaitley
FIPB to consider 9 FDI proposals this week
Corporate News
Nestle eyes double digit growth for Maggi noodles
GMR Infra to restructure holdings in GMR Airports
IOC, OIL sign pact with Russian oil firm Rosneft
Reliance Jio Infocomm launches 4G services for employees
Market Outlook
December 28, 2015
Top Picks
Large Cap
M
arket Cap
CM
P
T
arget
Upsid
e
Company
Rationale
(` Cr)
(`)
(`)
(%)
To outpace battery industry growth due to better technological
Amara Raja Batteries
14,740
863
1,040
20.5
products leading to market share gains in both the automotive
OEM and replacement segments.
Earnings to grow strongly given the MHCV cyclical upturn.
Ashok Leyland
25,029
88
111
26.2
Focus on exports and LCV's provides additional growth
avenue.
Healthy pace of branch expansion, backed by distribution
Axis Bank
1,07,211
451
630
39.7
network, will be the driving force for the bank’s retail business
and overall earnings.
The stock is trading at attractive valuations and is factoring all
HCL Tech
1,21,191
860
1,132
31.6
the bad news.
Strong visibility for a robust 20% earnings trajectory, coupled
HDFC Bank
2,70,982
1,074
1,262
17.5
with high quality of earnings on account of high quality retail
business and strategic focus on highly rated corporates.
Due to its robust franchise and capital adequacy position, the
bank is well positioned to grow by at least a few percentage
ICICI Bank
1,49,834
258
354
37.3
points higher than the average industry growth rate from a
structural point of view.
Back on the growth trend, expect a long term growth of 14%
Infosys
2,51,711
1,096
1,306
19.2
to be a US$20bn in FY2020.
Well positioned to benefit from such expected gradual
recovery in the overall domestic capex cycle, given its presence
Larsen & Toubro
1,20,546
1,295
1,646
27.2
across various infrastructure segments, its execution
capabilities, and its strong balance sheet.
LICHF continues to grow its retail loan book at a healthy pace
with improvement in asset quality. We expect the company to
LIC Housing Finance
24,491
485
571
17.6
post a healthy loan book which is likely to reflect in a strong
earnings growth.
Source: Company, Angel Research
Mid Cap
M
arket Cap
CM
P
T
arget
Upsid
e
Company
Rationale
(` Cr)
(`)
(`)
(%)
Favourable outlook for the AC industry to augur well for
Cooling products business which is out pacing the market
Blue Star
3,413
379
429
13.1
growth. EMPPAC division's profitability to improve once
operating environment turns around.
Change in business focus towards high-margin chronic &
Ipca labs
9,470
751
900
19.9
lifestyle segments and increasing penetration in Europe and
US
Economic recovery to have favourable impact on advertising &
circulation revenue growth. Further, the acquisition of a radio
Jagran Prakashan
5,167
158
169
6.9
business (Radio City) would also boost the company's revenue
growth.
Earnings boost on back of stable material prices and
Radico Khaitan
1,526
115
156
36.0
favourable pricing environment. Valuation discount to peers
provides additional comfort
Strong brands and distribution network would boost growth
Siyaram Silk Mills
1,111
1,185
1,354
14.3
going ahead. Stock currently trades at an inexpensive
valuation.
Structural shift in the Lighting industry towards LED lighting will
Surya Roshni
648
148
183
23.8
drive growth.
Source: Company, Angel Research
Market Outlook
December 28, 2015
Key Upcoming Events
Global economic events release calendar
Date
Time
Country
Event Description
Unit
Period
Bloomberg Data
Last Reported Estimated
Dec 29, 2015
8:30PM
US
Consumer Confidence
S.A./ 1985=100
Dec
90.40
93.80
Jan 1, 2016
6:30AM
China
PMI Manufacturing
Value
Dec
49.60
49.80
Jan 4, 2016
2:25PM
Germany
PMI Manufacturing
Value
Dec F
53.00
53.00
3:00PM
UK
PMI Manufacturing
Value
Dec
52.70
52.90
Jan 5, 2016
2:25PM
Germany
Unemployment change (000's)
Thousands
Dec
(13.00)
(8.00)
Jan 6, 2016
2:25PM
Germany
PMI Services
Value
Dec F
55.40
55.40
Jan 7, 2016
3:30PM
Euro Zone
Euro-Zone Consumer Confidence
Value
Dec F
(5.70)
(5.70)
Jan 8, 2016
India
Imports YoY%
% Change
Dec
(30.26)
--
India
Exports YoY%
% Change
Dec
(24.43)
--
7:00PM
US
Change in Nonfarm payrolls
Thousands
Dec
211.00
200.00
7:00PM
US
Unnemployment rate
%
Dec
5.00
5.00
Jan 12, 2016
5:30PM
India
Industrial Production YoY
% Change
Nov
9.80
--
3:00PM
UK
Industrial Production (YoY)
% Change
Nov
1.70
--
Jan 14, 2016
12:00PM
India
Monthly Wholesale Prices YoY%
% Change
Dec
(1.99)
--
5:30PM
UK
BOE Announces rates
% Ratio
Jan 14
0.50
0.50
Jan 15, 2016
7:45PM
US
Industrial Production
%
Dec
(0.56)
--
US
Producer Price Index (mom)
% Change
Dec
0.10
--
Jan 19, 2016
3:00PM
UK
CPI (YoY)
% Change
Dec
0.10
--
Jan 20, 2016
7:00PM
US
Housing Starts
Thousands
Dec
1,173.00
--
7:00PM
US
Building permits
Thousands
Dec
1,282.00
--
3:00PM
UK
Jobless claims change
% Change
Dec
3.90
--
7:00PM
US
Consumer price index (mom)
% Change
Dec
--
--
Jan 21, 2016
3:30PM
Euro Zone
Euro-Zone CPI (YoY)
%
Dec F
0.20
--
6:15PM
Euro Zone
ECB announces interest rates
%
Jan 21
0.05
--
Jan 22, 2016
8:30PM
US
Existing home sales
Million
Dec
4.76
--
Jan 27, 2016
8:30PM
US
New home sales
Thousands
Dec
490.00
--
Jan 28, 2016
3:00PM
UK
GDP (YoY)
% Change
4Q A
2.10
--
12:30AM
US
FOMC rate decision
%
Jan 27
0.50
0.50
Jan 29, 2016
7:00PM
US
GDP Qoq (Annualised)
% Change
4Q A
2.00
--
Feb 2, 2016
11:00AM
India
RBI Reverse Repo rate
%
Feb 2
5.75
--
11:00AM
India
RBI Repo rate
%
Feb 2
6.75
--
11:00AM
India
RBI Cash Reserve ratio
%
Feb 2
4.00
--
Feb 12, 2016
3:30PM
Euro Zone
Euro-Zone GDP s.a. (QoQ)
% Change
4Q A
0.30
--
12:30PM
Germany
GDP nsa (YoY)
% Change
4Q P
1.80
--
Source: Bloomberg, Angel Research
Market Outlook
December 28, 2015
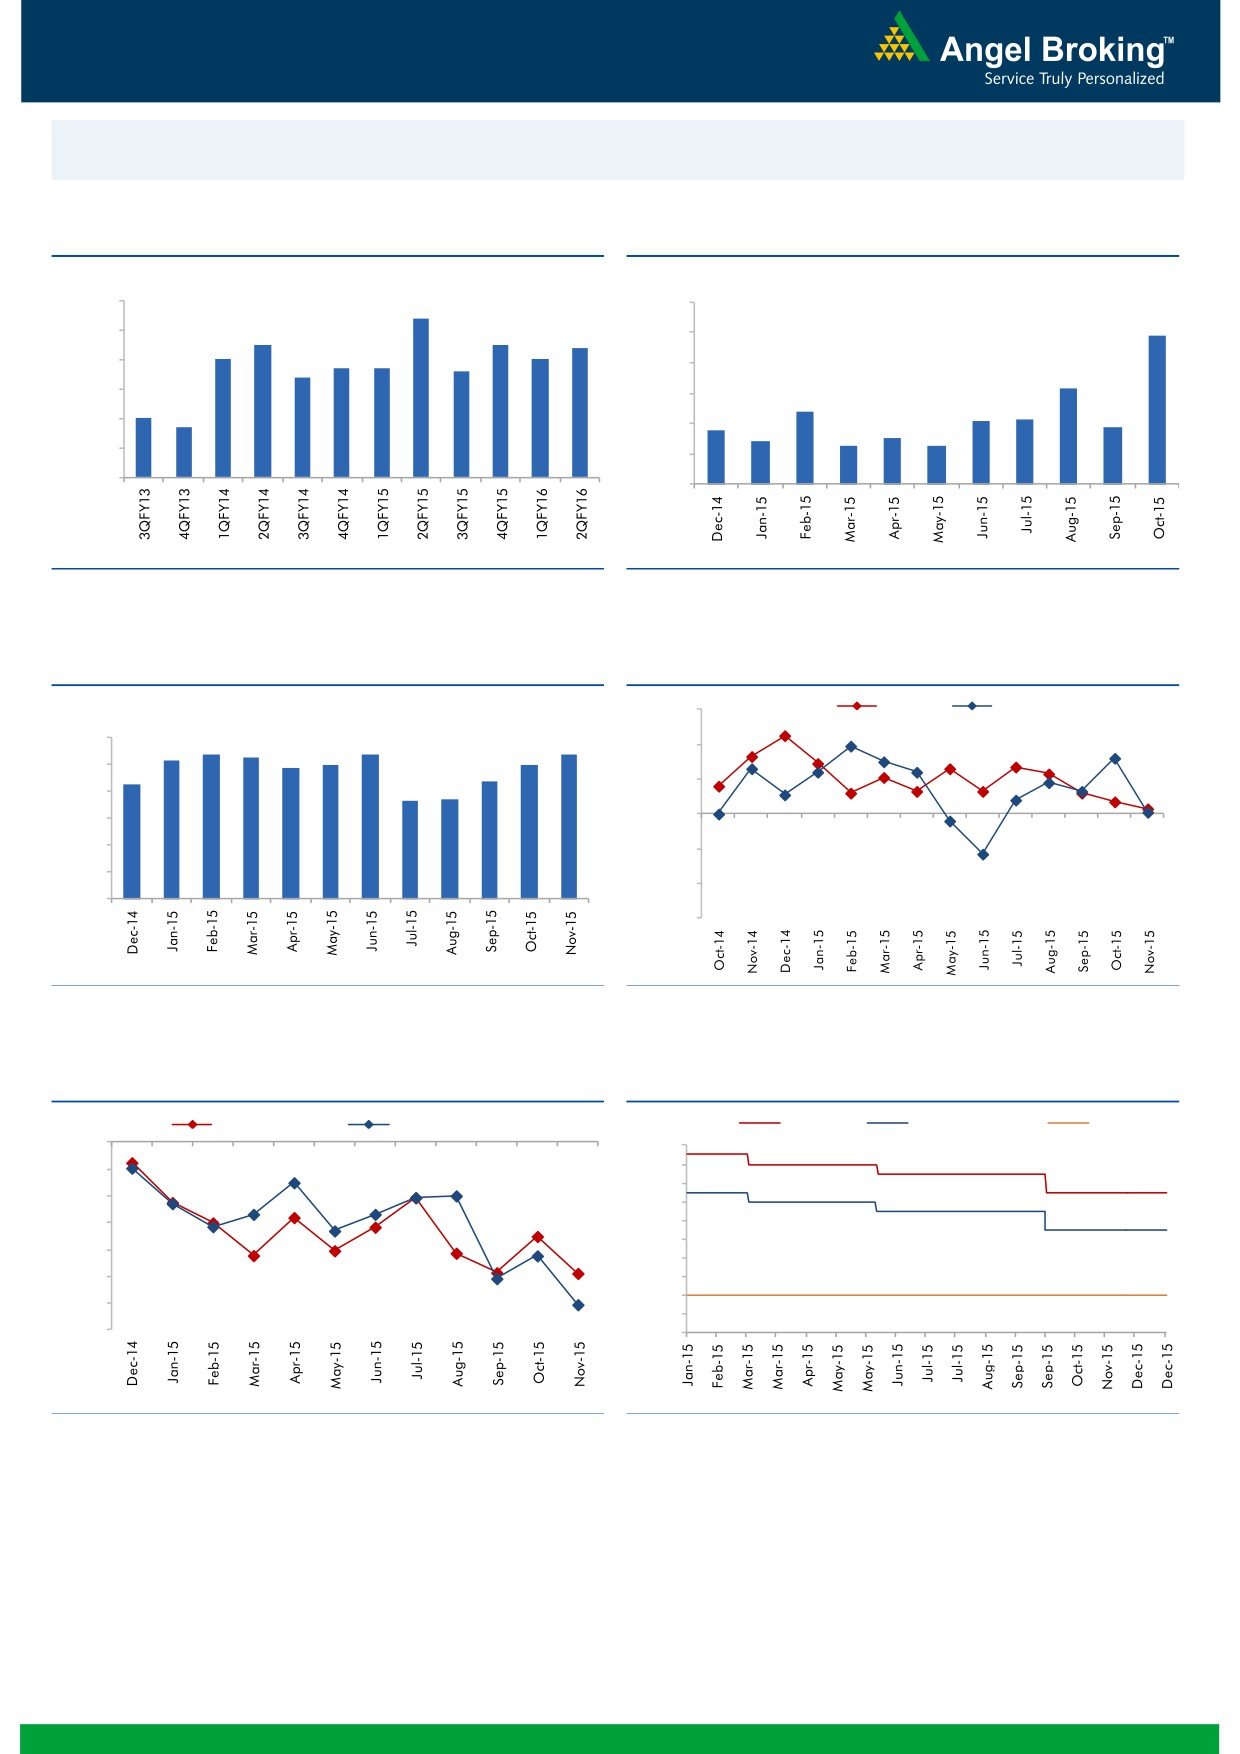
Macro watch
Exhibit 1: Quarterly GDP trends
Exhibit 2: IIP trends
(%)
(%)
9.0
8.4
12.0
9.8
8.0
7.5
7.5
7.4
10.0
7.0
7.0
6.7
6.7
6.6
7.0
6.4
8.0
6.3
6.0
6.0
4.8
5.0
4.2
4.3
4.7
3.6
3.8
5.0
4.0
3.0
2.8
2.5
2.5
4.0
2.0
3.0
-
Source: CSO, Angel Research
Source: MOSPI, Angel Research
Exhibit 3: Monthly CPI inflation trends
Exhibit 4: Manufacturing and services PMI
(%)
56.0
Mfg. PMI
Services PMI
6.0
5.4
5.3
5.4
5.4
5.2
5.0
5.0
54.0
4.9
5.0
4.3
4.4
3.7
3.7
52.0
4.0
3.0
50.0
2.0
48.0
1.0
46.0
-
44.0
Source: MOSPI, Angel Research
Source: Market, Angel Research; Note: Level above 50 indicates expansion
Exhibit 5: Exports and imports growth trends
Exhibit 6: Key policy rates
(%)
Exports yoy growth
Imports yoy growth
(%)
Repo rate
Reverse Repo rate
CRR
0.0
8.00
(5.0)
7.50
7.00
(10.0)
6.50
(15.0)
6.00
5.50
(20.0)
5.00
(25.0)
4.50
4.00
(30.0)
3.50
(35.0)
3.00
Source: Bloomberg, Angel Research
Source: RBI, Angel Research
Market Outlook
December 28, 2015
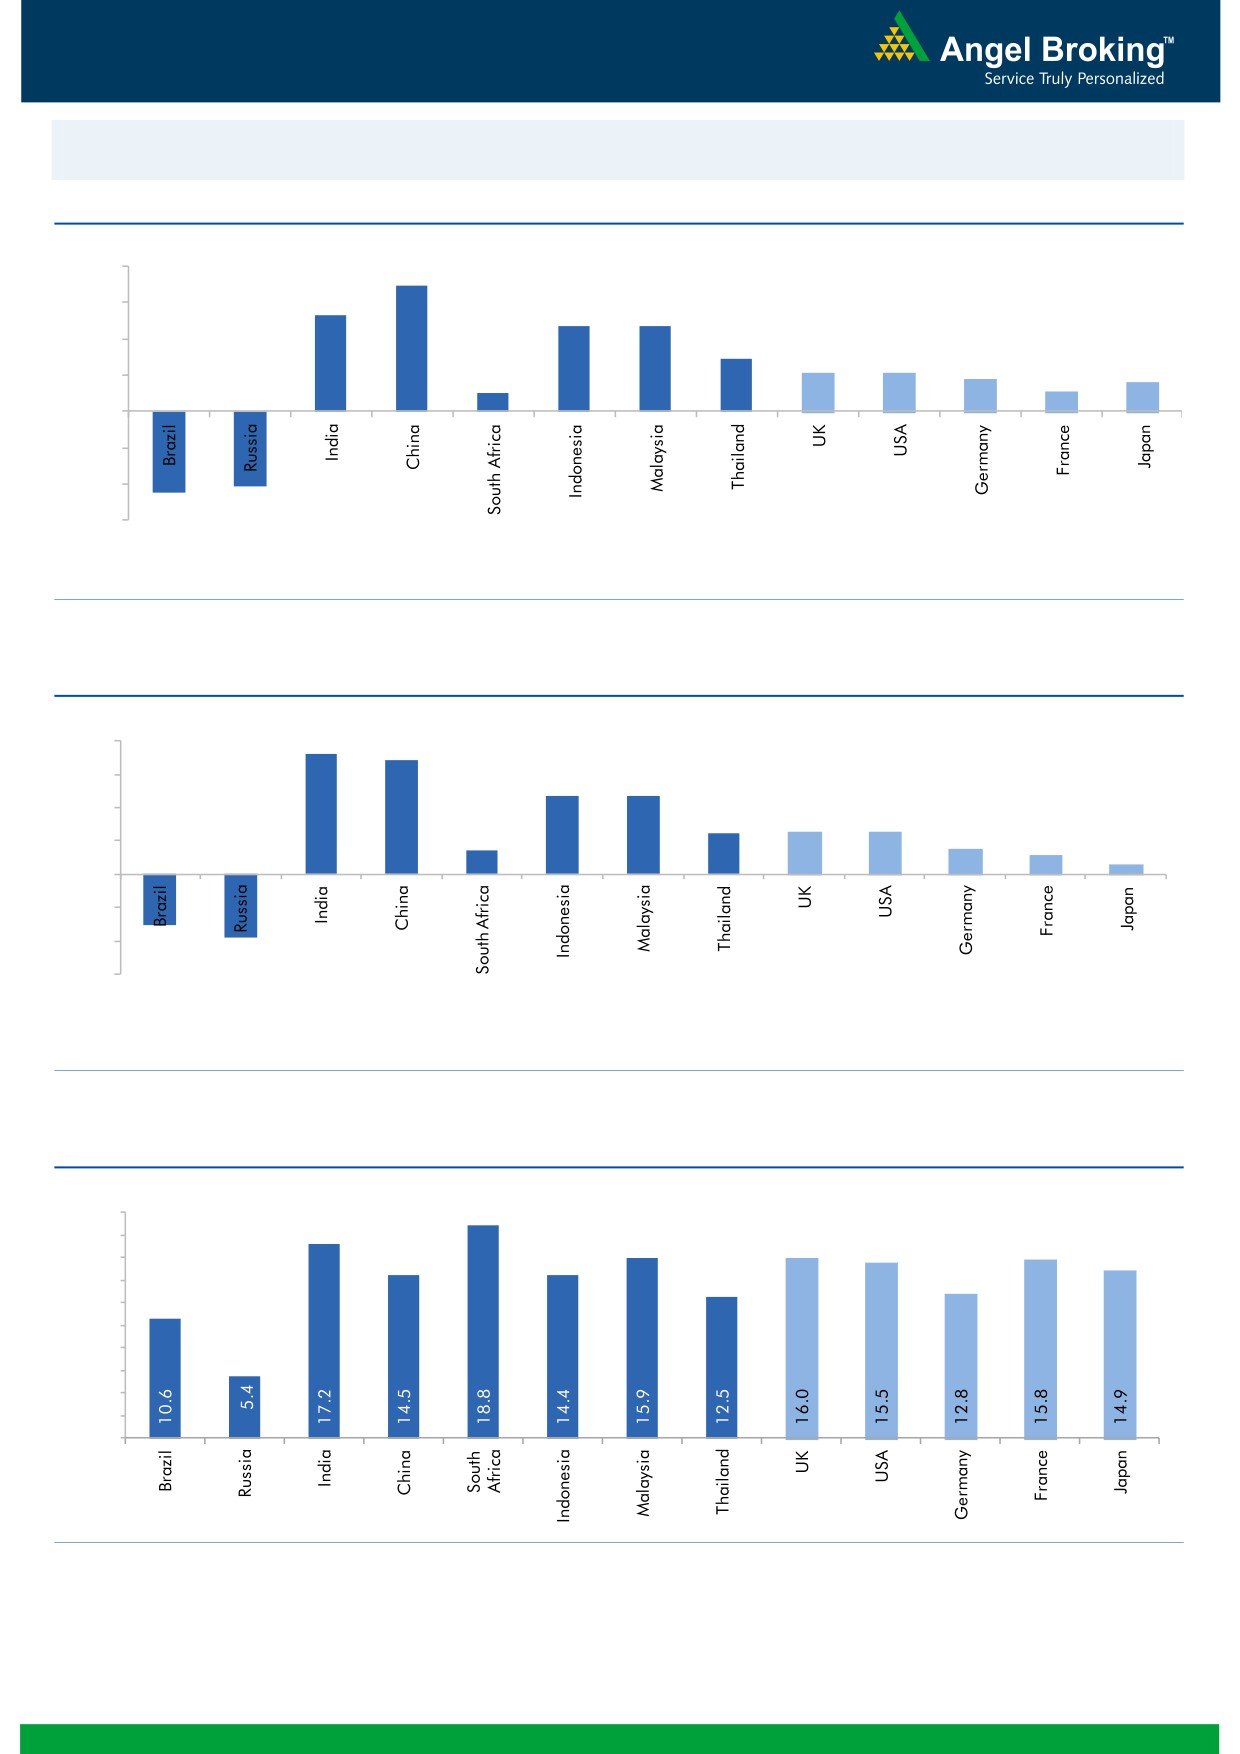
Global watch
Exhibit 1: Latest quarterly GDP Growth (%, yoy) across select developing and developed countries
(%)
8.0
6.9
5.3
6.0
4.7
4.7
4.0
2.9
2.1
2.1
1.8
2.0
1.0
1.1
1.6
-
(2.0)
(4.0)
(4.1)
(4.5)
(6.0)
Source: Bloomberg, Angel Research
Exhibit 2: 2015 GDP Growth projection by IMF (%, yoy) across select developing and developed countries
(%)
7.3
8.0
6.8
6.0
4.7
4.7
4.0
2.5
2.5
2.6
1.4
1.5
2.0
1.2
0.6
(3.8)
-
(2.0)
(4.0)
(3.0)
(6.0)
Source: IMF, Angel Research
Exhibit 3: One year forward P-E ratio across select developing and developed countries
(x)
20.0
18.0
16.0
14.0
12.0
10.0
8.0
6.0
4.0
2.0
-
Source: IMF, Angel Research
Market Outlook
December 28, 2015
Exhibit 4: Relative performance of indices across globe
Returns (%)
Country
Name of index
Closing price
1M
3M
1YR
Brazil
Bovespa
44,015
(8.6)
(5.5)
(6.4)
Russia
Micex
1,734
(5.4)
5.8
23.7
India
Nifty
7,861
0.2
(1.5)
(4.4)
China
Shanghai Composite
3,628
(0.3)
13.8
18.4
South Africa
Top 40
46,355
(1.2)
2.9
5.8
Mexico
Mexbol
43,528
(2.4)
1.1
1.2
Indonesia
LQ45
778
(0.2)
6.8
(11.4)
Malaysia
KLCI
1,664
(0.4)
1.5
(1.1)
Thailand
SET 50
815
(9.0)
(8.3)
(17.6)
USA
Dow Jones
17,552
(1.4)
8.3
(2.8)
UK
FTSE
6,255
(1.0)
4.7
(5.9)
Japan
Nikkei
18,769
(4.9)
4.8
9.4
Germany
DAX
10,728
(3.3)
13.8
8.1
France
CAC
4,663
(3.3)
4.1
9.7
Source: Bloomberg, Angel Research
Stock Watch
December 28, 2015
Company Name
Reco
CMP
Target
Mkt Cap
Sales ( Čcr )
OPM(%)
EPS (Č)
PER(x)
P/BV(x)
RoE(%)
EV/Sales(x)
(Č)
Price ( Č)
( Č cr )
FY16E FY17E
FY16E
FY17E
FY16E
FY17E
FY16E
FY17E
FY16E
FY17E
FY16E
FY17E
FY16E
FY17E
Agri / Agri Chemical
Rallis
Neutral
178
-
3,460
2,075
2,394
14.4
14.4
9.5
11.0
18.7
16.2
3.7
3.2
21.1
21.3
1.7
1.5
United Phosphorus
Buy
433
510
18,556
13,698
15,752
17.6
17.6
32.1
38.5
13.5
11.3
2.6
2.2
21.4
21.3
1.5
1.2
Auto & Auto Ancillary
Ashok Leyland
Buy
88
111
25,029
17,995
21,544
11.4
11.6
3.4
4.7
25.9
18.7
4.5
4.2
17.7
22.2
1.4
1.1
Bajaj Auto
Accumulate
2,485
2,728
71,902
23,695
27,298
21.3
20.4
134.6
151.5
18.5
16.4
5.9
5.0
31.8
30.6
2.6
2.2
Bharat Forge
Accumulate
860
943
20,017
7,867
8,881
20.0
20.3
34.4
41.0
25.0
21.0
4.8
4.0
21.1
20.9
2.7
2.3
Eicher Motors
Buy
16,172
19,036
43,914
15,379
16,498
15.6
16.6
473.2
574.8
34.2
28.1
12.6
9.4
36.7
33.2
2.8
2.5
Gabriel India
Accumulate
93
101
1,342
1,415
1,544
8.7
9.0
4.6
5.4
20.3
17.3
3.7
3.3
18.1
18.9
0.9
0.8
Hero Motocorp
Neutral
2,690
-
53,710
28,561
31,559
14.7
14.7
151.1
163.2
17.8
16.5
6.9
5.9
38.7
35.6
1.7
1.5
Jamna Auto Industries Neutral
134
-
1,071
1,292
1,486
9.3
9.8
6.0
7.5
22.3
17.9
4.6
3.9
20.7
21.8
0.9
0.8
L G Balakrishnan & Bros Neutral
520
-
817
1,254
1,394
11.6
11.8
35.9
41.7
14.5
12.5
2.0
1.7
13.5
13.8
0.8
0.7
Mahindra and Mahindra Buy
1,258
1,449
78,115
39,031
44,440
13.8
13.9
57.9
67.6
21.7
18.6
3.5
3.1
16.1
16.6
1.7
1.4
Maruti
Neutral
4,594
-
138,788
57,865
68,104
16.4
16.7
176.3
225.5
26.1
20.4
5.1
4.3
19.4
21.2
2.2
1.8
Minda Industries
Neutral
903
-
1,433
2,567
2,965
8.0
8.3
46.1
57.8
19.6
15.6
3.3
2.7
16.7
17.3
0.7
0.6
Motherson Sumi
Accumulate
293
313
38,703
39,343
45,100
8.8
9.1
10.1
12.5
29.0
23.4
9.2
7.2
35.3
34.4
1.1
0.9
Rane Brake Lining
Accumulate
340
366
269
454
511
11.1
11.4
23.8
28.1
14.3
12.1
2.0
1.8
14.2
15.3
0.7
0.7
Setco Automotive
Neutral
43
-
573
594
741
12.7
13.7
1.7
3.2
25.2
13.4
2.7
2.3
10.4
16.9
1.4
1.2
Tata Motors
Accumulate
382
402
110,407
255,254
301,772
12.9
13.4
23.7
37.3
16.1
10.3
2.0
1.6
7.4
12.1
0.6
0.5
TVS Motor
Buy
285
338
13,540
11,569
13,648
7.3
8.7
10.3
16.1
27.7
17.7
6.9
5.4
24.8
30.5
1.2
1.0
Amara Raja Batteries
Buy
863
1,040
14,740
4,892
5,871
17.4
17.6
28.8
37.1
30.0
23.3
7.0
5.6
23.4
24.1
3.0
2.4
Exide Industries
Accumulate
145
162
12,317
6,950
7,784
14.4
14.8
6.6
7.3
22.0
19.9
2.8
2.5
12.6
12.8
1.5
1.3
Apollo Tyres
Accumulate
154
171
7,814
12,146
12,689
16.8
16.0
21.2
19.0
7.2
8.1
1.2
1.1
16.5
13.0
0.7
0.8
Ceat
Accumulate
1,047
1,119
4,234
6,041
6,597
14.1
13.7
99.5
111.9
10.5
9.4
2.1
1.7
19.6
18.5
0.9
0.7
JK Tyres
Neutral
112
-
2,543
7,446
7,669
15.2
14.0
19.6
18.4
5.7
6.1
1.4
1.2
25.2
19.5
0.7
0.6
Swaraj Engines
Neutral
956
-
1,187
552
630
14.2
14.7
44.6
54.1
21.4
17.7
5.0
4.5
23.2
25.6
2.0
1.7
Subros
Neutral
114
-
685
1,268
1,488
11.6
11.9
3.7
6.6
30.9
17.3
2.1
1.9
6.8
11.4
0.8
0.7
Indag Rubber
Neutral
206
-
540
283
329
17.0
17.2
13.0
15.4
15.9
13.3
3.5
2.9
21.8
21.6
1.6
1.3
Capital Goods
ACE
Neutral
45
-
442
660
839
4.7
8.2
1.0
3.9
44.7
11.5
1.4
1.2
3.2
11.3
0.8
0.7
BEML
Neutral
1,286
-
5,354
3,277
4,006
6.0
8.9
29.2
64.3
44.0
20.0
2.5
2.2
5.7
11.7
1.7
1.4
Bharat Electronics
Accumulate
1,317
1,414
31,612
7,737
8,634
16.8
17.2
54.0
61.0
24.4
21.6
3.5
3.1
39.3
45.6
3.2
2.7
Stock Watch
December 28, 2015
Company Name
Reco
CMP
Target
Mkt Cap
Sales ( Čcr )
OPM(%)
EPS (Č)
PER(x)
P/BV(x)
RoE(%)
EV/Sales(x)
(Č)
Price ( Č)
( Č cr )
FY16E
FY17E
FY16E
FY17E
FY16E
FY17E
FY16E
FY17E
FY16E
FY17E
FY16E
FY17E
FY16E
FY17E
Capital Goods
Voltas
Accumulate
312
353
10,327
5,363
5,963
8.0
9.1
11.0
13.8
28.4
22.6
4.4
3.8
16.2
17.9
1.9
1.7
BGR Energy
Neutral
127
-
916
3,615
3,181
9.5
9.4
16.7
12.4
7.6
10.2
0.7
0.7
10.0
7.0
0.7
0.8
BHEL
Neutral
173
-
42,221
33,722
35,272
10.8
11.7
10.5
14.2
16.4
12.2
1.2
1.1
7.0
9.0
1.3
1.3
Blue Star
Accumulate
379
429
3,413
3,548
3,977
6.3
6.9
13.7
17.2
27.7
22.1
7.0
4.5
26.1
25.4
1.1
0.9
Crompton Greaves
Accumulate
193
204
12,074
13,484
14,687
4.9
6.2
4.5
7.1
42.8
27.1
3.0
2.8
7.2
10.8
1.0
0.9
Inox Wind
Buy
366
505
8,117
4,980
5,943
17.0
17.5
26.6
31.6
13.8
11.6
4.1
3.0
35.0
30.0
1.8
1.4
KEC International
Neutral
155
-
3,981
8,791
9,716
6.1
6.8
5.4
8.2
28.7
18.9
2.9
2.6
10.0
14.0
0.7
0.6
Thermax
Neutral
942
-
11,227
6,413
7,525
7.4
8.5
30.5
39.3
30.9
24.0
4.8
4.1
15.0
17.0
1.7
1.4
Cement
ACC
Buy
1,344
1,630
25,232
13,151
14,757
16.4
18.3
63.9
83.4
21.0
16.1
2.7
2.5
13.3
16.1
1.8
1.5
Ambuja Cements
Accumulate
203
233
31,558
11,564
12,556
19.4
20.7
8.9
10.1
22.9
20.1
2.9
2.7
12.8
13.8
2.4
2.2
HeidelbergCement
Neutral
80
-
1,805
1,772
1,926
13.3
15.4
1.0
3.0
79.7
26.6
2.0
1.9
2.6
7.9
1.6
1.4
India Cements
Buy
85
112
2,623
4,216
4,840
18.0
19.5
4.0
9.9
21.4
8.6
0.9
0.8
4.0
9.5
1.0
0.8
JK Cement
Buy
623
744
4,356
3,661
4,742
10.1
15.8
18.0
61.0
34.6
10.2
2.5
2.2
7.5
22.9
1.7
1.2
J K Lakshmi Cement
Buy
327
430
3,844
2,947
3,616
16.7
19.9
11.5
27.2
28.4
12.0
2.7
2.3
9.8
20.8
1.7
1.4
Mangalam Cements
Neutral
193
-
515
1,053
1,347
10.5
13.3
8.4
26.0
23.0
7.4
1.0
0.9
4.3
12.5
0.9
0.6
Orient Cement
Buy
156
183
3,193
1,854
2,524
21.2
22.2
7.7
11.1
20.2
14.0
2.9
2.5
13.3
15.7
2.5
1.7
Ramco Cements
Neutral
364
-
8,665
4,036
4,545
20.8
21.3
15.1
18.8
24.1
19.4
3.0
2.6
12.9
14.3
2.7
2.3
Shree Cement^
Neutral
10,904
-
37,986
7,150
8,742
26.7
28.6
228.0
345.5
47.8
31.6
7.0
5.9
15.7
20.3
5.1
4.1
UltraTech Cement
Buy
2,820
3,282
77,393
25,021
30,023
19.1
21.6
89.0
132.0
31.7
21.4
3.7
3.2
12.2
15.9
3.2
2.6
Construction
ITNL
Neutral
84
-
2,776
7,360
8,825
34.0
35.9
7.0
9.0
12.1
9.4
0.4
0.4
3.2
3.7
3.7
3.6
KNR Constructions
Buy
583
673
1,638
937
1,470
14.3
14.0
33.5
38.6
17.4
15.1
2.6
2.3
15.4
15.4
1.8
1.2
Larsen & Toubro
Buy
1,295
1,646
120,546
65,065
77,009
11.5
11.7
61.5
65.6
21.1
19.7
2.1
1.9
13.4
14.0
2.1
1.7
Gujarat Pipavav Port
Neutral
147
-
7,085
629
684
51.0
52.2
6.4
5.9
22.9
24.8
3.0
2.8
15.9
12.7
10.9
9.8
MBL Infrastructures
Buy
217
285
900
2,313
2,797
12.2
14.6
19.0
20.0
11.4
10.9
1.2
1.1
11.3
10.6
1.1
1.0
Nagarjuna Const.
Neutral
78
-
4,322
7,892
8,842
8.8
9.1
3.0
5.3
25.9
14.7
1.3
1.2
5.0
8.5
0.8
0.7
PNC Infratech
Neutral
535
-
2,746
1,873
2,288
13.2
13.5
24.0
32.0
22.3
16.7
2.2
1.9
12.1
12.3
1.6
1.3
Simplex Infra
Neutral
322
-
1,594
5,955
6,829
10.3
10.5
16.0
31.0
20.1
10.4
1.1
1.0
5.3
9.9
0.8
0.7
Power Mech Projects
Neutral
637
-
937
1,539
1,801
12.8
12.7
59.0
72.1
10.8
8.8
1.6
1.4
18.6
16.8
0.6
0.5
Sadbhav Engineering
Neutral
343
-
5,885
3,481
4,219
10.7
10.8
8.0
12.0
42.9
28.6
4.0
3.5
10.3
13.5
2.0
1.6
Stock Watch
December 28, 2015
Company Name
Reco
CMP
Target
Mkt Cap
Sales ( Čcr )
OPM(%)
EPS (Č)
PER(x)
P/BV(x)
RoE(%)
EV/Sales(x)
(Č)
Price ( Č)
( Č cr )
FY16E
FY17E
FY16E
FY17E
FY16E
FY17E
FY16E
FY17E
FY16E
FY17E
FY16E
FY17E
FY16E
FY17E
Construction
NBCC
Accumulate
992
1,089
11,900
7,382
9,506
7.7
8.6
39.8
54.4
24.9
18.2
6.0
4.7
26.7
29.1
1.4
1.0
SIPL
Neutral
98
-
3,434
675
1,042
62.4
64.7
-
-
3.7
4.2
-
-
16.8
11.3
Financials
Allahabad Bank
Neutral
71
-
4,258
8,569
9,392
2.8
2.9
16.3
27.5
4.4
2.6
0.4
0.3
7.6
11.9
-
-
Axis Bank
Buy
451
630
107,211
26,473
31,527
3.5
3.6
35.7
43.5
12.6
10.4
2.4
2.1
17.9
18.9
-
-
Bank of Baroda
Neutral
158
-
36,509
18,485
21,025
1.9
2.0
13.5
21.1
11.8
7.5
0.9
0.8
7.3
10.6
-
-
Bank of India
Neutral
118
-
9,313
15,972
17,271
1.9
2.0
15.3
33.4
7.7
3.5
0.4
0.3
3.6
7.6
-
-
Canara Bank
Neutral
241
-
13,073
15,441
16,945
2.0
2.1
46.6
70.4
5.2
3.4
0.5
0.4
8.0
11.2
-
-
Dena Bank
Neutral
41
-
2,658
3,440
3,840
2.1
2.3
7.3
10.0
5.7
4.1
0.4
0.4
6.1
7.9
-
-
Federal Bank
Neutral
56
-
9,643
3,477
3,999
3.0
3.0
5.0
6.2
11.2
9.0
1.1
1.0
10.6
11.9
-
-
HDFC
Neutral
1,230
-
194,143
10,358
11,852
3.3
3.3
41.1
47.0
30.0
26.2
5.7
5.2
24.7
24.9
-
-
HDFC Bank
Buy
1,074
1,262
270,982
38,309
47,302
4.3
4.3
49.3
61.1
21.8
17.6
3.8
3.2
18.5
19.7
-
-
ICICI Bank
Buy
258
354
149,834
34,279
39,262
3.3
3.3
21.0
24.4
12.3
10.6
2.1
1.8
14.4
14.7
-
-
IDBI Bank
Neutral
88
-
14,083
9,625
10,455
1.8
1.8
8.5
14.2
10.3
6.2
0.6
0.6
5.9
9.3
-
-
Indian Bank
Neutral
115
-
5,504
6,160
6,858
2.5
2.5
24.5
29.8
4.7
3.8
0.4
0.3
7.7
8.6
-
-
LIC Housing Finance
Buy
485
571
24,491
3,101
3,745
2.5
2.5
33.0
40.2
14.7
12.1
2.8
2.3
19.7
20.5
-
-
Oriental Bank
Neutral
137
-
4,100
7,643
8,373
2.4
2.4
37.2
45.4
3.7
3.0
0.3
0.3
8.2
9.4
-
-
Punjab Natl.Bank
Neutral
120
-
23,602
23,638
26,557
2.8
2.8
17.9
27.2
6.7
4.4
0.7
0.6
8.5
12.0
-
-
South Ind.Bank
Neutral
20
-
2,633
1,965
2,185
2.5
2.5
2.5
3.3
7.8
5.9
0.8
0.7
9.5
11.7
-
-
St Bk of India
Buy
229
283
177,496
82,520
93,299
2.7
2.8
20.0
24.5
11.4
9.4
1.2
1.1
11.5
12.8
-
-
Union Bank
Neutral
151
-
10,391
12,646
14,129
2.3
2.4
31.0
39.1
4.9
3.9
0.5
0.4
9.8
11.4
-
-
Vijaya Bank
Neutral
34
-
2,925
3,536
3,827
1.9
1.9
5.5
6.7
6.2
5.1
0.5
0.5
7.8
8.8
-
-
Yes Bank
Buy
725
921
30,415
7,190
9,011
3.2
3.3
58.2
69.7
12.5
10.4
2.2
1.9
19.2
19.6
-
-
FMCG
Asian Paints
Neutral
882
-
84,592
16,553
19,160
16.0
16.2
17.7
21.5
49.9
41.0
13.2
11.9
29.4
31.2
4.9
4.3
Britannia
Neutral
2,910
-
34,913
8,065
9,395
9.6
10.2
47.2
65.5
61.6
44.4
20.5
19.4
38.3
41.2
4.2
3.6
Colgate
Neutral
986
-
26,808
4,836
5,490
19.5
19.7
48.5
53.2
20.3
18.5
14.9
13.0
99.8
97.5
5.4
4.8
Dabur India
Neutral
277
-
48,719
9,370
10,265
17.1
17.2
7.3
8.1
37.8
34.2
11.4
9.3
33.7
30.6
5.1
4.7
GlaxoSmith Con*
Neutral
6,706
-
28,203
4,919
5,742
17.2
17.4
168.3
191.2
39.9
35.1
11.3
9.6
28.8
28.9
5.3
4.5
Godrej Consumer
Neutral
1,281
-
43,632
10,168
12,886
16.1
16.1
32.1
38.4
39.9
33.4
8.1
7.5
19.7
21.0
4.4
3.5
HUL
Neutral
863
-
186,796
34,940
38,957
17.5
17.7
20.8
24.7
41.5
35.0
46.2
36.9
110.5
114.2
5.2
4.6
Stock Watch
December 28, 2015
Company Name
Reco
CMP
Target
Mkt Cap
Sales ( Čcr )
OPM(%)
EPS (Č)
PER(x)
P/BV(x)
RoE(%)
EV/Sales(x)
(Č)
Price ( Č)
( Č cr )
FY16E FY17E
FY16E
FY17E
FY16E
FY17E
FY16E
FY17E
FY16E
FY17E
FY16E
FY17E
FY16E
FY17E
FMCG
ITC
Buy
323
382
259,609
41,068
45,068
37.8
37.4
13.9
15.9
23.2
20.3
7.8
6.9
34.1
33.8
6.0
5.4
Marico
Buy
226
363
29,171
6,551
7,766
15.7
16.0
10.4
12.5
21.8
18.1
6.3
5.3
33.2
32.4
4.4
3.7
Nestle*
Accumulate
5,779
6,646
55,719
11,291
12,847
22.2
22.3
158.9
184.6
36.4
31.3
19.0
17.1
55.0
57.3
4.8
4.2
Tata Global
Neutral
145
-
9,139
8,635
9,072
9.8
9.9
6.5
7.6
22.3
19.1
2.2
2.1
6.8
7.4
1.0
0.9
IT
HCL Tech^
Buy
860
1,132
121,191
42,038
47,503
23.2
23.5
55.8
62.9
15.4
13.7
3.5
2.7
23.0
19.8
2.5
2.0
Infosys
Buy
1,096
1,306
251,711
60,250
66,999
28.0
28.0
58.3
63.7
18.8
17.2
3.9
3.4
20.9
19.7
3.5
3.0
TCS
Buy
2,433
3,165
479,474
111,274
126,852
28.4
28.7
125.4
143.9
19.4
16.9
7.7
7.1
39.9
42.2
3.9
3.4
Tech Mahindra
Buy
518
646
50,095
25,566
28,890
16.0
17.0
26.3
31.9
19.7
16.2
3.5
3.0
17.9
18.6
1.7
1.5
Wipro
Buy
556
719
137,340
52,414
58,704
23.7
23.8
38.4
42.3
14.5
13.1
2.8
2.5
19.5
18.0
2.2
1.8
Media
D B Corp
Accumulate
331
356
6,072
2,241
2,495
27.8
27.9
21.8
25.6
15.2
12.9
4.0
3.5
26.7
28.5
2.7
2.4
HT Media
Neutral
91
-
2,115
2,495
2,603
11.2
11.2
7.3
8.6
12.5
10.6
1.0
0.9
7.4
8.1
0.4
0.3
Jagran Prakashan
Accumulate
158
169
5,167
2,170
2,355
27.2
26.2
8.9
9.9
17.8
16.0
3.7
3.3
20.9
20.5
2.3
2.1
Sun TV Network
Neutral
414
-
16,303
2,779
3,196
70.2
70.5
22.8
27.3
18.1
15.2
4.5
4.0
26.7
28.3
5.6
4.9
Hindustan Media
Neutral
293
-
2,147
920
1,031
20.0
20.0
19.2
20.9
15.2
14.0
2.5
2.2
16.4
15.3
1.9
1.7
Ventures
Metals & Mining
Coal India
Buy
322
380
203,640
76,167
84,130
19.9
22.3
22.4
25.8
14.4
12.5
5.2
5.1
35.5
41.0
2.0
1.8
Hind. Zinc
Buy
148
175
62,725
14,641
14,026
50.4
50.4
17.7
16.0
8.4
9.3
1.3
1.2
16.2
13.2
1.9
1.7
Hindalco
Neutral
85
-
17,573
104,356
111,186
8.7
9.5
6.7
11.1
12.7
7.7
0.5
0.4
3.5
5.9
0.7
0.6
JSW Steel
Neutral
1,064
-
25,707
42,308
45,147
16.4
20.7
(10.3)
49.5
21.5
1.2
1.1
(1.0)
5.6
1.7
1.5
NMDC
Neutral
91
-
36,079
8,237
10,893
46.6
44.5
10.0
11.7
9.2
7.8
1.0
0.9
12.5
13.0
4.2
3.2
SAIL
Neutral
49
-
20,134
45,915
53,954
7.2
10.5
1.5
4.4
32.4
11.1
0.5
0.5
2.3
4.1
1.1
1.0
Vedanta
Neutral
92
-
27,260
71,445
81,910
26.2
26.3
12.9
19.2
7.1
4.8
0.5
0.4
7.2
8.9
0.8
0.6
Tata Steel
Neutral
264
-
25,592
126,760
137,307
8.9
11.3
6.4
23.1
41.4
11.4
0.8
0.8
2.0
7.1
0.8
0.7
Oil & Gas
Cairn India
Neutral
138
-
25,957
11,323
12,490
49.4
51.0
20.7
20.7
6.7
6.7
0.4
0.4
6.4
6.1
1.4
0.7
GAIL
Neutral
362
-
45,951
64,856
70,933
9.1
9.6
24.0
28.9
15.1
12.6
1.3
1.2
8.8
9.6
0.9
0.8
ONGC
Neutral
234
-
200,156
154,564
167,321
36.8
37.4
28.6
32.5
8.2
7.2
1.0
1.0
12.7
13.5
1.5
1.4
Petronet LNG
Neutral
241
-
18,049
29,691
31,188
5.8
6.2
12.8
13.4
18.8
17.9
2.8
2.5
15.8
14.8
0.7
0.6
Indian Oil Corp
Neutral
434
-
105,276
359,607
402,760
5.9
6.1
42.5
48.7
10.2
8.9
1.4
1.2
14.1
14.4
0.4
0.4
Reliance Industries
Neutral
1,001
-
324,213
304,775
344,392
12.6
13.4
91.3
102.6
11.0
9.8
1.2
1.1
11.8
12.0
1.0
0.8
Pharmaceuticals
Alembic Pharma
Neutral
697
-
13,139
2,658
3,112
24.1
20.2
24.6
23.9
28.3
29.2
10.2
7.8
42.5
30.2
4.9
4.2
Stock Watch
December 28, 2015
Company Name
Reco
CMP
Target
Mkt Cap
Sales ( Čcr )
OPM(%)
EPS (Č)
PER(x)
P/BV(x)
RoE(%)
EV/Sales(x)
(Č)
Price ( Č)
( Č cr )
FY16E FY17E
FY16E
FY17E
FY16E
FY17E
FY16E
FY17E
FY16E
FY17E
FY16E
FY17E
FY16E
FY17E
Pharmaceuticals
Aurobindo Pharma
Neutral
871
-
50,878
14,923
17,162
23.0
23.0
38.2
43.6
22.8
20.0
7.0
5.3
36.0
30.2
3.8
3.2
Aventis*
Neutral
4,381
-
10,089
2,082
2,371
17.4
20.8
118.2
151.5
37.1
28.9
5.4
4.4
19.9
25.5
4.5
3.8
Cadila Healthcare
Neutral
390
-
39,931
10,224
11,840
21.0
22.0
14.6
17.6
26.7
22.2
7.3
5.7
30.8
29.0
4.0
3.3
Cipla
Neutral
648
-
52,066
14,211
16,611
20.6
19.0
27.0
28.9
24.0
22.4
4.1
3.5
18.4
16.8
3.7
3.1
Dr Reddy's
Buy
3,010
3,933
51,338
16,838
19,575
25.0
23.1
167.5
178.8
18.0
16.8
3.8
3.2
23.1
20.4
3.0
2.5
Dishman Pharma
Neutral
325
-
2,622
1,733
1,906
21.5
21.5
17.0
19.9
19.1
16.3
1.9
1.7
10.5
11.2
2.0
1.7
GSK Pharma*
Neutral
3,296
-
27,914
2,870
3,158
20.0
22.1
59.5
68.3
55.4
48.3
16.3
16.8
28.5
34.3
9.2
8.4
Indoco Remedies
Neutral
337
-
3,101
1,033
1,199
15.9
18.2
9.4
13.6
35.8
24.8
5.3
4.5
15.7
19.7
3.1
2.7
Ipca labs
Buy
751
900
9,470
3,363
3,909
12.9
18.6
13.4
28.0
56.0
26.8
4.0
3.5
7.4
14.0
3.1
2.7
Lupin
Neutral
1,805
-
81,335
13,092
16,561
25.0
27.0
50.4
68.3
35.8
26.4
7.4
5.9
22.8
24.7
5.9
4.6
Sun Pharma
Buy
792
950
190,495
28,163
32,610
25.8
30.7
17.4
26.9
45.5
29.4
4.3
3.7
13.0
16.6
6.2
5.2
Power
Tata Power
Neutral
66
-
17,959
35,923
37,402
22.6
22.8
4.1
5.2
16.4
12.9
1.3
1.2
7.5
9.3
1.4
1.3
NTPC
Accumulate
139
157
114,653
87,064
98,846
23.5
23.5
11.7
13.2
11.9
10.5
1.3
1.2
11.4
12.1
2.3
2.1
Power Grid
Buy
140
170
73,399
20,702
23,361
86.7
86.4
12.1
13.2
11.6
10.6
1.7
1.5
15.6
15.1
8.5
7.9
Telecom
Bharti Airtel
Neutral
338
-
135,272
101,748
109,191
32.1
31.7
12.0
12.5
28.2
27.1
1.9
1.8
6.9
6.7
2.0
1.8
Idea Cellular
Neutral
141
-
50,814
34,282
36,941
32.0
31.5
5.9
6.2
23.9
22.8
2.2
2.0
9.9
9.3
2.1
1.9
zOthers
Abbott India
Neutral
5,637
-
11,978
2,715
3,153
14.5
14.1
134.3
152.2
42.0
37.0
10.5
8.6
27.4
25.6
4.1
3.5
Bajaj Electricals
Buy
214
290
2,157
4,719
5,287
5.2
5.8
8.6
12.7
25.0
16.9
2.9
2.5
11.4
14.8
0.5
0.4
Finolex Cables
Neutral
251
-
3,835
2,520
2,883
12.2
12.0
12.7
14.2
19.8
17.7
2.7
2.4
13.6
13.5
1.3
1.1
Goodyear India*
Accumulate
571
622
1,317
1,888
1,680
12.1
11.9
62.2
56.6
9.2
10.1
2.2
1.8
25.9
19.7
0.5
0.5
Hitachi
Neutral
1,367
-
3,716
1,779
2,081
7.8
8.8
21.8
33.4
62.7
40.9
10.1
8.2
17.4
22.1
2.2
1.8
Jyothy Laboratories
Neutral
299
-
5,414
1,620
1,847
11.5
11.5
7.3
8.5
41.0
35.3
5.3
4.9
13.3
14.4
3.2
2.7
MRF
Buy
39,498
45,575
16,752
20,316
14,488
21.4
21.1
5,488.0
3,798.0
7.2
10.4
2.5
2.0
41.1
21.2
0.8
1.0
Page Industries
Neutral
12,937
-
14,430
1,929
2,450
19.8
20.1
229.9
299.0
56.3
43.3
24.8
17.3
52.1
47.1
7.5
5.9
Relaxo Footwears
Neutral
487
-
5,845
1,767
2,152
12.3
12.5
19.3
25.1
25.3
19.4
6.2
4.8
27.7
27.8
3.4
2.7
Siyaram Silk Mills
Accumulate
1,185
1,354
1,111
1,636
1,815
11.5
11.5
89.9
104.1
13.2
11.4
2.2
1.9
17.9
17.8
0.8
0.7
Styrolution ABS India*
Neutral
727
-
1,278
1,271
1,440
8.6
9.2
32.0
41.1
22.7
17.7
2.3
2.1
10.7
12.4
1.0
0.8
TVS Srichakra
Buy
2,792
3,240
2,138
2,101
2,338
15.7
15.0
248.6
270.0
11.2
10.3
4.9
3.5
43.6
34.0
1.1
0.9
HSIL
Neutral
304
-
2,195
2,123
2,384
16.1
16.5
15.0
18.9
20.2
16.1
1.6
1.5
8.0
9.4
1.4
1.2
Stock Watch
December 28, 2015
Company Name
Reco
CMP
Target
Mkt Cap
Sales ( Čcr )
OPM(%)
EPS (Č)
PER(x)
P/BV(x)
RoE(%)
EV/Sales(x)
(Č)
Price ( Č)
( Č cr )
FY16E FY17E
FY16E FY17E
FY16E FY17E
FY16E
FY17E
FY16E
FY17E
FY16E
FY17E
FY16E
FY17E
zOthers
Kirloskar Engines India
Neutral
245
-
3,544
2,471
2,826
8.8
10.4
9.1
13.3
26.9
18.4
2.6
2.4
9.7
13.4
1.1
0.9
Ltd
M M Forgings
Buy
507
614
612
511
615
21.7
21.6
43.1
55.8
11.8
9.1
2.1
1.8
19.9
21.2
1.4
1.1
Banco Products (India) Neutral
140
-
1,001
1,208
1,353
11.0
12.3
10.8
14.5
13.0
9.7
1.5
1.3
11.9
14.5
0.8
0.7
Competent Automobiles Neutral
151
-
93
1,040
1,137
3.2
3.1
25.7
28.0
5.9
5.4
0.9
0.8
15.0
14.3
0.1
0.1
Nilkamal
Neutral
1,233
-
1,839
1,910
2,083
10.5
10.3
63.3
69.2
19.5
17.8
3.2
2.7
17.6
16.5
1.0
0.9
Visaka Industries
Accumulate
127
144
202
1,086
1,197
9.9
10.3
21.5
28.8
5.9
4.4
0.6
0.5
9.6
11.6
0.4
0.3
Transport Corporation of
Neutral
299
-
2,275
2,830
3,350
8.8
9.0
14.4
18.3
20.8
16.3
3.2
2.8
15.4
17.1
0.9
0.8
India
Elecon Engineering
Neutral
86
-
936
1,369
1,533
13.7
14.9
3.3
6.1
25.9
14.2
1.7
1.6
6.6
11.4
1.0
0.9
Surya Roshni
Buy
148
183
648
2,992
3,223
8.1
8.4
14.7
18.3
10.1
8.1
0.9
0.9
9.7
11.0
0.5
0.5
MT Educare
Neutral
181
-
719
286
366
18.3
17.7
7.7
9.4
23.4
19.3
4.9
4.3
20.2
21.1
2.4
1.8
Radico Khaitan
Buy
115
156
1,526
1,565
1,687
12.2
13.0
5.7
7.1
20.1
16.2
1.7
1.6
8.3
9.6
1.4
1.3
Garware Wall Ropes
Accumulate
432
473
944
861
967
10.9
10.9
24.0
28.2
18.0
15.3
2.6
2.3
14.6
14.9
1.1
1.0
Wonderla Holidays
Neutral
401
-
2,267
206
308
44.0
43.6
9.0
12.9
44.6
31.1
6.1
5.5
13.7
17.8
10.9
7.3
Linc Pen & Plastics
Neutral
218
-
322
340
371
8.3
8.9
10.8
13.2
20.2
16.5
3.2
2.8
16.0
17.1
1.0
0.9
The Byke Hospitality
Neutral
149
-
598
222
287
20.5
20.5
5.6
7.6
26.5
19.7
5.0
4.1
18.9
20.8
2.7
2.1
Interglobe Aviation
Neutral
1,164
-
41,962
17,022
21,122
20.7
14.5
63.9
53.7
18.2
21.7
27.3
22.4
149.9
103.2
2.5
2.0
Coffee Day Enterprises
Neutral
279
-
5,752
2,692
2,964
17.0
18.6
-
4.7
-
58.9
3.4
3.2
0.2
5.5
2.5
2.4
Ltd
Navneet Education
Accumulate
88
97
2,100
998
1,062
24.1
24.0
5.8
6.1
15.3
14.5
3.4
3.0
22.0
20.6
2.2
2.1
Source: Company, Angel Research; Note: *December year end; #September year end; &October year end; Price as on December 24, 2015
Market Outlook
December 28, 2015
Research Team Tel: 022 - 39357800
DISCLAIMER
Angel Broking Private Limited (hereinafter referred to as “Angel”) is a registered Member of National Stock Exchange of India Limited,
Bombay Stock Exchange Limited and Metropolitian Stock Exchange of India Limited. It is also registered as a Depository Participant with
CDSL and Portfolio Manager with SEBI. It also has registration with AMFI as a Mutual Fund Distributor. Angel Broking Private Limited is a
registered entity with SEBI for Research Analyst in terms of SEBI (Research Analyst) Regulations, 2014 vide registration number
INH000000164. Angel or its associates has not been debarred/ suspended by SEBI or any other regulatory authority for accessing
/dealing in securities Market. Angel or its associates including its relatives/analyst do not hold any financial interest/beneficial ownership
of more than 1% in the company covered by Analyst. Angel or its associates/analyst has not received any compensation / managed or co
-managed public offering of securities of the company covered by Analyst during the past twelve months. Angel/analyst has not served as
an officer, director or employee of company covered by Analyst and has not been engaged in market making activity of the company
covered by Analyst.
This document is solely for the personal information of the recipient, and must not be singularly used as the basis of any investment
decision. Nothing in this document should be construed as investment or financial advice. Each recipient of this document should make
such investigations as they deem necessary to arrive at an independent evaluation of an investment in the securities of the companies
referred to in this document (including the merits and risks involved), and should consult their own advisors to determine the merits and
risks of such an investment.
Reports based on technical and derivative analysis center on studying charts of a stock's price movement, outstanding positions and
trading volume, as opposed to focusing on a company's fundamentals and, as such, may not match with a report on a company's
fundamentals.
The information in this document has been printed on the basis of publicly available information, internal data and other reliable sources
believed to be true, but we do not represent that it is accurate or complete and it should not be relied on as such, as this document is for
general guidance only. Angel Broking Pvt. Limited or any of its affiliates/ group companies shall not be in any way responsible for any
loss or damage that may arise to any person from any inadvertent error in the information contained in this report. Angel Broking Pvt.
Limited has not independently verified all the information contained within this document. Accordingly, we cannot testify, nor make any
representation or warranty, express or implied, to the accuracy, contents or data contained within this document. While Angel Broking
Pvt. Limited endeavors to update on a reasonable basis the information discussed in this material, there may be regulatory, compliance,
or other reasons that prevent us from doing so.
This document is being supplied to you solely for your information, and its contents, information or data may not be reproduced,
redistributed or passed on, directly or indirectly.
Neither Angel Broking Pvt. Limited, nor its directors, employees or affiliates shall be liable for any loss or damage that may arise from or
in connection with the use of this information.
Note: Please refer to the important ‘Stock Holding Disclosure' report on the Angel website (Research Section). Also, please refer to the
latest update on respective stocks for the disclosure status in respect of those stocks. Angel Broking Pvt. Limited and its affiliates may have
investment positions in the stocks recommended in this report.