Market Outlook
July 28, 2016
Market Cues
Domestic Indices
Chg (%)
(Pts)
(Close)
Indian markets are expected to open flat tracking SGX Nifty.
BSE Sensex
0.2
48
28,024
The Dow Jones and the S&P 500 Index closed lower on Wednesday, after briefly
Nifty
0.3
25
8,616
notching gains on the session, after the Federal Reserve signalled a willingness to
Mid Cap
0.6
75
12,496
raise benchmark interest rates in the fall. Consumer-staples shares, led by a 3.3%
Small Cap
0.5
59
12,209
drop in shares of Coca-Cola Co. Energy stocks were down 1%, suffered from a drop
Bankex
0.9
192
21,762
in crude-oil prices, while technology and telecom shares advanced slightly.
European stocks finished higher Wednesday, with surges in shares of French firms
Global Indices
Chg (%)
(Pts)
(Close)
LVMH and Peugeot SA helping to offset a drop in Deutsche Bank AG shares after the
Dow Jones
(0.0)
(2)
18,472
German lender’s profit plunged. The U.K’s FTSE 100 was up, with shares of
broadcaster ITV PLC closing up nearly 8% and helping the British benchmark reach
Nasdaq
0.6
30
5,140
a fresh 2016 closing high.
FTSE
0.4
26
6,750
Nikkei
1.7
282
16,665
After a consolidation, Indian indices closed marginally higher on Wednesday as
traders remained cautious ahead of the expiry of derivative contracts & the outcome
Hang Seng
0.4
89
22,219
of Federal Reserve's two-day meeting. The Sensex rallied initially on hopes of
Shanghai Com
(1.9)
-58
2,992
stimulus measures by Bank of Japan but turned volatile in afternoon trade,
especially after correction in China's Shanghai on fears of regulatory changes.
Advances / Declines
BSE
NSE
News Analysis & Result Review
Advances
1,313
796
News Analysis: Bharat Electronics Ltd
Declines
1,365
807
Results Review: HDFC, Yes Bank
Unchanged
201
72
Detailed analysis on Pg2
Investor’s Ready Reckoner
Volumes (` Cr)
BSE
3,487
Key Domestic & Global Indicators
NSE
24,092
Stock Watch: Latest investment recommendations on 150+ stocks
Refer Pg6 onwards
Net Inflows (` Cr)
Net
Mtd
Ytd
Top Picks
FII
718
8,645
28,188
CMP
Target
Upside
Company
Sector
Rating
(`)
(`)
(%)
MFs
(348)
(411)
8,933
Amara Raja
Auto/Auto Ancillary
Buy
895
1,076
20.3
HCL Tech
IT
Buy
754
1,000
32.7
Top Gainers
Price (`)
Chg (%)
LIC Housing
Financials
Accumulate
518
582
12.4
Renuka
18
11.0
Bharat Electronics
Capital Goods
Accumulate
1,219
1,414
16.0
Jindalstel
88
9.7
Navkar Corporation Others
Buy
209
265
26.6
L&Tfh
85
8.6
More Top Picks on Pg4
Muthootfin
309
7.5
Key Upcoming Events
Edelweiss
94
6.4
Previous
Consensus
Date
Region
Event Description
Reading
Expectations
July 28
US
Initial Jobless claims
253.00
261.00
Top Losers
Price (`)
Chg (%)
July 28 Eurozone
Eurozone Consumer Confidence
(7.90)
(7.90)
Drreddy
2,988
(10.1)
July 28 Germany
Unemployment Change (000’s)
(6.00)
(4.00)
Mrpl
81
(5.8)
July 29 Germany
PMI Manufacturing
53.70
Dishtv
94
(5.3)
July 29
US
GDP QoQ (Annualised)
1.10
2.60
6.(
Jppower
6
(5.2)
More Events on Pg5
Cadilahc
358
(4.6)
As on July 27, 2016
Market Outlook
July 28, 2016
News Analysis
India orders four maritime spy planes from Boeing
India signed a contract on Wednesday to buy four maritime spy planes from
Boeing Co for about $1 billion, defence and industry sources said, aiming to
bolster the navy as it tries to check China's presence in the Indian Ocean. Under
the new Defense Procurement Policy guidelines, part of the work would need to be
sourced from indigenous sources. Indian companies such as Bharat Electronics Ltd
with large market share in this sector stand to benefit. We have a BUY rating on
the stock with a target of `1,414.
Result Review
HDFC reports stable set of numbers for the quarter
HDFC Ltd reported marginal pick up in the business growth during the quarter
with 14.9% growth in AUM. While this looks better than the growth witnessed in
4QFY16, it still remains sluggish, partly due to sell down of loans. Higher sell
down of assets and competitive pressure seems to have put some pressure on NIM
during the quarter where in the NIM was down 10 bps QoQ to 3.8%. During the
quarter HDFC booked gains of `725cr on its sell of 22.9% stake in General
Insurance business and hence the reported PAT looks higher at `1871cr. However,
adjusting for the onetime gain and `275cr worth of additional provisions the
reported were more or less in line with expectations.
Asset quality saw marginal weakening as seen from the GNPAs % which saw
5
bps increase going up to 0.75% vs 0.70% QoQ. While growth seems will pick up
in the medium term. Excluding the values of JVs, Holding companies and
subsidiaries the core business of the corporation is trading at 3x its FY18E BV and
seems fairly valued. The stock return going ahead could be in sync with business
growth. Looking at the rich valuations we believe in the near term the stock might
remain range bound. However, investors with a long term horizon can hold on to
the stock. We have a NEUTRAL rating on the stock.
Yes Bank reports yet another quarter of strong results
Yes Bank continued to report yet another quarter of strong growth. Loan growth of
33% exceeded our expectations. Both on NII and PAT front the bank has posted
very good set of results for the quarter. Despite strong growth it has been able to
maintain stable asset quality, as GNPAs went up by only 3 bps QoQ and in
absolute term it went up by 13%, compared to 34% QoQ rise in absolute GNPA in
Q4FY16. While operationally the bank has been doing good, with the recent rally
in the stock the valuations seems rich. While existing investors can continue to hold
the stock, fresh additions can be considered only on declines. While fundamentally
the balance sheet looks strong due to rich valuations we have a NEUTRAL rating
on the stock.
Market Outlook
July 28, 2016
Economic and Political News
Railways announces measures to boost freight traffic
Ministry of Commerce & Industry announces 6.27% increase in exports YoY
Lok Sabha passes the Benami transactions bill
Corporate News
Bajaj Auto reports lower exports
Vistara reports 2.8% market share while Jet market share declines by 2%
Eicher Motor and Polaris JV launch new compact utility vehicle at 2.32 lac
Quarterly Bloomberg Brokers Consensus Estimate
Punjab National Bank Ltd - July 28, 2016
Particulars (` cr)
1QFY17E
1QFY16
y-o-y (%)
4QFY16
q-o-q (%)
Net profit
125
721
(82.7)
(5,367)
0.0
Eicher Motors Ltd - July 28, 2016
Particulars (` cr)
1QFY17E
1QFY16
y-o-y (%)
4QFY16
q-o-q (%)
Net sales
3874.8
3144.1
23.2
3702.1
4.7
EBITDA
640.1
438.4
32.4
668
(4.2)
EBITDA margin (%)
16.5
13.9
18.0
Net profit
354.7
221.8
59.9
334.5
6.0
ICICI Bank Ltd - July 29, 2016
Particulars ( `cr)
1QFY17E
1QFY16
y-o-y (%)
4QFY16
q-o-q (%)
Net profit
2,109
2,976
(29.1)
3,056
(31.0)
Larsen & Toubro Ltd - July 29, 2016
Particulars (` cr)
1QFY17E
1QFY16
y-o-y (%)
4QFY16
q-o-q (%)
Net sales
11,781
10,710
10.0
20,841
(43.5)
EBITDA
1,075
975
10.3
3,193
(66.3)
EBITDA margin (%)
9.1
9.1
15.3
Net profit
763
701
8.8
2,539
(70.0)
UPL Ltd - July 29, 2016
Particulars (` cr)
1QFY17E
1QFY16
y-o-y (%)
4QFY16
q-o-q (%)
Net sales
3,432
3,012
13.9
4,292
(20.0)
EBITDA
686
562
22.1
981
(30.1)
EBITDA margin (%)
20.0
18.7
22.9
Net profit
320
275
16.4
560
(42.9)
Nestle India Ltd - July 29, 2016
Particulars (` cr)
2QCY16E
2QCY15
y-o-y (%)
1QCY16
q-o-q (%)
Net sales
2,364
1,934
22.2
2,296
3.0
EBITDA
485
383
26.4
525
(7.7)
EBITDA margin (%)
20.5
19.8
22.9
Net profit
286
231
23.9
259
10.5
Market Outlook
July 28, 2016
Top Picks ★★★★★
Large Cap
Market Cap
CMP
Target
Upside
Company
Rationale
(` Cr)
(`)
(`)
(%)
To outpace battery industry growth due to better technological
Amara Raja Batteries
15,283
895
1,076
20.3
products leading to market share gains in both the automotive
OEM and replacement segments.
Uptick in defense capex by government, coupled with BELs
Bharat Electronics
29,260
1,219
1,414
16.0
strong market positioning, indicate good times ahead for BEL.
HCL Tech
1,06,315
754
1,000
32.7
Stock is trading at attractive valuations & factors all bad news.
Back on the growth trend, expect a long term growth of 14% to
Infosys
2,49,804
1,088
1,374
26.3
be a US$20bn in FY2020.
Continues to grow its retail loan book at healthy pace with
LIC Housing Fin.
26,126
518
582
12.4
improvement in asset quality. Expect LICHF to post a healthy
loan book which is likely to reflect in a strong earnings growth.
Strong market positioning within the domestic AC markets to
Voltas
11,381
344
407
18.3
continue, EMP business set to revive
Source: Company, Angel Research
Mid Cap
Market Cap
CMP
Target
Upside
Company
Rationale
(` Cr)
(`)
(`)
(%)
Among the top 4 players in the consumer durables segment.
Bajaj Electricals
2,433
241
268
11.3
Improved profitability backed by turn around in E&P segment.
Strong order book lends earnings visibility.
With a focus on the low and medium income (LMI) consumer
Dewan Housing
6,471
222
270
21.8
segment, the company has increased its presence in tier-II & III
cities where the growth opportunity is immense.
Strong loan growth backed by diversified loan portfolio and
Equitas Holdings
6,505
194
235
21.2
adequate CAR. ROE & ROA likely to remain decent as risk of
dilution remains low. Attractive valuations considering growth.
Expectations of above average monsoon augurs well for
Goodyear India
1,216
527
631
19.7
Goodyear India as it derives ~50% of its turnover from farm
tyre segment.
Commencement of new projects, downtrend in the interest rate
IL&FS Transport
2,533
77
93
20.8
cycle, to lead to stock re-rating
Economic recovery to have favourable impact on advertising &
Jagran Prakashan
5,915
181
205
13.3
circulation revenue growth. Further, the acquisition of a radio business
(Radio City) would also boost the company`s revenue growth.
Speedier execution and speedier sales, strong revenue visibility
Mahindra Lifespace
1,884
459
554
20.6
in short-to-long run, attractive valuations
Massive capacity expansion along with rail advantage at ICD
Navkar Corporation
2,985
209
265
26.6
as well CFS augurs well for the company
Earnings boost on back of stable material prices and
Radico Khaitan
1,235
93
125
34.7
favourable pricing environment. Valuation discount to peers
provides additional comfort
Strong brands and distribution network would boost growth
Siyaram Silk Mills
978
1,043
1,347
29.1
going ahead. Stock currently trades at an inexpensive
valuation.
Source: Company, Angel Research
Market Outlook
July 28, 2016
Key Upcoming Events
Result Calendar
Date
Company
July 28, 2016
FAG Bearings, CEAT, Punjab Natl.Bank, Syndicate Bank, Hexaware, Tree House, GSK Pharma
July 29, 2016
United Phosphorus, KEC International, PVR, Sesa Goa, Alembic Pharma, Indoco Remedies, Narayana Hrudaya
July 30, 2016
Relaxo, Nilkamal
August 01, 2016
Tech Mahindra, Banco, Interglobe Aviation, VRL Logistics
August 02, 2016
Indian Bank, UFO Moviez
August 03, 2016
Ramco Cements, HCL Tech, Cadila Healthcare, Dishman Pharma
August 04, 2016
Kirloskar Engines India Ltd, Tata Power Co.
August 05, 2016
LMW, GlaxoSmith Con
Source: Bloomberg, Angel Research
Global economic events release calendar
Bloomberg Data
Date
Time
Country Event Description
Unit
Period
Last Reported Estimated
Jul 28, 2016
6:00 PM
US
Initial Jobless claims
Thousands Jul 23
253.00
261.00
2:30 PM Euro Zone
Euro-Zone Consumer Confidence
Value
Jul F
(7.90)
(7.90)
1:25 PM Germany
Unemployment change (000's)
Thousands
Jul
(6.00)
(4.00)
Jul 29, 2016
1:25 PM Germany
PMI Manufacturing
Value
Jul F
53.70
6:00 PM
US
GDP Qoq (Annualised)
% Change 2Q A
1.10
2.60
Aug 01, 2016
2:30 PM Euro Zone
Euro-Zone GDP s.a. (QoQ)
% Change 2Q A
0.60
0.30
2:00 PM
UK
PMI Manufacturing
Value
Jul F
49.10
6:30 AM
China
PMI Manufacturing
Value
Jul
50.00
50.00
Aug 03, 2016
1:25 PM Germany
PMI Services
Value
Jul F
54.60
Aug 04, 2016
4:30 PM
UK
BOE Announces rates
% Ratio Aug 4
0.50
Source: Bloomberg, Angel Research
Market Outlook
July 28, 2016
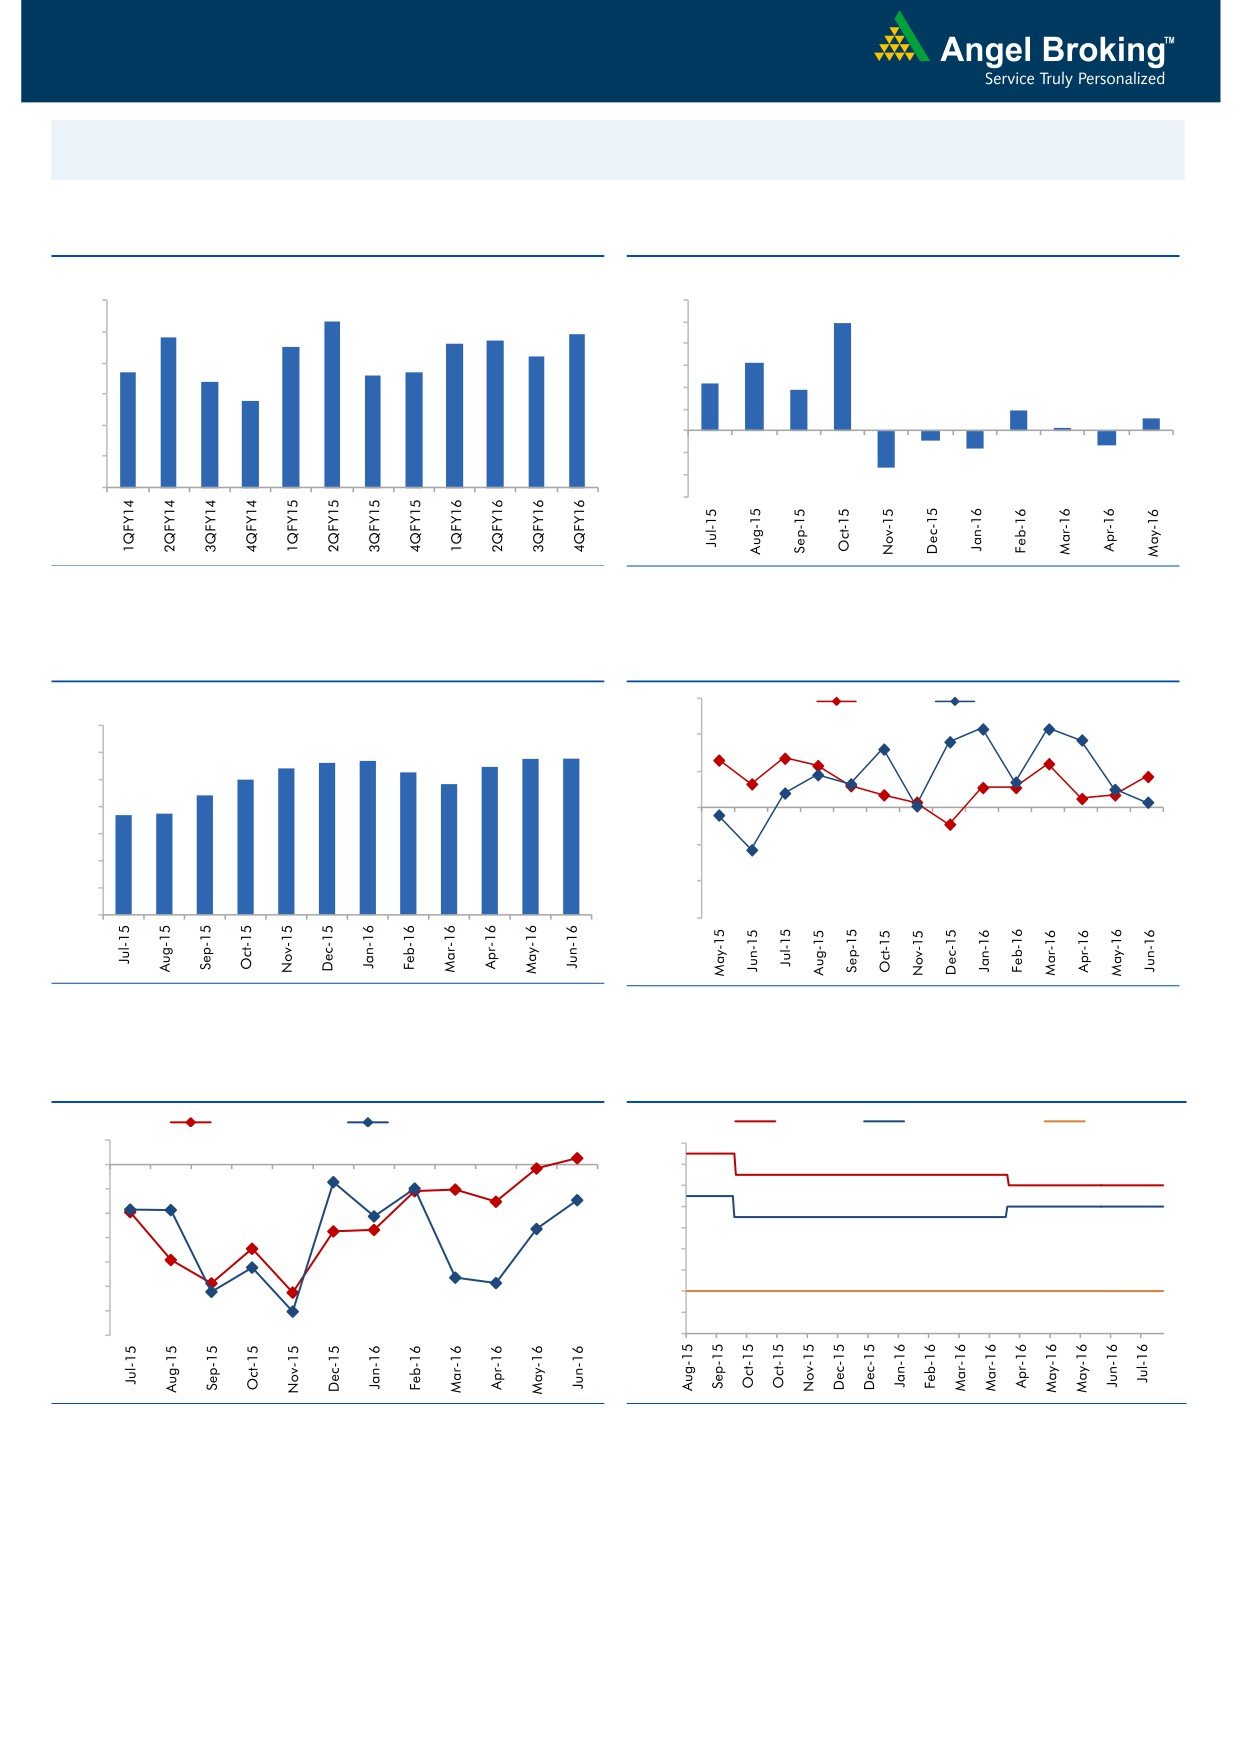
Macro watch
Exhibit 1: Quarterly GDP trends
Exhibit 2: IIP trends
(%)
(%)
9.0
8.3
12.0
9.9
7.8
7.7
7.9
10.0
8.0
7.5
7.6
7.2
8.0
6.3
6.7
6.6
6.7
7.0
6.4
6.0
4.3
3.7
5.8
4.0
6.0
1.9
1.2
2.0
0.3
5.0
-
4.0
(2.0)
(0.9)
(1.3)
(1.6)
(4.0)
3.0
(3.4)
(6.0)
Source: CSO, Angel Research
Source: MOSPI, Angel Research
Exhibit 3: Monthly CPI inflation trends
Exhibit 4: Manufacturing and services PMI
56.0
Mfg. PMI
Services PMI
(%)
7.0
54.0
5.7
5.8
5.8
5.4
5.6
5.5
6.0
5.3
5.0
4.8
52.0
5.0
4.4
3.7
3.7
4.0
50.0
3.0
48.0
2.0
46.0
1.0
-
44.0
Source: MOSPI, Angel Research
Source: Market, Angel Research; Note: Level above 50 indicates expansion
Exhibit 5: Exports and imports growth trends
Exhibit 6: Key policy rates
(%)
Exports yoy growth
Imports yoy growth
(%)
Repo rate
Reverse Repo rate
CRR
5.0
7.50
0.0
7.00
(5.0)
6.50
6.00
(10.0)
5.50
(15.0)
5.00
(20.0)
4.50
(25.0)
4.00
(30.0)
3.50
(35.0)
3.00
Source: Bloomberg, Angel Research
Source: RBI, Angel Research
Market Outlook
July 28, 2016
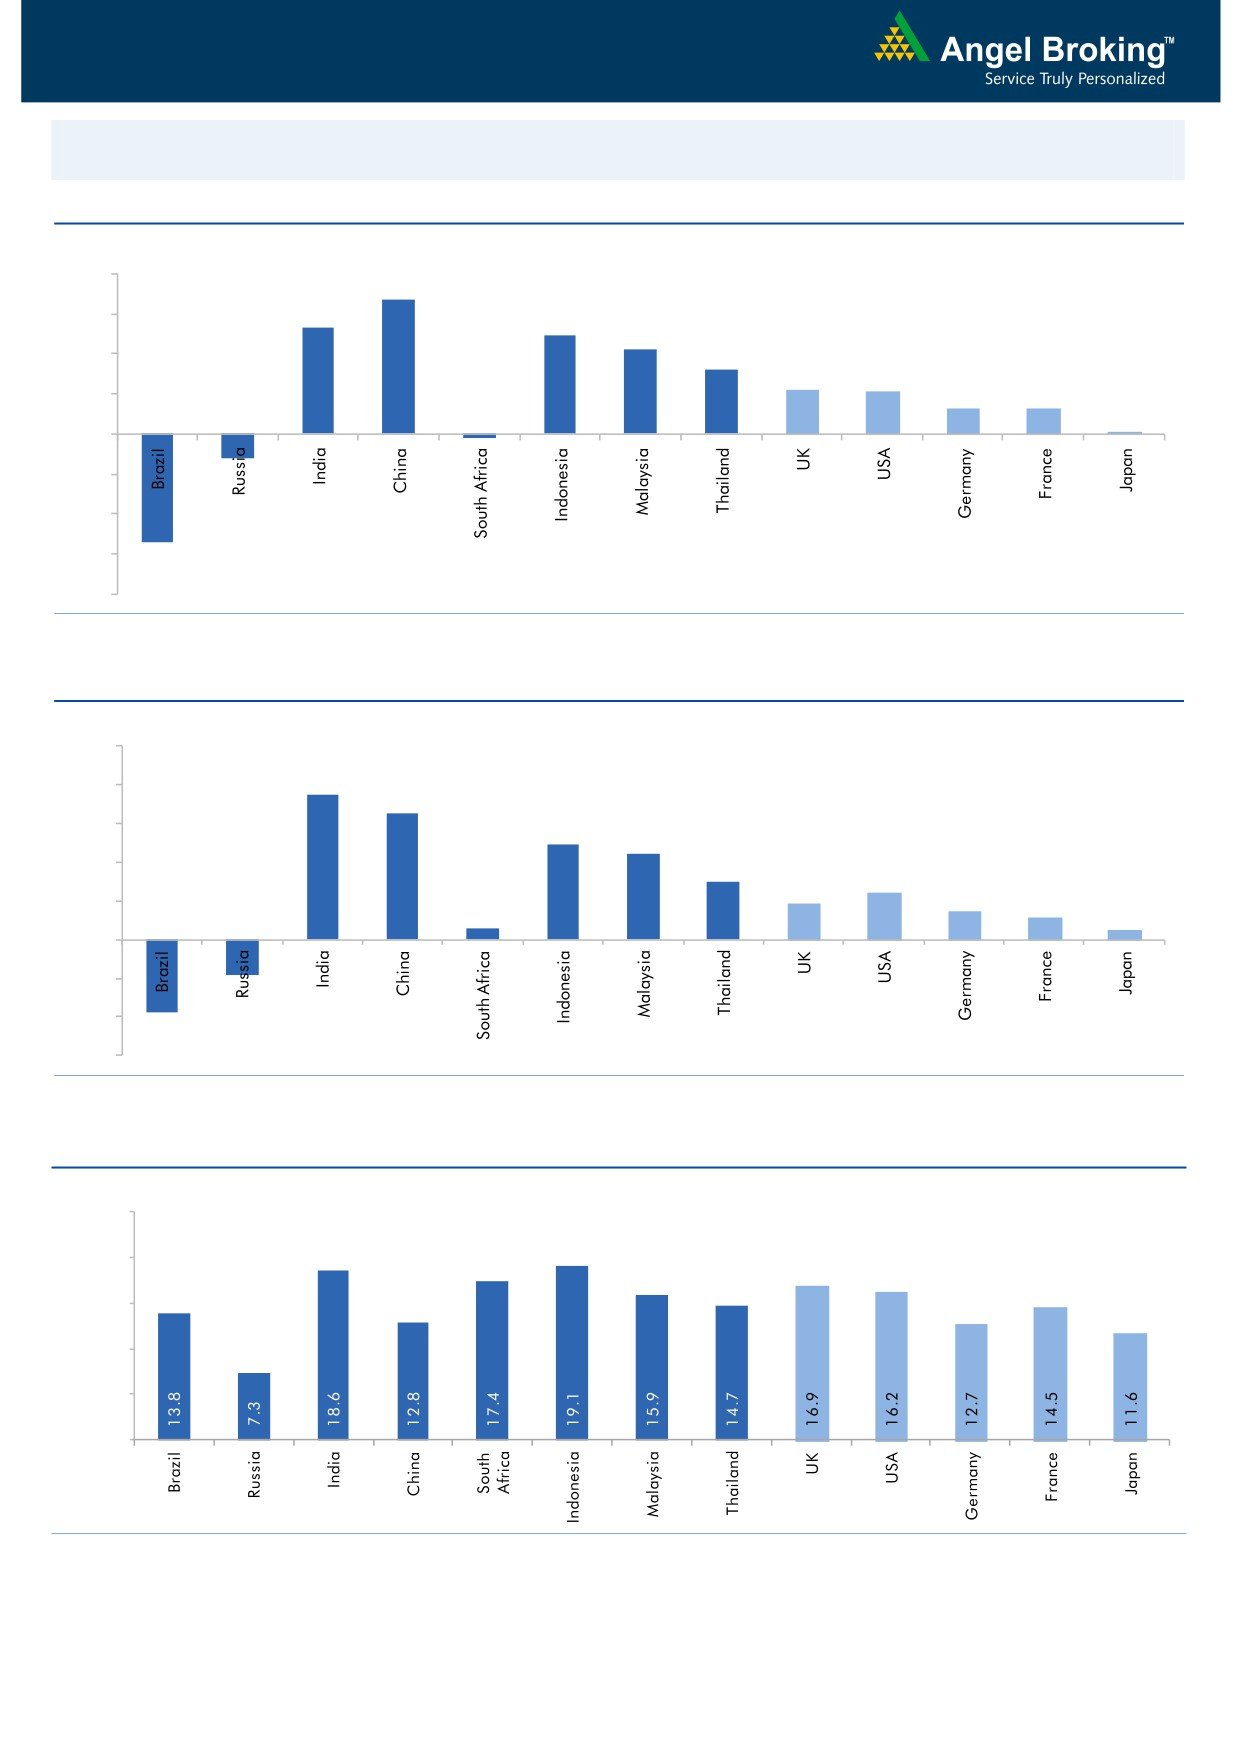
Global watch
Exhibit 1: Latest quarterly GDP Growth (%, yoy) across select developing and developed countries
(%)
8.0
6.7
6.0
5.3
4.9
4.2
4.0
3.2
2.2
2.1
2.0
1.3
1.3
0.1
-
(2.0)
(4.0)
(1.2)
(6.0)
(5.4)
(0.2)
(8.0)
Source: Bloomberg, Angel Research
Exhibit 2: 2016 GDP Growth projection by IMF (%, yoy) across select developing and developed countries
(%)
10.0
7.5
8.0
6.5
6.0
4.9
4.4
4.0
3.0
2.4
1.9
1.5
2.0
1.1
0.6
0.5
(3.8)
(1.8)
-
(2.0)
(4.0)
(6.0)
Source: IMF, Angel Research
Exhibit 3: One year forward P-E ratio across select developing and developed countries
(x)
25.0
20.0
15.0
10.0
5.0
-
Source: IMF, Angel Research
Market Outlook
July 28, 2016
Exhibit 4: Relative performance of indices across globe
Returns (%)
Country
Name of index
Closing price
1M
3M
1YR
Brazil
Bovespa
56,853
15.4
4.4
11.7
Russia
Micex
1,939
5.3
(1.5)
22.3
India
Nifty
8,616
6.5
8.0
1.0
China
Shanghai Composite
2,992
2.4
0.6
(25.3)
South Africa
Top 40
46,874
6.2
0.6
2.4
Mexico
Mexbol
46,812
5.7
2.8
5.3
Indonesia
LQ45
911
9.5
7.8
8.9
Malaysia
KLCI
1,664
1.4
(3.2)
(3.5)
Thailand
SET 50
960
6.4
6.2
(1.7)
USA
Dow Jones
18,472
6.2
2.7
4.1
UK
FTSE
6,750
12.8
7.4
1.2
Japan
Nikkei
16,665
11.5
(4.0)
(19.1)
Germany
DAX
10,320
11.3
0.2
(8.7)
France
CAC
4,447
11.6
(2.4)
(14.4)
Source: Bloomberg, Angel Research
Stock Watch
July 28, 2016
Company Name
Reco
CMP
Target
Mkt Cap
Sales ( Čcr )
OPM(%)
EPS (Č)
PER(x)
P/BV(x)
RoE(%)
EV/Sales(x)
(Č)
Price ( Č)
( Č cr )
FY16E FY17E
FY16E
FY17E
FY16E
FY17E
FY16E
FY17E
FY16E
FY17E
FY16E
FY17E
FY16E
FY17E
Agri / Agri Chemical
Rallis
Neutral
216
-
4,199
1,612
1,911
13.3
13.3
7.4
9.5
29.2
22.7
4.7
4.2
16.7
18.4
2.6
2.2
United Phosphorus
Buy
609
684
26,113
13,083
15,176
18.5
18.5
31.5
37.4
19.3
16.3
3.9
3.2
21.4
21.4
2.0
1.7
Auto & Auto Ancillary
Ashok Leyland
Buy
95
111
26,950
17,995
21,544
11.4
11.6
3.4
4.7
27.9
20.2
4.9
4.5
17.7
22.2
1.4
1.1
Bajaj Auto
Neutral
2,669
-
77,225
22,709
25,860
20.9
20.1
129.0
143.6
20.7
18.6
6.3
5.5
30.7
29.4
3.0
2.6
Bharat Forge
Buy
741
875
17,256
7,351
8,318
19.9
19.7
31.2
36.5
23.8
20.3
4.3
3.6
19.3
19.2
2.4
2.1
Eicher Motors
Neutral
20,340
-
55,245
15,556
16,747
15.5
17.3
464.8
597.5
43.8
34.0
16.0
11.8
36.2
34.3
3.4
3.1
Gabriel India
Neutral
102
-
1,466
1,415
1,544
8.7
9.0
4.6
5.4
22.2
18.9
4.0
3.6
18.1
18.9
1.0
0.9
Hero Motocorp
Neutral
3,204
-
63,970
28,244
30,532
15.5
15.9
156.7
168.5
20.4
19.0
8.2
6.9
39.9
36.4
2.1
1.9
Jamna Auto Industries Neutral
176
-
1,404
1,281
1,473
11.2
11.5
7.6
9.2
23.1
19.1
5.8
4.8
25.4
25.2
1.1
1.0
L G Balakrishnan & Bros Neutral
468
-
734
1,254
1,394
11.6
11.8
35.9
41.7
13.0
11.2
1.8
1.6
13.5
13.8
0.7
0.7
Mahindra and Mahindra Neutral
1,453
-
90,263
38,416
42,904
13.7
13.9
54.8
63.4
26.5
22.9
4.1
3.6
15.4
15.8
2.0
1.8
Maruti
Neutral
4,559
-
137,714
57,865
68,104
16.4
16.7
176.3
225.5
25.9
20.2
5.0
4.3
19.4
21.2
2.1
1.7
Minda Industries
Neutral
1,169
-
1,855
2,523
2,890
8.7
9.0
55.0
65.4
21.3
17.9
4.1
3.3
19.3
18.7
0.8
0.7
Motherson Sumi
Neutral
322
-
42,526
39,343
45,100
8.8
9.1
10.1
12.5
31.8
25.7
10.1
7.9
35.3
34.4
1.1
1.0
Rane Brake Lining
Neutral
607
-
480
454
511
11.5
12.0
25.2
31.0
24.1
19.6
3.6
3.3
14.9
16.6
0.9
0.8
Setco Automotive
Neutral
49
-
650
594
741
12.7
13.7
1.7
3.2
28.6
15.2
3.0
2.6
10.4
16.9
1.5
1.2
Tata Motors
Neutral
510
-
147,276
259,686
273,957
13.0
13.4
25.9
29.5
19.7
17.3
2.6
2.3
8.0
9.0
0.7
0.7
TVS Motor
Accumulate
288
330
13,673
11,263
13,122
6.9
8.5
9.2
15.0
31.3
19.2
7.1
5.7
22.7
29.6
1.3
1.1
Amara Raja Batteries
Buy
895
1,076
15,283
4,690
5,429
17.5
17.5
28.5
35.3
31.5
25.3
7.3
6.0
23.1
25.9
3.2
2.7
Exide Industries
Neutral
178
-
15,122
6,950
7,784
14.4
14.8
6.6
7.3
27.0
24.4
3.4
3.1
12.6
12.8
1.9
1.7
Apollo Tyres
Buy
161
183
8,208
12,056
12,714
17.2
16.4
23.0
20.3
7.0
7.9
1.2
1.1
17.7
13.6
0.7
0.7
Ceat
Buy
880
1,119
3,561
6,041
6,597
14.1
13.7
99.5
111.9
8.9
7.9
1.7
1.5
19.6
18.5
0.7
0.6
JK Tyres
Neutral
91
-
2,057
7,446
7,669
15.2
14.0
19.6
18.4
4.6
4.9
1.2
1.0
25.2
19.5
0.7
0.6
Swaraj Engines
Neutral
1,178
-
1,462
552
630
14.2
14.7
44.6
54.1
26.4
21.8
6.1
5.6
23.2
25.6
2.4
2.1
Subros
Neutral
96
-
575
1,293
1,527
11.8
11.9
4.2
6.7
22.8
14.3
1.7
1.6
7.7
11.5
0.7
0.6
Indag Rubber
Neutral
180
-
473
283
329
17.0
17.2
13.0
15.4
13.9
11.7
3.0
2.5
21.8
21.6
1.5
1.2
Capital Goods
ACE
Neutral
48
-
479
660
839
4.7
8.2
1.0
3.9
48.5
12.4
1.5
1.4
3.2
11.3
0.8
0.6
BEML
Buy
991
1,157
4,127
3,277
4,006
6.0
8.9
36.2
64.3
27.4
15.4
1.9
1.7
5.7
11.7
1.3
1.0
Bharat Electronics
Accumulate
1,219
1,414
29,260
7,295
8,137
20.0
16.8
56.5
58.7
21.6
20.8
3.2
2.9
42.1
44.6
3.3
2.8
Stock Watch
July 28, 2016
Company Name
Reco
CMP
Target
Mkt Cap
Sales ( Čcr )
OPM(%)
EPS (Č)
PER(x)
P/BV(x)
RoE(%)
EV/Sales(x)
(Č)
Price ( Č)
( Č cr )
FY16E
FY17E
FY16E
FY17E
FY16E
FY17E
FY16E
FY17E
FY16E
FY17E
FY16E
FY17E
FY16E
FY17E
Capital Goods
Voltas
Buy
344
407
11,381
5,857
6,511
7.5
7.9
11.7
12.9
29.4
26.7
4.8
4.2
17.1
16.7
1.9
1.7
BGR Energy
Neutral
123
-
887
3,615
3,181
9.5
9.4
16.7
12.4
7.4
9.9
0.7
0.7
10.0
7.0
0.7
0.8
BHEL
Neutral
149
-
36,347
33,722
35,272
10.8
11.7
10.5
14.2
14.1
10.5
1.1
1.0
7.0
9.0
1.1
1.1
Blue Star
Accumulate
466
495
4,444
3,770
4,351
5.7
6.4
11.4
17.2
40.8
27.2
6.3
5.9
18.4
23.1
1.1
1.0
Crompton Greaves
Neutral
77
-
4,801
13,484
14,687
4.9
6.2
4.5
7.1
17.0
10.8
1.2
1.1
7.2
10.8
0.5
0.4
Greaves Cotton
Neutral
145
-
3,534
1,655
1,755
16.6
16.8
7.4
7.8
19.6
18.6
3.9
3.7
21.1
20.6
2.0
1.9
Inox Wind
Buy
224
286
4,977
5,605
6,267
15.7
16.4
24.8
30.0
9.0
7.5
2.5
1.9
25.9
24.4
1.0
0.9
KEC International
Neutral
141
-
3,633
8,791
9,716
6.1
6.8
5.4
8.2
26.2
17.2
2.6
2.4
10.0
14.0
0.6
0.6
Thermax
Neutral
886
-
10,551
6,413
7,525
7.4
8.5
30.5
39.3
29.0
22.5
4.5
3.9
15.0
17.0
1.7
1.4
VATech Wabag
Accumulate
585
681
3,190
3,136
3,845
8.9
9.1
26.0
35.9
22.5
16.3
2.8
2.4
13.4
15.9
1.0
0.8
Cement
ACC
Neutral
1,664
-
31,244
13,151
14,757
16.4
18.3
63.9
83.4
26.0
20.0
3.4
3.1
13.3
16.1
2.1
1.8
Ambuja Cements
Neutral
268
-
41,552
11,564
12,556
19.4
20.7
8.9
10.1
30.1
26.5
3.8
3.6
12.8
13.8
3.1
2.9
HeidelbergCement
Neutral
123
-
2,777
1,772
1,926
13.3
15.4
1.0
3.0
122.6
40.9
3.1
2.9
2.6
7.9
2.1
1.8
India Cements
Neutral
116
-
3,560
4,216
4,840
18.0
19.5
4.0
9.9
29.0
11.7
1.2
1.1
4.0
9.5
1.2
0.9
JK Cement
Neutral
700
-
4,894
3,661
4,742
10.1
15.8
7.5
28.5
93.3
24.6
2.8
2.5
7.5
22.9
1.8
1.4
J K Lakshmi Cement
Neutral
422
-
4,963
2,947
3,616
16.7
19.9
11.5
27.2
36.7
15.5
3.5
3.0
9.8
20.8
2.0
1.6
Mangalam Cements
Neutral
296
-
789
1,053
1,347
10.5
13.3
8.4
26.0
35.2
11.4
1.5
1.4
4.3
12.5
1.2
0.9
Orient Cement
Neutral
167
-
3,414
1,854
2,524
21.2
22.2
7.7
11.1
21.6
15.0
3.1
2.7
13.3
15.7
2.7
1.9
Ramco Cements
Neutral
556
-
13,231
4,036
4,545
20.8
21.3
15.1
18.8
36.8
29.6
4.5
4.0
12.9
14.3
3.8
3.3
Shree Cement^
Neutral
15,925
-
55,478
7,150
8,742
26.7
28.6
228.0
345.5
69.8
46.1
10.3
8.6
15.7
20.3
7.4
6.0
UltraTech Cement
Neutral
3,649
-
100,136
24,669
29,265
18.2
20.6
82.0
120.0
44.5
30.4
4.8
4.2
11.3
14.7
4.0
3.4
Construction
ITNL
Accumulate
77
93
2,533
7,360
8,682
34.0
32.2
7.0
8.6
11.0
9.0
0.4
0.4
3.2
2.5
3.7
3.6
KNR Constructions
Accumulate
576
603
1,619
937
1,470
14.3
14.0
44.2
38.6
13.0
14.9
2.6
2.3
15.4
15.4
1.8
1.2
Larsen & Toubro
Accumulate
1,601
1,700
149,233
58,870
65,708
8.3
10.3
42.0
53.0
38.1
30.2
2.6
2.4
8.8
11.2
2.7
2.5
Gujarat Pipavav Port
Neutral
180
-
8,709
629
684
51.0
52.2
6.4
5.9
28.2
30.5
3.7
3.4
15.9
12.7
13.5
12.2
MBL Infrastructures
Buy
135
285
561
2,313
2,797
12.2
14.6
19.0
20.0
7.1
6.8
0.7
0.7
11.3
10.6
1.0
0.9
Nagarjuna Const.
Neutral
81
-
4,478
7,892
8,842
8.8
9.1
3.0
5.3
26.9
15.2
1.3
1.2
5.0
8.5
0.8
0.7
PNC Infratech
Accumulate
557
647
2,859
1,873
2,288
13.2
13.5
24.0
32.0
23.2
17.4
2.3
2.0
12.1
12.3
1.7
1.4
Simplex Infra
Neutral
306
-
1,516
5,955
6,829
10.3
10.5
16.0
31.0
19.2
9.9
1.0
0.9
5.3
9.9
0.8
0.6
Stock Watch
July 28, 2016
Company Name
Reco
CMP
Target
Mkt Cap
Sales ( Čcr )
OPM(%)
EPS (Č)
PER(x)
P/BV(x)
RoE(%)
EV/Sales(x)
(Č)
Price ( Č)
( Č cr )
FY16E
FY17E
FY16E
FY17E
FY16E
FY17E
FY16E
FY17E
FY16E
FY17E
FY16E
FY17E
FY16E
FY17E
Construction
Power Mech Projects
Neutral
555
-
817
1,539
1,801
12.8
12.7
59.0
72.1
9.4
7.7
1.4
1.2
18.6
16.8
0.5
0.5
Sadbhav Engineering
Neutral
291
-
4,995
3,186
3,598
10.2
10.3
8.0
9.0
36.4
32.4
3.4
3.0
9.4
9.9
1.9
1.7
NBCC
Neutral
247
-
14,814
5,838
7,428
6.0
7.9
5.2
8.2
47.5
30.1
1.5
1.2
21.9
28.2
2.3
1.7
MEP Infra
Neutral
45
-
724
1,956
1,876
28.1
30.5
1.3
3.0
34.3
14.9
7.2
4.8
21.2
32.8
1.8
1.8
SIPL
Neutral
99
-
3,503
675
1,042
62.4
64.7
-
-
3.7
4.3
-
-
16.9
11.4
Engineers India
Neutral
228
-
7,694
1,667
1,725
13.5
16.0
9.7
11.4
23.5
20.0
2.8
2.7
11.7
13.4
3.0
3.0
Financials
Allahabad Bank
Neutral
78
-
5,651
8,569
9,392
2.8
2.9
16.3
27.5
4.8
2.8
0.5
0.4
7.6
11.9
-
-
Axis Bank
Neutral
549
-
130,949
26,204
29,738
3.6
3.5
34.5
35.4
15.9
15.5
2.5
2.2
16.8
14.9
-
-
Bank of Baroda
Neutral
155
-
35,645
18,802
21,088
2.0
2.2
(7.4)
13.0
11.9
1.2
1.0
(4.2)
7.3
-
-
Bank of India
Neutral
112
-
10,485
15,972
17,271
1.9
2.0
15.3
33.4
7.3
3.4
0.3
0.3
3.6
7.6
-
-
Canara Bank
Neutral
261
-
14,180
15,441
16,945
2.0
2.1
46.6
70.4
5.6
3.7
0.5
0.4
8.0
11.2
-
-
Dena Bank
Neutral
39
-
2,608
3,440
3,840
2.1
2.3
7.3
10.0
5.4
3.9
0.4
0.3
6.1
7.9
-
-
Dewan Housing Finance Buy
222
270
6,471
1,828
2,225
2.9
3.0
24.9
29.7
8.9
7.5
1.4
1.2
15.1
16.1
-
-
Equitas Holdings
Buy
194
235
6,505
679
1,076
12.4
11.7
6.2
6.7
31.3
29.0
3.9
2.8
13.3
12.5
-
-
Federal Bank
Neutral
65
-
11,168
3,279
3,787
2.8
2.9
3.9
5.5
16.5
11.8
1.3
1.2
8.4
10.8
-
-
HDFC
Neutral
1,388
-
219,406
10,358
11,852
3.3
3.3
41.1
47.0
33.8
29.5
6.4
5.8
24.7
24.9
-
-
HDFC Bank
Neutral
1,237
-
313,164
38,606
47,696
4.4
4.5
48.8
61.4
25.4
20.2
4.3
3.7
18.7
20.0
-
-
ICICI Bank
Neutral
270
-
156,999
34,279
39,262
3.3
3.3
21.0
24.4
12.9
11.1
2.2
1.8
14.4
14.7
-
-
IDBI Bank
Neutral
72
-
14,834
9,625
10,455
1.8
1.8
8.5
14.2
8.5
5.1
0.5
0.5
5.9
9.3
-
-
Indian Bank
Neutral
153
-
7,336
6,160
6,858
2.5
2.5
24.5
29.8
6.2
5.1
0.5
0.4
7.7
8.6
-
-
LIC Housing Finance
Accumulate
518
592
26,126
3,179
3,758
2.6
2.6
32.9
40.6
15.7
12.7
2.9
2.5
19.6
20.7
-
-
Oriental Bank
Neutral
117
-
4,052
7,643
8,373
2.4
2.4
37.2
45.4
3.1
2.6
0.3
0.3
8.2
9.4
-
-
Punjab Natl.Bank
Neutral
133
-
26,067
23,122
26,022
2.8
2.8
7.0
21.6
19.0
6.2
1.0
0.9
3.4
10.0
-
-
South Ind.Bank
Neutral
21
-
2,890
1,965
2,185
2.5
2.5
2.5
3.3
8.6
6.5
0.9
0.8
9.5
11.7
-
-
St Bk of India
Neutral
229
-
177,496
79,958
86,061
2.6
2.6
13.4
20.7
17.1
11.1
1.4
1.3
11.5
12.8
-
-
Union Bank
Neutral
131
-
8,975
12,646
14,129
2.3
2.4
31.0
39.1
4.2
3.3
0.5
0.4
9.8
11.4
-
-
Vijaya Bank
Neutral
42
-
4,230
3,536
3,827
1.9
1.9
5.5
6.7
7.7
6.4
0.6
0.6
7.8
8.8
-
-
Yes Bank
Neutral
1,200
-
50,524
7,190
9,011
3.2
3.3
58.2
69.7
20.6
17.2
3.7
3.1
19.2
19.6
-
-
FMCG
Asian Paints
Neutral
1,062
-
101,848
15,534
17,445
17.7
16.8
18.4
19.6
57.8
54.2
20.4
19.3
34.6
35.6
6.2
5.5
Stock Watch
July 28, 2016
Company Name
Reco
CMP
Target
Mkt Cap
Sales ( Čcr )
OPM(%)
EPS (Č)
PER(x)
P/BV(x)
RoE(%)
EV/Sales(x)
(Č)
Price ( Č)
( Č cr )
FY16E FY17E
FY16E
FY17E
FY16E
FY17E
FY16E
FY17E
FY16E
FY17E
FY16E
FY17E
FY16E
FY17E
FMCG
Britannia
Neutral
2,805
-
33,657
8,481
9,795
14.0
14.1
65.5
78.3
42.8
35.8
20.3
16.6
38.3
41.2
3.9
3.4
Colgate
Neutral
945
-
25,692
4,136
4,632
22.5
23.3
22.2
25.3
42.6
37.3
25.9
23.0
68.6
67.5
6.0
5.3
Dabur India
Neutral
308
-
54,094
9,370
10,265
17.6
17.3
7.3
8.1
41.9
38.0
10.9
10.0
31.7
30.6
5.7
5.2
GlaxoSmith Con*
Neutral
6,284
-
26,426
4,519
5,142
19.6
19.8
164.3
191.2
38.3
32.9
10.6
9.0
30.8
29.9
5.3
4.6
Godrej Consumer
Neutral
1,614
-
54,954
9,003
10,335
18.1
18.7
34.1
41.8
47.3
38.6
10.2
8.8
23.9
24.8
6.2
5.4
HUL
Neutral
904
-
195,550
33,299
35,497
17.1
17.1
18.9
20.0
47.8
45.2
41.9
36.5
87.6
80.8
5.9
5.5
ITC
Neutral
248
-
299,054
36,837
39,726
38.8
38.7
8.2
9.0
30.4
27.6
8.5
7.4
27.8
26.9
7.6
7.1
Marico
Neutral
278
-
35,905
6,151
6,966
17.2
17.3
5.4
6.4
51.5
43.5
16.2
12.8
33.2
32.4
5.7
5.1
Nestle*
Neutral
7,053
-
68,002
9,393
10,507
22.2
22.3
106.8
121.8
66.0
57.9
23.2
20.9
34.8
36.7
6.6
5.9
Tata Global
Neutral
137
-
8,675
8,635
9,072
9.8
9.9
5.8
7.2
23.7
19.1
2.1
2.0
6.8
7.4
1.0
0.9
Procter & Gamble
Buy
6,297
7,369
20,442
2,588
2,939
23.3
23.2
130.2
146.2
48.4
43.1
96.4
92.5
27.6
25.3
7.5
6.5
Hygiene
IT
HCL Tech^
Buy
754
1,000
106,315
37,061
30,781
21.5
20.5
51.4
40.0
14.7
18.8
3.8
2.8
20.1
20.3
2.5
2.6
Infosys
Buy
1,088
1,374
249,804
62,441
70,558
27.5
27.5
59.0
65.3
18.4
16.7
3.7
3.4
22.2
22.4
3.4
2.9
TCS
Buy
2,576
3,004
507,602
108,646
122,770
28.3
28.3
123.7
141.0
20.8
18.3
6.9
6.3
33.1
34.6
4.0
3.4
Tech Mahindra
Buy
504
700
48,958
26,494
30,347
16.3
17.0
32.2
37.5
15.7
13.5
3.4
2.9
21.7
21.8
1.6
1.3
Wipro
Buy
549
680
135,543
50,808
56,189
23.7
23.8
37.3
40.7
14.7
13.5
2.8
2.6
19.2
17.7
2.2
1.8
Media
D B Corp
Neutral
405
-
7,434
2,025
2,187
27.4
27.4
17.4
18.9
23.2
21.5
5.2
4.8
22.9
23.7
3.5
3.2
HT Media
Neutral
81
-
1,889
2,495
2,673
12.9
13.2
6.8
7.2
11.9
11.3
0.9
0.9
7.5
7.8
0.3
0.3
Jagran Prakashan
Accumulate
181
205
5,915
2,107
2,355
33.5
28.0
10.1
10.8
18.0
16.8
4.2
3.6
23.3
21.7
2.9
2.5
Sun TV Network
Neutral
431
-
16,993
2,510
2,763
71.8
71.5
21.9
24.8
19.7
17.4
4.7
4.2
22.8
24.3
5.6
5.1
Hindustan Media
Neutral
273
-
2,007
914
1,016
21.7
21.5
21.9
23.3
12.5
11.8
2.3
1.9
18.0
16.2
1.6
1.4
Ventures
Metals & Mining
Coal India
Buy
326
380
206,198
76,167
84,130
19.9
22.3
22.4
25.8
14.6
12.6
5.3
5.1
35.5
41.0
2.0
1.8
Hind. Zinc
Neutral
207
-
87,506
14,641
14,026
50.4
50.4
17.7
16.0
11.7
12.9
1.8
1.6
16.2
13.2
3.3
3.2
Hindalco
Neutral
133
-
27,526
104,356
111,186
8.7
9.5
6.7
11.1
19.8
12.1
0.7
0.7
3.5
5.9
0.8
0.7
JSW Steel
Neutral
1,738
-
42,019
42,308
45,147
16.4
20.7
(10.3)
49.5
35.1
1.9
1.9
(1.0)
5.6
2.0
1.8
NMDC
Neutral
100
-
39,766
8,237
10,893
46.6
44.5
10.0
11.7
10.1
8.6
1.1
1.0
12.5
13.0
4.4
3.3
SAIL
Neutral
49
-
20,114
45,915
53,954
7.2
10.5
1.5
4.4
32.3
11.1
0.5
0.5
2.3
4.1
1.1
1.0
Vedanta
Neutral
168
-
49,940
71,445
81,910
26.2
26.3
12.9
19.2
13.1
8.8
0.9
0.8
7.2
8.9
1.1
0.9
Tata Steel
Neutral
363
-
35,245
126,760
137,307
8.9
11.3
6.4
23.1
57.0
15.7
1.1
1.1
2.0
7.1
0.9
0.8
Stock Watch
July 28, 2016
Company Name
Reco
CMP
Target
Mkt Cap
Sales ( Čcr )
OPM(%)
EPS (Č)
PER(x)
P/BV(x)
RoE(%)
EV/Sales(x)
(Č)
Price ( Č)
( Č cr )
FY16E FY17E
FY16E
FY17E
FY16E
FY17E
FY16E
FY17E
FY16E
FY17E
FY16E
FY17E
FY16E
FY17E
Oil & Gas
Cairn India
Neutral
194
-
36,382
11,323
12,490
49.4
51.0
20.7
20.7
9.4
9.4
0.6
0.6
6.4
6.1
1.9
1.2
GAIL
Neutral
385
-
48,811
64,856
70,933
9.1
9.6
24.0
28.9
16.1
13.3
1.4
1.3
8.8
9.6
1.0
0.9
ONGC
Neutral
223
-
190,745
154,564
145,998
36.8
37.4
20.8
22.6
10.7
9.9
1.0
1.0
10.1
9.7
1.5
1.6
Petronet LNG
Neutral
298
-
22,361
29,691
31,188
5.8
6.2
12.8
13.4
23.3
22.2
3.5
3.1
15.8
14.8
0.8
0.8
Indian Oil Corp
Neutral
536
-
130,126
359,607
402,760
5.9
6.1
42.5
48.7
12.6
11.0
1.7
1.5
14.1
14.4
0.4
0.4
Reliance Industries
Neutral
1,013
-
328,476
304,775
344,392
12.6
13.4
91.3
102.6
11.1
9.9
1.3
1.1
11.8
12.0
1.0
0.8
Pharmaceuticals
Alembic Pharma
Neutral
601
-
11,338
3,145
3,483
31.9
16.2
38.2
18.7
15.7
32.2
7.1
6.0
57.9
20.1
3.4
3.1
Aurobindo Pharma
Buy
794
880
46,433
13,651
15,702
21.7
21.7
33.9
38.4
23.4
20.7
6.6
5.1
32.5
27.7
3.5
3.1
Aventis*
Accumulate
4,575
4,738
10,537
2,049
2,375
15.4
17.3
115.4
153.5
39.7
29.8
6.5
5.1
19.3
25.8
4.8
4.0
Cadila Healthcare
Accumulate
358
400
36,619
9,469
11,246
21.2
22.0
14.9
17.1
24.0
20.9
6.8
5.4
28.8
26.6
3.9
3.3
Cipla
Neutral
524
-
42,067
13,372
15,378
16.4
17.4
18.8
21.6
27.9
24.2
3.5
3.1
13.3
13.7
3.1
3.0
Dr Reddy's
Neutral
2,988
-
50,964
15,471
17,479
24.6
24.6
138.2
152.4
21.6
19.6
4.0
3.4
19.7
18.7
3.9
3.5
Dishman Pharma
Neutral
147
-
2,371
1,733
1,906
21.5
21.5
10.1
10.0
14.5
14.7
1.7
1.5
10.5
11.2
1.8
1.5
GSK Pharma*
Neutral
3,378
-
28,609
2,741
3,528
16.5
18.9
44.2
60.1
76.4
56.2
16.9
16.7
21.2
29.9
10.3
8.1
Indoco Remedies
Neutral
315
-
2,903
977
1,112
14.9
18.2
9.0
13.2
35.0
23.9
5.0
4.2
15.1
19.2
2.9
2.6
Ipca labs
Buy
492
613
6,203
2,844
3,799
10.6
15.3
10.6
17.3
46.4
28.4
2.7
2.5
5.9
9.1
2.2
1.7
Lupin
Accumulate
1,719
1,809
77,495
13,702
15,912
23.7
26.4
50.5
58.1
34.0
29.6
7.0
5.8
22.9
21.4
6.0
4.8
Sun Pharma
Buy
808
944
194,401
27,744
31,129
26.0
30.0
22.0
28.0
36.7
28.9
5.3
4.4
18.3
18.7
6.5
5.6
Power
Tata Power
Neutral
71
-
19,216
35,923
37,402
22.6
22.8
4.1
5.2
17.5
13.8
1.3
1.3
7.5
9.3
1.5
1.4
NTPC
Neutral
159
-
131,103
87,271
99,297
23.5
23.5
11.8
13.3
13.5
12.0
1.5
1.4
11.5
12.2
2.5
2.2
Power Grid
Neutral
172
-
90,062
20,702
23,361
86.7
86.4
12.1
13.2
14.3
13.0
2.1
1.9
15.6
15.1
9.1
8.4
Real Estate
MLIFE
Buy
459
554
1,884
826
1,011
20.1
21.9
22.7
30.7
20.2
15.0
1.2
1.1
6.0
7.4
4.2
3.2
Telecom
Bharti Airtel
Neutral
373
-
148,923
101,748
109,191
32.1
31.7
12.0
12.5
31.1
29.8
2.1
2.0
6.9
6.7
2.1
1.9
Idea Cellular
Neutral
106
-
38,295
34,282
36,941
32.0
31.5
5.9
6.2
18.0
17.2
1.7
1.5
9.9
9.3
1.7
1.7
zOthers
Abbott India
Neutral
4,682
-
9,949
2,715
3,153
14.5
14.1
134.3
152.2
34.9
30.8
8.7
7.2
27.4
25.6
3.4
2.9
Bajaj Electricals
Accumulate
241
268
2,433
4,612
5,351
5.6
5.7
9.5
12.4
25.4
19.5
3.2
2.8
12.5
14.4
0.5
0.4
Finolex Cables
Neutral
392
-
6,002
2,520
2,883
12.2
12.0
12.7
14.2
31.0
27.6
4.2
3.7
13.6
13.5
2.0
1.7
Goodyear India*
Buy
527
631
1,216
1,750
1,598
11.3
10.4
53.7
49.4
9.8
10.7
2.1
1.8
23.0
18.2
0.5
0.4
Hitachi
Neutral
1,473
-
4,005
1,779
2,081
7.8
8.8
21.8
33.4
67.6
44.1
10.9
8.8
17.4
22.1
2.2
1.8
Stock Watch
July 28, 2016
Company Name
Reco
CMP
Target
Mkt Cap
Sales ( Čcr )
OPM(%)
EPS (Č)
PER(x)
P/BV(x)
RoE(%)
EV/Sales(x)
(Č)
Price ( Č)
( Č cr )
FY16E
FY17E
FY16E
FY17E
FY16E
FY17E
FY16E
FY17E
FY16E
FY17E
FY16E
FY17E
FY16E
FY17E
zOthers
Jyothy Laboratories
Neutral
289
-
5,226
1,620
1,847
11.5
11.5
7.3
8.5
39.6
34.1
5.1
4.7
13.3
14.4
3.1
2.7
MRF
Buy
34,016
45,575
14,427
20,316
14,488
21.4
21.1
5,488.0
3,798.0
6.2
9.0
2.1
1.7
41.1
21.2
0.7
0.9
Page Industries
Neutral
13,458
-
15,011
1,929
2,450
19.8
20.1
229.9
299.0
58.5
45.0
25.8
18.0
52.1
47.1
7.8
6.1
Relaxo Footwears
Neutral
494
-
5,934
1,767
2,152
12.3
12.5
19.3
25.1
25.7
19.7
6.3
4.8
27.7
27.8
3.3
2.7
Siyaram Silk Mills
Buy
1,043
1,347
978
1,619
1,799
11.6
11.6
93.5
104.9
11.2
9.9
1.9
1.6
17.1
16.4
0.9
0.8
Styrolution ABS India* Neutral
623
-
1,095
1,271
1,440
8.6
9.2
32.0
41.1
19.4
15.2
2.0
1.8
10.7
12.4
0.9
0.7
TVS Srichakra
Buy
2,393
2,932
1,832
2,035
2,252
15.9
15.3
248.6
268.1
9.6
8.9
4.2
3.0
43.6
33.9
0.9
0.8
HSIL
Neutral
315
-
2,276
2,123
2,384
16.1
16.5
15.0
18.9
20.9
16.7
1.6
1.5
8.0
9.4
1.4
1.2
Kirloskar Engines India
Neutral
275
-
3,977
2,403
2,554
8.6
9.9
9.2
10.5
29.9
26.2
2.9
2.7
9.7
10.7
1.2
1.1
Ltd
M M Forgings
Buy
419
546
506
511
615
21.7
21.6
43.1
55.8
9.7
7.5
1.8
1.5
19.9
21.2
1.2
0.9
Banco Products (India) Neutral
171
-
1,222
1,208
1,353
11.0
12.3
10.8
14.5
15.9
11.8
1.8
1.6
11.9
14.5
0.9
0.7
Competent Automobiles Neutral
157
-
97
1,040
1,137
3.2
3.1
25.7
28.0
6.1
5.6
0.9
0.8
15.0
14.3
0.1
0.1
Nilkamal
Neutral
1,290
-
1,925
1,871
2,031
10.7
10.5
63.2
69.8
20.4
18.5
3.3
2.9
17.6
16.6
1.0
0.9
Visaka Industries
Neutral
166
-
263
1,020
1,120
8.7
9.1
13.9
20.1
11.9
8.2
0.8
0.7
6.4
8.7
0.5
0.4
Transport Corporation of
Neutral
348
-
2,668
2,830
3,350
8.8
9.0
14.4
18.3
24.3
19.0
3.7
3.3
15.4
17.1
1.1
1.0
India
Elecon Engineering
Neutral
60
-
651
1,359
1,482
10.3
13.7
0.8
3.9
74.5
15.4
1.2
1.2
1.6
7.8
0.9
0.8
Surya Roshni
Buy
165
201
722
2,992
3,223
8.1
8.4
14.7
18.3
11.2
9.0
1.1
0.9
9.7
11.0
0.5
0.5
MT Educare
Neutral
155
-
615
286
366
18.3
17.7
7.7
9.4
20.0
16.5
4.2
3.7
20.2
21.1
2.1
1.6
Radico Khaitan
Buy
93
125
1,235
1,543
1,659
12.6
13.0
5.8
6.3
16.1
14.7
1.4
1.3
8.5
8.6
1.3
1.2
Garware Wall Ropes
Accumulate
454
460
994
828
898
11.2
10.3
28.3
29.0
16.1
15.7
2.7
2.3
16.8
14.9
1.0
0.9
Wonderla Holidays
Neutral
408
-
2,304
206
308
44.0
43.6
9.0
12.9
45.3
31.6
6.2
5.6
13.7
17.8
10.7
7.1
Linc Pen & Plastics
Neutral
277
-
410
344
382
9.1
9.1
12.4
13.1
22.4
21.2
4.0
3.5
18.0
16.7
1.2
1.1
The Byke Hospitality
Neutral
164
-
656
222
287
20.5
20.5
5.6
7.6
29.0
21.7
5.5
4.5
18.9
20.8
3.0
2.3
Interglobe Aviation
Neutral
949
-
34,180
17,022
21,122
20.7
14.5
63.9
53.7
14.8
17.7
22.2
18.2
149.9
103.2
2.1
1.7
Coffee Day Enterprises
Neutral
245
-
5,055
2,692
2,964
17.0
18.6
-
4.7
-
51.8
3.0
2.8
0.2
5.5
2.2
2.1
Ltd
Navneet Education
Neutral
97
-
2,305
998
1,062
24.1
24.0
5.8
6.1
16.8
15.9
3.7
3.3
22.0
20.6
2.4
2.3
Navkar Corporation
Buy
209
265
2,985
347
408
43.2
42.9
6.7
6.8
31.4
30.9
2.3
2.1
7.3
6.9
9.2
8.3
UFO Moviez
Neutral
585
-
1,615
558
619
32.0
33.2
22.5
30.0
26.0
19.5
3.1
2.7
12.0
13.8
2.6
2.2
VRL Logistics
Neutral
348
-
3,175
1,725
1,902
16.5
16.7
12.2
14.6
28.6
23.9
6.0
5.2
20.8
21.9
1.8
1.6
Stock Watch
July 28, 2016
Company Name
Reco
CMP
Target Mkt Cap
Sales ( Čcr )
OPM(%)
EPS (Č)
PER(x)
P/BV(x)
RoE(%)
EV/Sales(x)
(Č)
Price ( Č)
( Č cr )
FY16E FY17E FY16E FY17E FY16E FY17E FY16E FY17E FY16E FY17E FY16E FY17E FY16E FY17E
zOthers
Team Lease Serv.
Neutral
1,051
-
1,797
2,565
3,229
1.3
1.5
15.2
22.8
69.2
46.2
5.5
4.9
8.0
10.7
0.6
0.4
S H Kelkar & Co.
Neutral
246
-
3,553
928
1,036
15.3
15.1
4.9
6.1
49.8
40.2
4.7
4.3
9.4
10.7
3.4
3.0
Quick Heal
Neutral
271
-
1,900
339
408
27.8
27.3
7.1
7.7
38.4
35.0
3.2
3.3
8.5
9.3
4.6
3.9
Narayana Hrudaya
Neutral
287
-
5,873
1,603
1,873
10.9
11.5
1.0
2.6
301.7
108.7
7.3
6.7
2.4
6.1
3.8
3.3
Manpasand Bever.
Neutral
660
-
3,305
540
836
19.9
19.6
10.2
16.9
64.5
39.1
5.2
4.7
8.1
12.0
5.9
3.8
Parag Milk Foods
Neutral
319
-
2,687
1,645
1,919
9.0
9.3
6.7
9.5
47.5
33.8
6.2
5.3
13.1
15.5
1.9
1.6
Source: Company, Angel Research; Note: *December year end; #September year end; &October year end; Price as on July 27, 2016
Market Outlook
July 28, 2016
Research Team Tel: 022 - 39357800
DISCLAIMER
Angel Broking Private Limited (hereinafter referred to as “Angel”) is a registered Member of National Stock Exchange of India Limited,
Bombay Stock Exchange Limited and Metropolitan Stock Exchange Limited. It is also registered as a Depository Participant with CDSL
and Portfolio Manager with SEBI. It also has registration with AMFI as a Mutual Fund Distributor. Angel Broking Private Limited is a
registered entity with SEBI for Research Analyst in terms of SEBI (Research Analyst) Regulations, 2014 vide registration number
INH000000164. Angel or its associates has not been debarred/ suspended by SEBI or any other regulatory authority for accessing
/dealing in securities Market. Angel or its associates/analyst has not received any compensation / managed or co-managed public
offering of securities of the company covered by Analyst during the past twelve months.
This document is solely for the personal information of the recipient, and must not be singularly used as the basis of any investment
decision. Nothing in this document should be construed as investment or financial advice. Each recipient of this document should make
such investigations as they deem necessary to arrive at an independent evaluation of an investment in the securities of the companies
referred to in this document (including the merits and risks involved), and should consult their own advisors to determine the merits and
risks of such an investment.
Reports based on technical and derivative analysis center on studying charts of a stock's price movement, outstanding positions and
trading volume, as opposed to focusing on a company's fundamentals and, as such, may not match with a report on a company's
fundamentals. Investors are advised to refer the Fundamental and Technical Research Reports available on our website to evaluate the
contrary view, if any.
The information in this document has been printed on the basis of publicly available information, internal data and other reliable
sources believed to be true, but we do not represent that it is accurate or complete and it should not be relied on as such, as this
document is for general guidance only. Angel Broking Pvt. Limited or any of its affiliates/ group companies shall not be in any way
responsible for any loss or damage that may arise to any person from any inadvertent error in the information contained in this report.
Angel Broking Pvt. Limited has not independently verified all the information contained within this document. Accordingly, we cannot
testify, nor make any representation or warranty, express or implied, to the accuracy, contents or data contained within this document.
While Angel Broking Pvt. Limited endeavors to update on a reasonable basis the information discussed in this material, there may be
regulatory, compliance, or other reasons that prevent us from doing so.
This document is being supplied to you solely for your information, and its contents, information or data may not be reproduced,
redistributed or passed on, directly or indirectly.
Neither Angel Broking Pvt. Limited, nor its directors, employees or affiliates shall be liable for any loss or damage that may arise from
or in connection with the use of this information.