Market Outlook
July 28, 2015
Dealer’s Diary
Domestic Indices
Chg (%)
(Pts)
(Close)
Indian markets are expected to open in red tracking SGX Nifty.
BSE Sensex
(2.0)
(551)
27,561
US markets closed down on Monday under pressure from an 8.5% overnight plunge
Nifty
(1.9)
(161)
8,361
in Shangai composite, on fears that Chinese government may pull back the support
MID CAP
(1.4)
(154)
10,994
measures that stabilized the markets for last 3 weeks. Correction was led by
SMALL CAP
(1.1)
(125)
11,543
Materials and Energy companies, which were impacted due to fall in Oil & Metal
BSE HC
(1.1)
(189)
16,648
prices.
BSE PSU
(1.9)
(145)
7,595
BANKEX
(2.3)
(487)
20,887
FTSE 100 fell on Monday, weighed down by fall in Pearson and commodity stocks,
AUTO
(1.9)
(363)
18,590
which pushed the market towards 6 month lows.
METAL
(2.3)
(201)
8,571
Markets continued their downward trend falling nearly 2% on poor global cues and
OIL & GAS
(1.9)
(193)
9,962
concerns emerging over tighter norms on P-notes. Correction was seen across
BSE IT
(1.2)
(128)
10,877
sectors, with Banking and Metal stocks witnessing maximum correction.
Global Indices
Chg (%)
(Pts)
(Close)
Dow Jones
(0.7)
(128)
17,441
News & Result Analysis
NASDAQ
(1.0)
(49)
5,040
Garware Wall Ropes- CMP: `315 Target Price: `390 - BUY (Upside: 24%)
FTSE
(1.1)
(75)
6,505
Result Review: Tech Mahindra, Ambuja, Subros, MRF
Result Preview: Maruti Suzuki
Nikkei
(0.9)
(194)
20,350
Refer detailed news & result analysis on the following page
Hang Sang
(3.1)
(777)
24,352
Straits Times
(1.2)
(39)
3,313
Markets Today
Shanghai Com
(8.5)
(345)
3,726
The trend deciding level for the day is 27,736 / 8,402 levels. If NIFTY trades above
this level during the first half-an-hour of trade then we may witness a further rally up
to
27,943
-
28,324
/
8,452
-
8,542 levels. However, if NIFTY trades below
Indian ADR
Chg (%)
(Pts)
(Close)
27,736 / 8,402 levels for the first half-an-hour of trade then it may correct towards
INFY
(2.8)
(0.5)
$16.7
27,355 - 27,148 / 8,311 - 8,261 levels.
WIT
(1.0)
(0.1)
$12.1
IBN
(1.8)
(0.2)
$9.6
Indices
S2
S1
PIVOT
R1
R2
HDB
(0.7)
(0.4)
$61.1
SENSEX
27,148
27,355
27,736
27,943
28,324
NIFTY
8,261
8,311
8,402
8,452
8,542
Advances / Declines
BSE
NSE
Advances
1,075
573
Net Inflows (July 25, 2015)
Declines
1,775
947
` cr
Purch
Sales
Net
MTD
YTD
FII
3,456
3,413
43
7,800
143,180
Unchanged
87
60
MFs
1,471
914
557
2,191
55,801
Volumes (` cr)
FII Derivatives (July 27, 2015)
BSE
2,962
` cr
Purch
Sales
Net
Open Interest
NSE
16,417
Index Futures
3,636
5,049
(1,414)
20,622
Stock Futures
11,390
12,189
(799)
51,566
Gainers / Losers
Gainer
Loser
Company
Price (`)
chg (%)
Company
Price (`)
chg (%)
TATAELXSI
1,672
4.9
KAILASH
6
(9.9)
SUNTV
292
4.5
JPPOWER
6
(7.4)
PERSISTENT
661
3.7
JPINFRATEC
14
(7.2)
NESTELIND
6,246
3.7
IOB
36
(6.0)
TV18BRDCST
35
3.6
NCC
82
(5.7)
Market Outlook
July 28, 2015
Garware Wall Ropes - Market Cap: `747 CMP: `315 Target
Price: `390 - BUY (Upside: 24%)
Despite firm raw material inflation witnessed by the company over the past
5-6 years, the company still managed to maintain its operating margin in the
range of 10-11%. In FY2015, the company’s operating margin grew by 90bp yoy.
Going forward, we believe that the company would be able to increase its
margins, mainly due to higher exports and lower material prices.
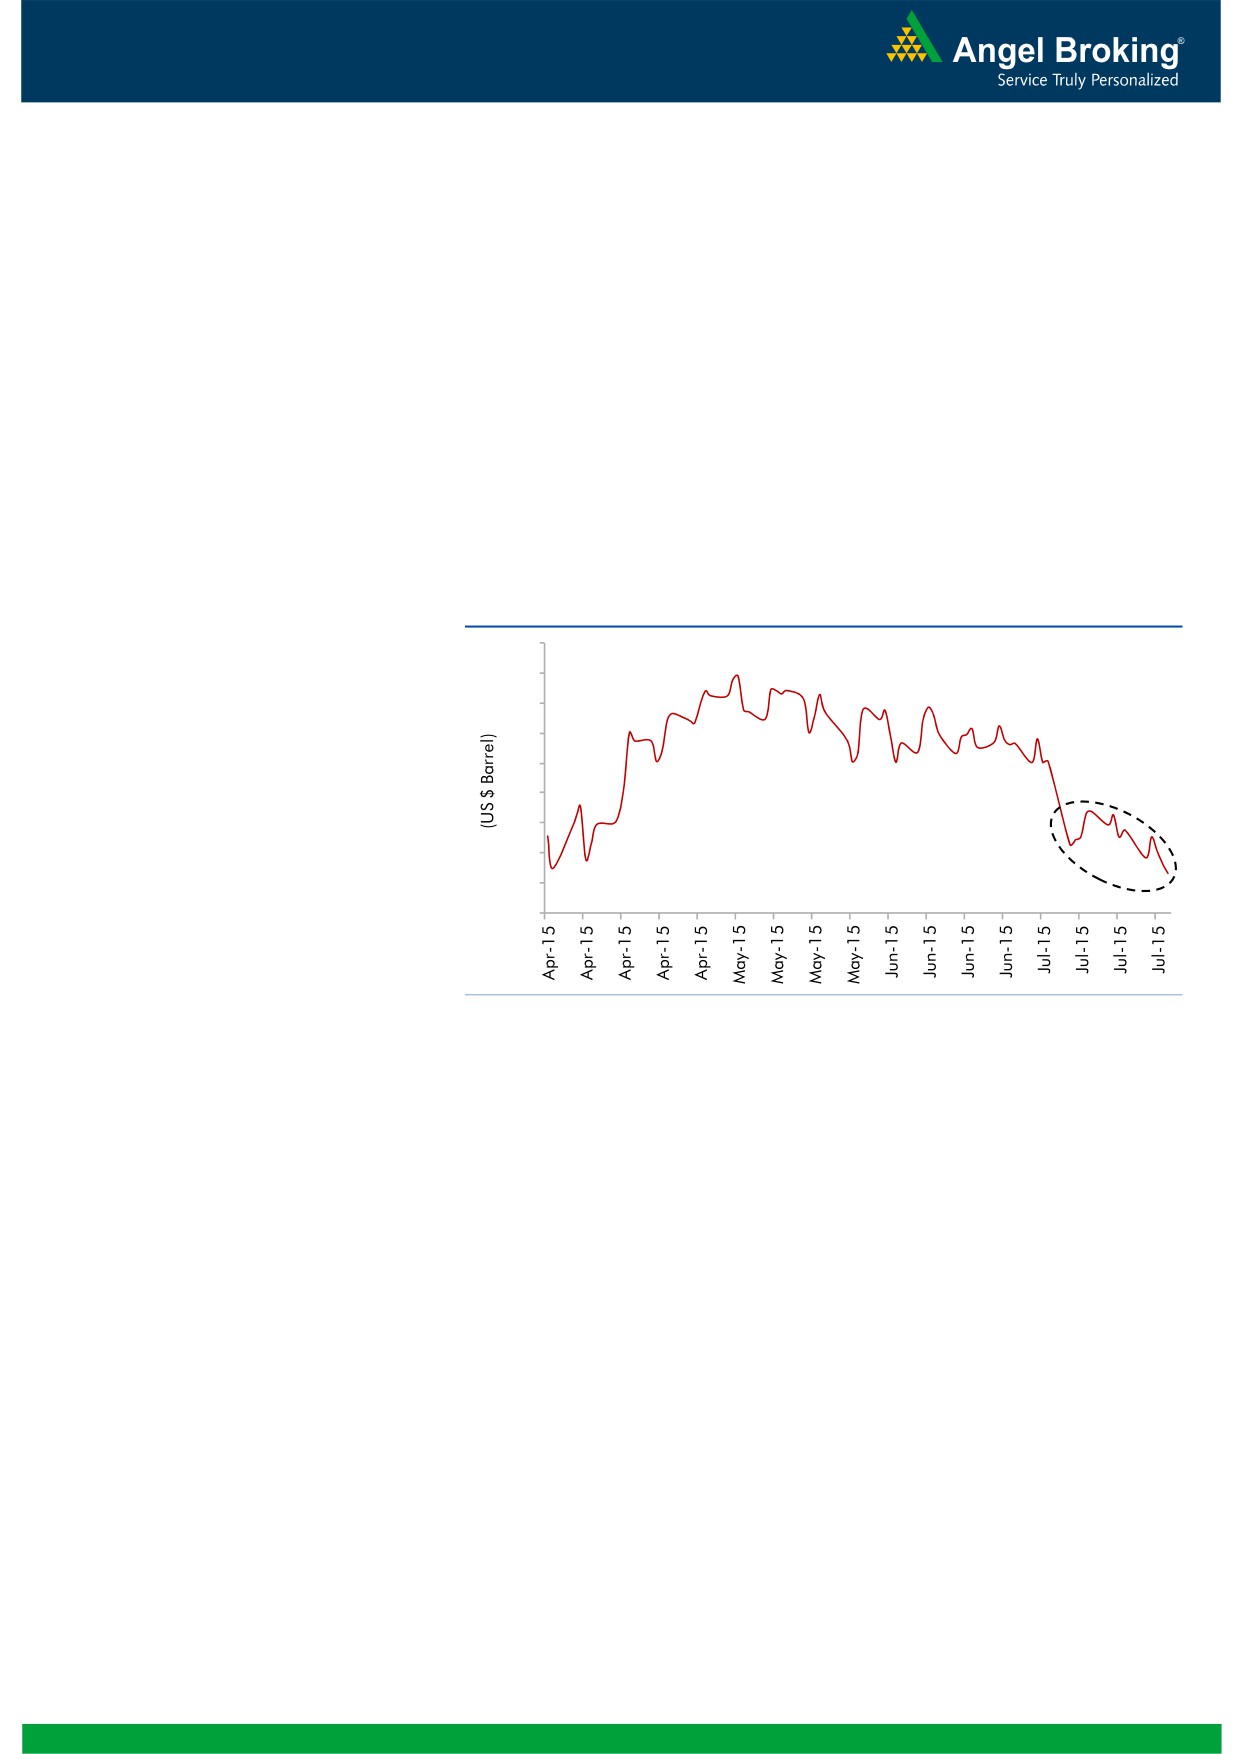
GWRL’s key raw materials are crude based and a correction in crude oil prices
eases the company’s raw material costs. We expect the company to report
operating margin improvement due to lower prices of key raw materials like
High Density Polyethylene, Polyethylene, Nylon etc. Over the past 3 month,
crude oil prices have corrected by 16%; since we initiated coverage on GWRL
(21st July 2015), crude prices have declined by almost 4%.
Exhibit 1: Falling crude prices
70
68
66
64
62
60
58
56
54
52
Source: Company, Angel Research
At the current market price, GWRL trades at a P/E of 11.3x its FY2017E EPS. We
had initiated coverage on the stock on June 21, 2015. Our target price of `303
has been achieved since then; we continue to hold our Buy recommendation on
the stock and are upgrading the target price to `390 (14x FY2017E EPS),
indicating further upside of ~24% from the current levels.
Company background
Garware-Wall Ropes Ltd. (GWRL) is an ISO 9001:2008 certified company.
Established in 1976, the company is a leading player in Technical Textiles,
specializing in providing customized solutions to the cordage and infrastructure
industry worldwide. Being a global player, the company is known for its innovation
in the field of fisheries, aquaculture, shipping, sports, agriculture, coated fabrics
and geosynthetics. GWRL’s products are manufactured in state-of-the-art facilities
at Wai and Pune (both in Maharashtra, India) and are marketed in more than
75 countries worldwide.
Market Outlook
July 28, 2015
Result Review
Tech Mahindra (CMP: `519/ TP: `646/Upside: 24.5%)
Tech Mahindra announced its 1QFY2016 results, which were marginally above on
sales front and ahead of expectations on the net profit. The company posted a
0.5% qoq growth in USD revenues to US$989mn V/s US$983mn expected and
V/s US$984mn in 4QFY2015. In rupee terms, the revenues came in at `6,294cr
V/s `6,242cr expected and V/s `6,117cr in 4QFY2015, a qoq growth of 2.9%.
The impact on the quarterly results was mainly on back of dip in the
communication domain which was
52.7% of sales V/s
55.3% of sales in
4QFY2015, whereas the other domains showed an improvement or same
performance as 4QFY2015.
The EBDITA came in at 14.9% in line with expectations, while the EBIT was 12.1%
again in line with expectation of 12.1%, registering a dip of 32bp and 26bps qoq
respectively. Consequently; the PAT came in at `676cr V/s `556cr expected and
V/s `472cr in 4QFY2015 a growth of 43.2% qoq. This was mainly on back of
other income, which came in at `136.6cr (on back of forex gains) V/s a loss of
`87. On the operating front, the utilization levels, 74% in 1QFY2016 V/s 71% in
4QFY2015, while the attrition stood steady at 19.1%. The client addition during
the quarter remained tepid, with total clients at 770 in 1QFY2016 V/s 767 in
4QFY2015. We maintain our buy rating on the stock with a target price of `646.
Y/E
Sales OPM
PAT
EPS ROE P/E P/BV EV/EBITDA EV/Sales
March
(` cr)
(%)
(` cr)
(`)
(%)
(x)
(x)
(x)
(x)
FY2016E
27,281
17.3
2,957
30.8
20.3
16.9
3.4
9.4
1.7
FY2017E
31,373
18.4
3,651
38.0
20.9
13.7
2.8
7.4
1.4
Ambuja Cement (CMP: `234/ TP: /Upside: )
Ambuja Cement announced its 2QCY2015 numbers, which were in line with our
expectation on profitability front. Net sales declined by 7.9% yoy to `2,492.8cr due
to sharp de-growth in sales realization. The realization came in at `4,239 per
tonne a decline of 8.4% yoy was below our estimate of `4,302 per tonne. Sales
volume was flat yoy to 5.88mt above our estimate of 5.7mt. EBITDA during the
quarter decreased by 34.7% yoy to `383.8cr above our estimate of `367.6cr,
largely due to better cement sales volume. Hence EBITDA margin at 15.4% was
above our estimate of 15.1%. The EBITDA/tonne came in at `653 in line our
estimate of `650/tonne led by operational efficiency. Net profit came in at
`226.4cr, as per our estimate. We maintain our Neutral rating on the stock.
Y/E
Sales OPM
PAT
EPS ROE P/E P/BV EV/EBITDA EV/Sales
March
(` cr)
(%)
(` cr)
(`)
(%)
(x)
(x)
(x)
(x)
CY2015E
10,930
18.0
1,566
10.1
15.1
23.6
3.5
12.9
3.0
CY2016E
12,022
19.1
1,811
11.7
16.4
20.4
3.2
11.1
2.7
Subros (CMP: `79/ TP: /Upside: )
Subros Ltd 1QFY2016 results were below estimates due to weak operating
performance. Revenues grew marginally 3% yoy to `295.2cr missing our estimates
of `309cr. While the volume growth at 19% yoy was robust, a sharp 14% dip in
Market Outlook
July 28, 2015
the realization on account of price cuts (due to JPY depreciation) coupled with poor
product mix impacted the topline. Subros operating margins at 11.3% improved
90 bp yoy but the same were lower than our estimates of 12.6%. Impacted by
poor operating performance, Net Profit at `4cr missed our estimates of `7.9cr. We
currently have Neutral rating on the stock.
Y/E
Sales OPM
PAT
EPS ROE P/E P/BV EV/EBITDA EV/Sales
March
(` cr)
(%)
(` cr)
(`)
(%)
(x)
(x)
(x)
(x)
FY2016E
1,295
11.7
25
4.2
7.7
18.9
1.4
5.7
0.6
FY2017E
1,533
12.0
44
7.3
12.4
10.8
1.3
4.5
0.5
MRF (CMP: `39,018/ TP: `43,575/ Upside: 11.7%)
Note- The Board of Directors at the meeting have approved the extension of the
current financial year by six months thus extending the current financial year up to
31 March 2016.
For 3QFY2016, MRF reported splendid set of numbers. After disappointing in
2QFY2016, the top-line showed good recovery, growing by 6.1% on yoy basis to
`3,539cr. This is marginally higher than our estimate of `3,422cr. Raw material
cost declined significantly during the quarter mainly due to ongoing weakness in
natural rubber prices, which has corrected by ~10% in both domestic as well as
international markets in the past quarter. Raw material cost as a percentage of
sales declined by 889bp yoy to 54.9%. Employee and other expenses were stable
in 3QFY2016 increasing marginally by 38bp and 24bp yoy to 6.1% and 16.1% of
sales respectively. On the back of lower raw material cost, the EBITDA margin
expanded by whopping 827bp yoy to 22.9%, beating our estimate of 18.7%.
Aided by impressive operating performance and 60.1% yoy increase in other
income to `32cr, the net profit grew by 94.1% yoy to `447cr.
We have changed our numbers to 18 months for FY2016E to reflect the financial
year change. At the current market price, the stock is trading at PE of 11.6x for
FY2017E. We maintain our Accumulate rating on the stock with a revised target
price of `43,575 based on target PE of 13.0X for FY2017E.
Y/E
Sales OPM
PAT
EPS ROE P/E P/BV EV/EBITDA EV/Sales
Mar
(` cr)
(%)
(` cr)
(`)
(%)
(x)
(x)
(x)
(x)
FY2016E*
20,727
19.3
2,081
4,905.8 37.6
8.0
2.5
3.9
0.7
FY2017E
14,841
18.6
1,422
3,351.9 19.6 11.6
2.1
5.4
1.0
Note: *FY2016E numbers are for 18 months as the Financial Year has changed from SY2015 to FY2016
Result Preview
Maruti Suzuki Ltd (CMP: `4,195/ TP: /Upside: )
Maruti Suzuki Ltd is slated to announce its 1QFY2016 results today. Revenues are
estimated to grow a robust 18% yoy to `13,466 cr. Maruti’s volumes have grown
14% yoy during the quarter. We expect the realization/vehicle to grow 4% yoy to
`382,812 led by a better mix. Operating margins are likely to improve 450 bp yoy
led by weakness in the Japanese Yen leading to lower raw material costs and a
reduction in the discounting/vehicle on back of improved demand. EBIDTA is
estimated to grow strongly 64% yoy to `2,180 cr. Given the strong operating
Market Outlook
July 28, 2015
performance, we expect the Net Profit to grow 61% yoy to `1,228 cr. Currently, we
have Neutral view on the stock.
Y/E
Sales OPM
PAT
EPS ROE P/E P/BV EV/EBITDA EV/Sales
March
(` cr)
(%)
(` cr)
(`)
(%)
(x)
(x)
(x)
(x)
FY2016E
57,615
15.6
5,443
180.2
19.7
23.3
4.6
12.8
2.0
FY2017E
68,166
15.5
6,646
220.0
20.6
19.1
3.9
10.7
1.6
Quarterly Bloomberg Brokers Consensus Estimate
Maruti Suzuki India Ltd- July 28, 2015
Particulars (` cr)
1QFY16E
1QFY15
y-o-y (%)
4QFY15
q-o-q (%)
Net sales
13,420
11,074
21.2
13,273
1.1
EBITDA
2,130
1,328
60.4
2,164
(1.6)
EBITDA margin (%)
15.9
12.0
16.3
Net profit
1,269
762
66.5
1,284
(1.2)
Housing Development Finance Corp- July 28, 2015
Particulars (` cr)
1QFY16E
1QFY15
y-o-y (%)
4QFY15
q-o-q (%)
Net sales
2,154
6,447
(66.6)
7,448
(71.1)
EBITDA
1,874
6,234
(69.9)
7,241
(74.1)
EBITDA margin (%)
87.0
96.7
97.2
Net profit
1,365
1,345
1.5
1,862
(26.7)
Punjab National Bank- July 28, 2015
Particulars (` cr)
1QFY16E
1QFY15
y-o-y (%)
4QFY15
q-o-q (%)
PAT
872
1,405
(38.0)
307
184.3
Bank of India- July 28, 2015
Particulars (` cr)
1QFY16E
1QFY15
y-o-y (%)
4QFY15
q-o-q (%)
PAT
329
806
(59.1)
(56)
0.0
IDBI Bank Ltd- July 28, 2015
Particulars (` cr)
1QFY16E
1QFY15
y-o-y (%)
4QFY15
q-o-q (%)
PAT
150
105
43.3
546
(72.5)
Union Bank of India- July 28, 2015
Particulars (` cr)
1QFY16E
1QFY15
y-o-y (%)
4QFY15
q-o-q (%)
PAT
509
664
(23.3)
444
14.7
Yes Bank Ltd- July 29, 2015
Particulars (` cr)
1QFY16E
1QFY15
y-o-y (%)
4QFY15
q-o-q (%)
PAT
550
439
25.1
551
(0.2)
Nestle India Ltd- July 29, 2015
Particulars (` cr)
1QFY16E
1QFY15
y-o-y (%)
4QFY15
q-o-q (%)
Net sales
2,361
2,419
(2.4)
2,507
(5.8)
EBITDA
400
500
(20.1)
612
(34.7)
EBITDA margin (%)
16.9
20.7
24.4
Net profit
272
288
(5.6)
320
(15.2)
Market Outlook
July 28, 2015
Dabur India Ltd (Consol)- July 29, 2015
Particulars (` cr)
1QFY16E
1QFY15
y-o-y (%)
4QFY15
q-o-q (%)
Net sales
2,065
1,864
10.8
1,945
6.2
EBITDA
317
268
18.4
346
(8.2)
EBITDA margin (%)
15.4
14.4
17.8
Net profit
255
211
21.1
285
(10.3)
Godrej Consumer Products Ltd (Consol)- July 29, 2015
Particulars (` cr)
1QFY16E
1QFY15
y-o-y (%)
4QFY15
q-o-q (%)
Net sales
2,116
1,886
12.2
2,083
1.6
EBITDA
298
242
23.4
387
(22.9)
EBITDA margin (%)
14.1
12.8
18.6
Net profit
193
143
34.8
266
(27.2)
JSW Steel Ltd (Consol)- July 29, 2015
Particulars (` cr)
1QFY16E
1QFY15
y-o-y (%)
4QFY15
q-o-q (%)
Net sales
11,583
13,067
(11.4)
12,364
(6.3)
EBITDA
1,540
2,612
(41.0)
1,683
(8.4)
EBITDA margin (%)
13.3
20.0
13.6
Net profit
(98)
656
0.0
62
0.0
Vedanta- July 29, 2015
Particulars (` cr)
1QFY16E
1QFY15
y-o-y (%)
4QFY15
q-o-q (%)
Net sales
17,403
17,056
2.0
17,732
(1.9)
EBITDA
4,300
5,673
(24.2)
4,014
7.1
EBITDA margin (%)
24.7
33.3
22.6
Net profit
544
1,341
(59.5)
491
10.6
NHPC Ltd- July 29, 2015
Particulars (` cr)
1QFY16E
1QFY15
y-o-y (%)
4QFY15
q-o-q (%)
Net sales
2,168
2,034
6.6
1,450
49.5
EBITDA
1,467
1,317
11.3
872
68.2
EBITDA margin (%)
67.7
64.8
60.2
Net profit
763
616
23.9
645
18.4
Economic and Political News
Third round of coal auction sees 31 bids
Consumer confidence in India rises to 4-year high: Nielsen
83% rainfall in July; situation grim in central, southern India: IMD
Corporate News
SAIL's special unit at Salem signs MoU with Butterfly Group
Electrosteel lenders approve strategic debt restructuring
Vedanta to produce zinc ore at Gamsberg mine from 2018
Jwellery firm Rajesh Exports buys Valcambi for $400mn in cash
Market Outlook
July 28, 2015
Top Picks
Large Cap
Market Cap
CMP
Target
Upside
Company
Sector
Rating
(` Mn)
(`)
(`)
(%)
Axis Bank
Financials
1,32,024
Buy
556
716
28.8
ICICI Bank
Financials
1,69,033
Buy
291
392
34.6
Infosys
IT
2,44,625
Buy
1,065
1,306
22.6
LIC Housing Fin.
Financials
24,247
Buy
480
553
15.1
Power Grid
Power
73,530
Buy
141
170
21.0
TCS
IT
4,89,075
Buy
2,497
3,168
26.9
Tech Mahindra
IT
49,913
Buy
519
646
24.5
Yes Bank
Financials
32,805
Buy
785
1,006
28.2
Ashok Leyland
Auto
23,052 Accumulate
81
88
8.6
MRF
Others
16,548 Accumulate
39,018
43,439
11.3
Source: Angel Research, Bloomberg
Mid Cap
Market
CMP
Target
Upside
Company
Sector
Rating
Cap (` Mn)
(`)
(`)
(%)
Action Const. Equip. Capital Goods
440
Buy
44
54
21.5
Bajaj Electricals
Others
2,736
Buy
271
341
25.7
Hindustan Media Ven. Media
1,738
Buy
237
292
23.3
JK Tyre
Auto Ancillary
2,331
Buy
103
127
23.6
MBL Infrastructures
Construction
1,169
Buy
564
789
39.9
Mangalam Cements Cement
720
Buy
270
349
29.3
MT Educare
Others
444
Buy
111
141
26.6
Radico Khaitan
Others
1,185
Buy
89
112
25.8
Setco Automotive
Auto Ancillary
620
Buy
232
286
23.2
Source: Angel Research, Bloomberg
Market Outlook
July 28, 2015
Result Calendar
Date
Company
Maruti, Thermax, Blue Star, HDFC, Punjab Natl.Bank, Bank of India, Union Bank, IDBI Bank, Syndicate Bank, Tide
July 28, 2015
Water Oil India
United Phosphorus, Yes Bank, Allahabad Bank, Nestle, Dabur India, Godrej Consumer, Mphasis, Sesa Goa, JSW Steel
July 29, 2015
, Essar Oil, NHPC
Exide Industries, Kotak Mah. Bank, Bank of Baroda, IDFC, Oriental Bank, Vijaya Bank, Dena Bank, ITC, Colgate,
July 30, 2015
Electrosteel Castings, Petronet LNG, Jyothy Laboratories, HSIL, L G Balakrishnan & Bros, Dr Reddy's, Glenmark
Pharma., Ipca labs, Indoco Remedies, NTPC
July 31, 2015
Suzlon Energy, ICICI Bank, Shriram Trans., Sun TV Network, GSK Pharma, Alembic Pharma, CESC
August 1, 2015
Transport Corporation of India
August 2, 2015
August 3, 2015
Hero Motocorp, Bharat Forge, BGR Energy , HCL Tech, Styrolution, Vesuvius India
August 4, 2015
Britannia, Hexaware, Sterling Tools
Tata Chemicals, Automotive Axle, Siemens, Ramco Cements, GlaxoSmith Con, Indraprasth Gas, ITD Cementation,
August 5, 2015
PTC India
August 6, 2015
Tata Global, Motherson Sumi, Cummins India, Bajaj Electrical
August 7, 2015
Tata Motors, M&M, Rural Elec.Corp., GSPL, Kirloskar Engines India Ltd
Source: Bloomberg, Angel Research
Global economic events release calendar
Date
Time
Country Event Description
Unit
Period
Bloomberg Data
Last Reported Estimated
July 28, 2015
2:00PM UK
GDP (YoY)
% Change
2Q A
2.90
2.60
7:30PM US
Consumer Confidence
S.A./ 1985=100
Jul
101.40
100.00
July 29, 2015
11:30PM US
FOMC rate decision
%
Jul 29
0.25
0.25
July 30, 2015
1:25PM Germany Unemployment change (000's)
Thousands
Jul
(1.00)
(5.50)
6:00PM US
GDP Qoq (Annualised)
% Change
2Q A
(0.20)
2.50
August 1, 2015
6:30AM China PMI Manufacturing
Value
Jul
50.20
--
August 3, 2015
2:00PM UK
PMI Manufacturing
Value
Jul
51.40
--
August 4, 2015
11:00AM India
RBI Reverse Repo rate
%
Aug 4
6.25
--
11:00AM India
RBI Repo rate
%
Aug 4
7.25
--
11:00AM India
RBI Cash Reserve ratio
%
Aug 4
4.00
--
August 6, 2015
4:30PM UK
BOE Announces rates
% Ratio
Aug 6
0.50
0.50
2:00PM UK
Industrial Production (YoY)
% Change
Jun
2.10
--
August 7, 2015
6:00PM US
Change in Nonfarm payrolls
Thousands
Jul
223.00
--
6:00PM US
Unnemployment rate
%
Jul
5.30
--
August 8, 2015
China
Exports YoY%
% Change
Jul
2.80
--
August 9, 2015
7:00AM China Consumer Price Index (YoY)
% Change
Jul
1.40
--
August 10, 2015
India
Imports YoY%
% Change
Jul
(13.40)
--
India
Exports YoY%
% Change
Jul
(15.80)
--
August 12, 2015
2:00PM UK
Jobless claims change
% Change
Jul
7.00
--
11:00AM China Industrial Production (YoY)
% Change
Jul
6.80
--
5:30PM India
Industrial Production YoY
% Change
Jun
2.70
--
Source: Bloomberg, Angel Research
Market Outlook
July 28, 2015
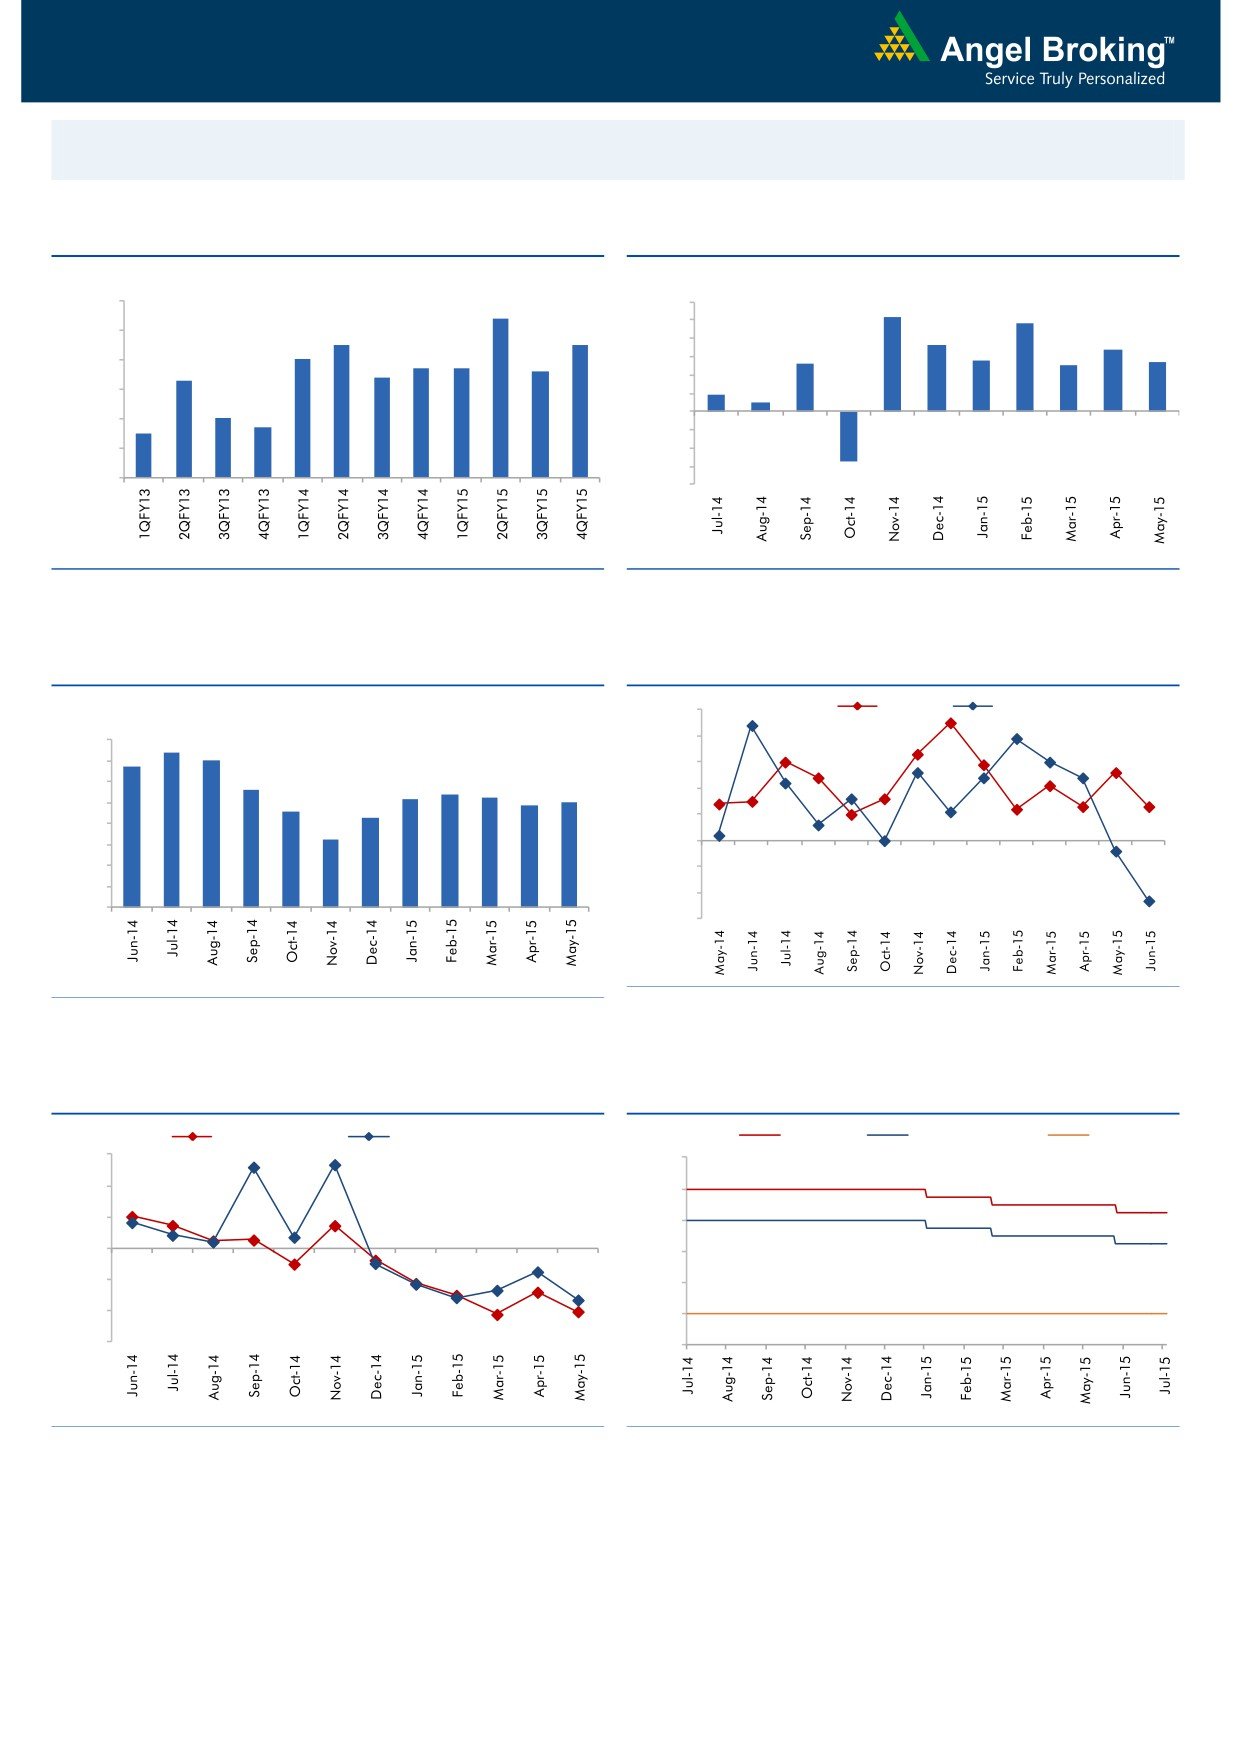
Macro watch
Exhibit 1: Quarterly GDP trends
Exhibit 2: IIP trends
(%)
(%)
9.0
8.4
6.0
5.2
4.8
5.0
8.0
7.5
7.5
3.6
3.4
7.0
4.0
2.8
2.7
6.7
6.7
2.6
2.5
6.6
3.0
7.0
6.3
6.4
2.0
0.9
6.0
0.5
1.0
5.0
4.7
-
5.0
4.5
(1.0)
4.0
(2.0)
(3.0)
3.0
(2.7)
(4.0)
Source: CSO, Angel Research
Source: MOSPI, Angel Research
Exhibit 3: Monthly CPI inflation trends
Exhibit 4: Manufacturing and services PMI
(%)
55.0
Mfg. PMI
Services PMI
8.0
7.4
54.0
6.8
7.0
7.0
53.0
5.6
5.4
6.0
5.2
5.3
4.9
5.0
52.0
4.6
5.0
4.3
51.0
4.0
3.3
50.0
3.0
2.0
49.0
1.0
48.0
-
47.0
Source: Market, Angel Research; Note: Level above 50 indicates expansion
Source: MOSPI, Angel Research
Exhibit 5: Exports and imports growth trends
Exhibit 6: Key policy rates
(%)
Exports yoy growth
Imports yoy growth
(%)
Repo rate
Reverse Repo rate
CRR
30.0
9.00
20.0
8.00
10.0
7.00
0.0
6.00
(10.0)
5.00
(20.0)
4.00
(30.0)
3.00
Source: Bloomberg, Angel Research
Source: RBI, Angel Research
Market Outlook
July 28, 2015
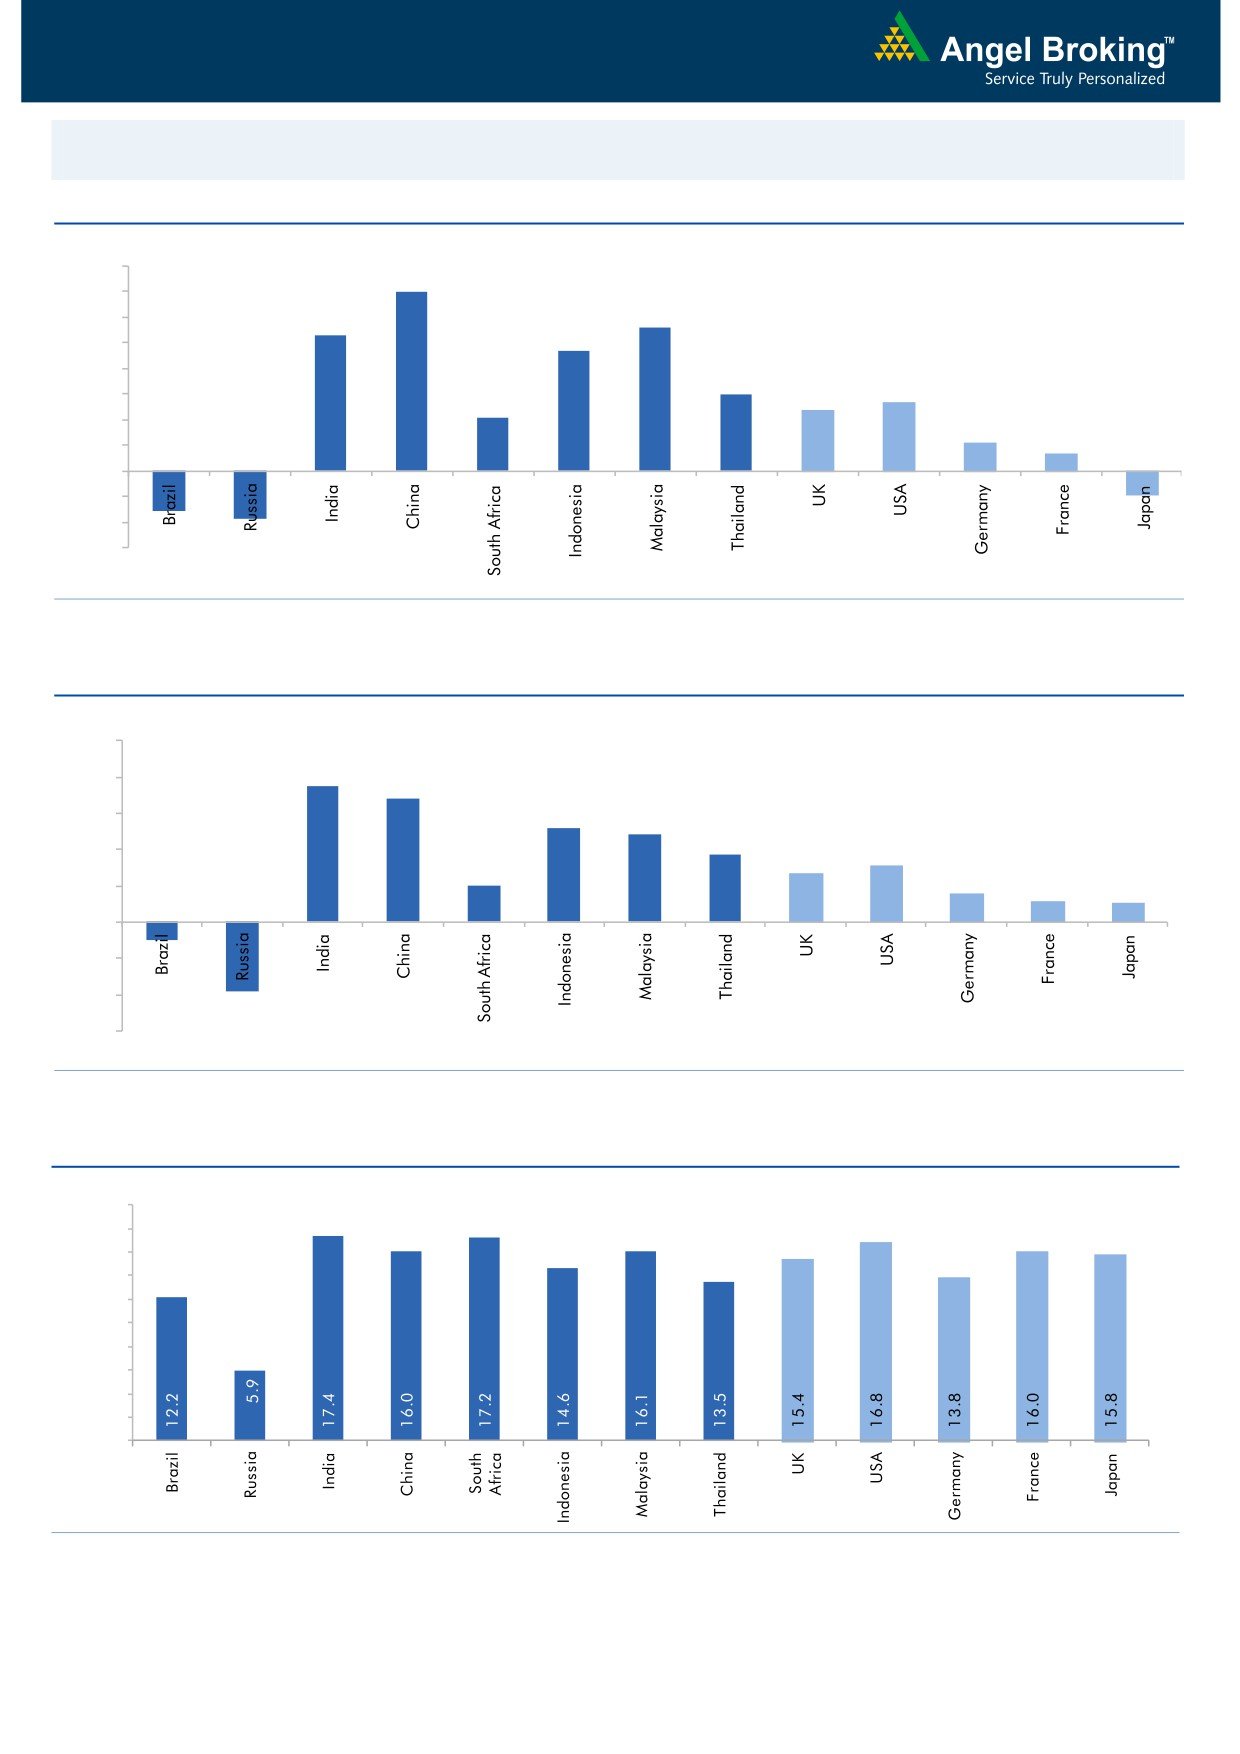
Global watch
Exhibit 1: Latest quarterly GDP Growth (%, yoy) across select developing and developed countries
(%)
8.0
7.0
7.0
5.6
6.0
5.3
4.7
5.0
4.0
3.0
2.7
3.0
2.4
2.1
2.0
1.1
0.7
1.0
(1.6)
(1.9)
(0.9)
-
(1.0)
(2.0)
(3.0)
Source: Bloomberg, Angel Research
Exhibit 2: 2015 GDP Growth projection by IMF (%, yoy) across select developing and developed countries
(%)
10.0
7.5
8.0
6.8
6.0
5.2
4.8
3.7
4.0
3.1
2.7
2.0
1.6
2.0
1.2
1.0
(1.0)
(3.8)
-
(2.0)
(4.0)
(6.0)
Source: IMF, Angel Research
Exhibit 3: One year forward P-E ratio across select developing and developed countries
(x)
20.0
18.0
16.0
14.0
12.0
10.0
8.0
6.0
4.0
2.0
-
Source: Bloomberg, Angel Research
Market Outlook
July 28, 2015
Exhibit 4: Relative performance of indices across globe
Returns (%)
Country
Name of index
Closing price
1M
3M
1YR
Brazil
Bovespa
48,736
(9.5)
(12.5)
(15.1)
Russia
Micex
1,585
(2.9)
(5.5)
12.5
India
Nifty
8,361
(0.4)
1.8
9.7
China
Shanghai Composite
3,726
(14.7)
(21.0)
73.7
South Africa
Top 40
45,769
(3.2)
(5.5)
(1.3)
Mexico
Mexbol
43,714
(3.7)
(4.0)
(1.5)
Indonesia
LQ45
809
(6.2)
(14.7)
(8.9)
Malaysia
KLCI
1,710
(0.8)
(8.6)
(8.9)
Thailand
SET 50
926
(7.4)
(11.0)
(9.8)
USA
Dow Jones
17,441
(2.9)
(3.5)
2.7
UK
FTSE
6,505
(4.4)
(8.0)
(4.4)
Japan
Nikkei
20,350
(3.3)
(0.2)
30.7
Germany
DAX
11,056
(3.6)
(6.4)
14.6
France
CAC
4,928
(2.3)
(6.5)
16.0
Source: Bloomberg, Angel Research
Market Outlook
July 28, 2015
Stock Watch
Company Name
Reco
CMP
Target
Mkt Cap
Sales ( Čcr )
OPM(%)
EPS (Č)
PER(x)
P/BV(x)
RoE(%)
EV/Sales(x)
(Č)
Price ( Č)
( Č cr )
FY16E FY17E
FY16E
FY17E
FY16E
FY17E
FY16E
FY17E
FY16E
FY17E
FY16E
FY17E
FY16E
FY17E
Agri / Agri Chemical
Rallis
Neutral
223
-
4,342
2,075
2,394
14.4
14.4
9.5
11.0
23.5
20.3
4.7
4.0
21.1
21.3
2.1
1.8
United Phosphorus
Neutral
536
-
22,967
13,698
15,752
17.6
17.6
32.1
38.5
16.7
13.9
3.3
2.7
21.4
21.3
1.8
1.5
Auto & Auto Ancillary
Ashok Leyland
Accumulate
81
88
23,052
17,094
19,726
9.5
10.7
2.7
4.2
30.0
19.3
4.1
3.8
13.9
19.8
1.3
1.1
Bajaj Auto
Neutral
2,508
-
72,565
23,842
27,264
19.8
19.6
128.4
144.4
19.5
17.4
6.0
5.1
30.5
29.5
2.6
2.3
Eicher Motors
Accumulate
19,348
21,843
52,515
11,681
15,550
15.3
16.9
358.5
564.3
54.0
34.3
16.2
12.1
29.8
34.9
4.4
3.3
Hero Motocorp
Neutral
2,606
-
52,032
29,771
34,219
13.0
13.5
142.3
165.2
18.3
15.8
6.6
5.7
36.3
35.8
1.6
1.4
L G Balakrishnan & Bros Accumulate
487
541
765
1,254
1,394
11.6
11.8
35.9
41.7
13.6
11.7
1.8
1.6
13.5
13.8
0.7
0.6
Mahindra and Mahindra Neutral
1,319
-
81,900
41,078
46,473
11.5
12.0
51.4
62.7
25.7
21.0
3.8
3.3
14.7
15.9
1.7
1.5
Maruti
Accumulate
4,176
4,399
126,159
57,615
68,166
15.6
15.5
180.2
220.0
23.2
19.0
4.6
3.9
19.7
20.6
2.0
1.6
Minda Industries
Buy
552
652
876
2,500
2,889
7.6
8.3
39.4
54.3
14.0
10.2
2.0
1.7
14.1
16.3
0.5
0.4
Rane Brake Lining
Accumulate
335
366
265
454
511
11.1
11.4
23.8
28.1
14.1
11.9
2.0
1.8
14.2
15.3
0.7
0.7
Setco Automotive
Buy
232
286
620
718
862
13.3
14.3
13.4
19.0
17.3
12.2
2.7
2.3
15.4
18.5
1.1
1.0
Tata Motors
Buy
378
489
109,021
260,543
278,575
13.3
13.7
31.7
38.0
11.9
9.9
1.4
1.2
12.2
13.0
0.6
0.6
TVS Motor
Accumulate
242
259
11,476
11,839
13,985
7.0
8.1
10.8
16.2
22.4
14.9
5.7
4.5
25.5
30.1
0.9
0.8
Amara Raja Batteries
Neutral
844
-
14,423
5,355
6,641
17.4
17.8
31.8
40.9
26.6
20.6
6.7
5.3
25.2
25.5
2.6
2.1
Exide Industries
Accumulate
145
164
12,287
7,919
9,028
13.9
14.4
7.3
8.6
19.8
16.8
2.7
2.4
13.8
14.4
1.3
1.2
Apollo Tyres
Neutral
191
-
9,738
12,866
13,892
15.7
15.4
20.1
19.9
9.5
9.6
1.5
1.3
15.8
13.6
0.8
0.8
Ceat
Buy
790
945
3,195
6,041
6,770
13.9
13.0
101.5
105.0
7.8
7.5
1.6
1.3
20.0
17.5
0.7
0.6
JK Tyres
Buy
103
127
2,331
7,774
8,456
13.3
12.9
17.3
18.1
5.9
5.7
1.4
1.1
22.8
19.7
0.6
0.6
Swaraj Engines
Accumulate
856
910
1,063
604
689
14.3
14.5
51.4
60.7
16.7
14.1
3.9
3.5
23.4
24.7
1.6
1.4
Subros
Neutral
79
-
471
1,295
1,533
11.7
12.0
4.2
7.3
18.7
10.8
1.4
1.3
7.7
12.4
0.7
0.5
Indag Rubber
Buy
193
247
507
283
329
17.0
17.2
13.0
15.4
14.9
12.5
3.3
2.7
21.8
21.6
1.5
1.2
Capital Goods
ACE
Buy
44
54
440
660
839
4.7
8.2
1.0
3.9
44.5
11.4
1.4
1.2
3.2
11.3
0.8
0.6
BEML
Accumulate
1,454
1,607
6,055
3,277
4,006
6.0
8.9
29.2
64.3
49.8
22.6
5.7
11.7
1.9
1.5
BGR Energy
Neutral
123
-
885
3,615
3,181
9.5
9.4
16.7
12.4
7.3
9.9
0.7
0.7
10.0
7.0
0.7
0.8
BHEL
Neutral
272
-
66,611
33,722
35,272
10.8
11.7
10.5
14.2
25.9
19.2
1.9
1.8
7.0
9.0
2.1
2.0
Blue Star
Buy
331
391
2,976
3,649
4,209
4.8
5.7
8.5
14.0
39.1
23.7
6.2
5.4
16.3
24.4
0.9
0.8
Crompton Greaves
Buy
179
220
11,231
15,252
16,870
5.4
5.6
7.9
10.7
22.7
16.8
2.8
2.4
12.0
15.0
0.8
0.7
Inox Wind
Buy
437
505
9,698
4,980
5,943
17.0
17.5
26.6
31.6
16.4
13.8
35.0
30.0
2.1
1.7
Market Outlook
July 28, 2015
Stock Watch
Company Name
Reco
CMP
Target
Mkt Cap
Sales ( Čcr )
OPM(%)
EPS (Č)
PER(x)
P/BV(x)
RoE(%)
EV/Sales(x)
(Č)
Price ( Č)
( Č cr )
FY16E
FY17E
FY16E
FY17E
FY16E
FY17E
FY16E
FY17E
FY16E
FY17E
FY16E
FY17E
FY16E
FY17E
Capital Goods
KEC International
Neutral
150
-
3,858
8,791
9,716
6.1
6.8
5.4
8.2
27.8
18.3
2.8
2.5
10.0
14.0
0.7
0.6
Thermax
Neutral
1,064
-
12,672
6,413
7,525
7.4
8.5
30.5
39.3
34.9
27.1
5.4
4.7
15.0
17.0
2.0
1.6
Cement
ACC
Accumulate
1,369
1,548
25,706
11,856
14,092
14.5
17.8
47.6
76.2
28.8
18.0
3.0
2.7
10.6
15.7
2.0
1.7
Ambuja Cements
Neutral
234
-
36,361
10,930
12,022
22.2
23.2
9.7
11.2
24.1
20.9
3.3
3.1
14.3
15.2
2.9
2.6
India Cements
Buy
83
132
2,553
4,716
5,133
14.9
15.8
1.0
4.5
83.1
18.5
0.9
0.8
1.0
4.5
0.9
0.8
JK Cement
Buy
616
778
4,303
4,061
4,748
16.2
17.7
24.5
42.9
25.1
14.4
2.4
2.2
10.0
15.9
1.5
1.3
J K Lakshmi Cement
Buy
321
443
3,779
3,004
3,618
17.6
19.9
13.9
27.2
23.1
11.8
2.6
2.3
11.8
20.5
1.7
1.3
Mangalam Cements
Buy
270
349
720
1,111
1,336
12.2
15.1
16.3
34.6
16.6
7.8
1.3
1.2
8.2
16.0
0.9
0.7
Orient Cement
Neutral
184
-
3,765
2,039
2,573
22.7
24.5
9.3
13.3
19.8
13.8
3.4
2.9
18.3
22.6
2.5
1.9
Ramco Cements
Neutral
362
-
8,620
4,036
4,545
20.8
21.3
15.1
18.8
24.0
19.3
2.9
2.6
12.9
14.3
2.6
2.3
Shree Cement^
Neutral
10,765
-
37,503
7,150
8,742
26.7
28.6
228.0
345.5
47.2
31.2
7.0
5.8
15.7
20.3
5.0
4.0
UltraTech Cement
Neutral
3,132
-
85,950
27,562
31,548
20.3
22.0
111.0
145.0
28.2
21.6
4.0
3.4
15.1
17.0
3.2
2.7
Construction
ITNL
Buy
147
211
3,618
7,589
8,021
34.0
35.9
16.0
19.0
9.2
7.7
0.6
0.5
6.5
6.7
3.6
3.8
KNR Constructions
Neutral
581
-
1,633
915
1,479
14.3
13.9
20.3
37.2
28.6
15.6
2.6
2.3
9.6
15.6
1.9
1.2
Larsen & Toubro
Buy
1,747
2,013
162,528
68,920
82,446
10.9
11.5
57.0
73.0
30.7
23.9
2.8
2.6
13.6
15.5
2.6
2.1
Gujarat Pipavav Port
Neutral
221
-
10,677
793
694
53.0
50.9
9.0
8.0
24.5
27.6
5.3
4.3
25.9
18.4
13.1
14.9
MBL Infrastructures
Buy
564
789
1,169
2,507
2,986
12.4
14.4
43.0
41.0
13.1
13.8
1.6
1.4
12.6
12.7
1.2
1.1
PNC Infratech
Accumulate
426
445
2,185
1,719
2,003
13.0
13.5
21.0
28.0
20.3
15.2
1.7
1.6
11.0
10.9
1.4
1.2
Financials
Allahabad Bank
Neutral
84
-
4,785
8,859
9,817
3.0
3.0
23.7
30.1
3.5
2.8
0.4
0.4
10.6
12.3
-
-
Axis Bank
Buy
556
716
132,024
26,522
31,625
3.6
3.6
36.2
45.4
15.4
12.2
3.0
2.6
18.2
19.6
-
-
Bank of Baroda
Neutral
152
-
33,637
18,934
21,374
2.0
2.0
13.2
15.1
11.5
10.1
0.9
0.8
7.1
7.7
-
-
Bank of India
Neutral
164
-
10,891
17,402
20,003
2.0
2.1
40.3
50.7
4.1
3.2
0.4
0.3
9.0
10.4
-
-
Canara Bank
Accumulate
268
297
13,802
15,805
17,745
2.0
2.2
64.3
73.5
4.2
3.7
0.5
0.4
10.8
11.3
-
-
Dena Bank
Neutral
43
-
2,407
3,580
4,040
2.1
2.2
8.4
10.9
5.1
3.9
0.4
0.4
6.8
8.4
-
-
Federal Bank
Neutral
68
-
11,738
3,522
4,045
3.2
3.2
12.2
14.1
5.6
4.9
0.7
0.6
12.9
13.4
-
-
HDFC
Neutral
1,335
-
210,486
11,198
13,321
3.5
3.5
45.1
53.7
29.6
24.9
6.1
5.5
27.2
28.2
-
-
HDFC Bank
Accumulate
1,095
1,255
275,105
38,629
47,500
4.5
4.7
52.6
66.4
20.8
16.5
3.8
3.2
19.6
21.2
-
-
ICICI Bank
Buy
291
392
169,033
36,037
41,647
3.5
3.6
22.9
26.7
12.7
10.9
2.1
1.9
15.7
15.9
-
-
IDBI Bank
Neutral
60
-
9,560
9,806
11,371
1.7
1.9
10.0
16.3
6.0
3.7
0.4
0.4
6.8
10.4
-
-
Market Outlook
July 28, 2015
Stock Watch
Company Name
Reco
CMP
Target
Mkt Cap
Sales ( Čcr )
OPM(%)
EPS (Č)
PER(x)
P/BV(x)
RoE(%)
EV/Sales(x)
(Č)
Price ( Č)
( Č cr )
FY16E FY17E
FY16E
FY17E
FY16E
FY17E
FY16E
FY17E
FY16E
FY17E
FY16E
FY17E
FY16E
FY17E
Financials
Indian Bank
Neutral
134
-
6,450
6,454
7,321
2.5
2.6
26.4
33.3
5.1
4.0
0.4
0.4
8.1
9.6
-
-
LIC Housing Finance
Buy
480
553
24,247
2,934
3,511
2.3
2.3
30.9
36.8
15.6
13.1
2.5
2.2
16.8
17.5
-
-
Oriental Bank
Neutral
161
-
4,834
7,930
8,852
2.5
2.5
51.8
57.1
3.1
2.8
0.4
0.3
9.3
9.5
-
-
Punjab Natl.Bank
Neutral
135
-
25,092
24,160
27,777
2.9
3.0
18.5
24.6
7.3
5.5
0.7
0.6
8.8
10.8
-
-
South Ind.Bank
Neutral
23
-
3,085
1,999
2,249
2.4
2.4
3.5
4.0
6.6
5.7
0.8
0.7
12.6
13.1
-
-
St Bk of India
Accumulate
259
297
196,003
86,900
100,550
3.1
3.1
22.1
27.7
11.7
9.4
1.5
1.3
12.7
14.3
-
-
Union Bank
Neutral
154
-
9,801
12,995
14,782
2.4
2.4
32.3
40.9
4.8
3.8
0.6
0.5
10.7
12.3
-
-
Vijaya Bank
Neutral
40
-
3,424
3,474
3,932
1.8
1.9
5.9
7.2
6.8
5.5
0.6
0.5
8.1
9.3
-
-
Yes Bank
Buy
785
1,006
32,805
7,006
8,825
3.1
3.3
61.4
77.1
12.8
10.2
2.4
2.0
20.1
21.3
-
-
FMCG
Asian Paints
Neutral
851
-
81,652
16,553
19,160
16.0
16.2
17.7
21.5
48.2
39.6
12.8
11.5
29.4
31.2
4.8
4.1
Britannia
Neutral
2,930
-
35,155
8,065
9,395
9.6
10.2
47.2
65.5
62.1
44.7
20.6
19.5
38.3
41.2
4.2
3.6
Colgate
Neutral
2,056
-
27,959
4,836
5,490
19.5
19.7
48.5
53.2
42.4
38.6
31.1
27.1
99.8
97.5
5.7
5.0
Dabur India
Neutral
296
-
52,046
9,370
10,265
17.1
17.2
7.3
8.1
40.4
36.6
12.2
9.9
33.7
30.6
5.5
5.0
GlaxoSmith Con*
Neutral
6,185
-
26,012
4,919
5,742
17.2
17.4
168.3
191.2
36.8
32.4
10.4
8.9
28.8
28.9
4.9
4.1
Godrej Consumer
Neutral
1,218
-
41,489
10,168
12,886
16.1
16.1
32.1
38.4
38.0
31.7
7.7
7.1
19.7
21.0
4.2
3.3
HUL
Neutral
901
-
194,895
34,940
38,957
17.5
17.7
20.8
24.7
43.3
36.5
48.2
38.5
110.5
114.2
5.4
4.8
ITC
Buy
312
409
249,783
41,068
45,068
37.8
37.4
13.9
15.9
22.4
19.6
7.5
6.6
34.1
33.8
5.7
5.2
Marico
Neutral
428
-
27,581
6,551
7,766
15.7
16.0
10.4
12.5
41.2
34.2
12.0
9.9
33.2
32.4
4.1
3.5
Nestle*
Accumulate
6,246
6,646
60,224
11,291
12,847
22.2
22.3
158.9
184.6
39.3
33.8
20.6
18.5
55.0
57.3
5.2
4.5
Tata Global
Buy
138
186
8,674
8,735
9,182
9.8
9.9
8.5
9.3
16.2
14.8
2.1
2.0
7.9
8.1
0.9
0.9
IT
HCL Tech^
Buy
937
1,100
131,719
41,535
46,519
24.0
23.4
56.6
61.1
16.6
15.3
3.4
2.7
20.8
17.7
3.1
2.6
Infosys
Buy
1,065
1,306
244,625
60,250
66,999
28.0
28.0
58.3
63.7
18.3
16.7
3.8
3.3
20.9
19.7
3.4
2.9
TCS
Buy
2,497
3,168
489,075
108,420
123,559
28.8
28.7
127.2
143.9
19.6
17.4
7.8
7.3
39.9
41.8
4.1
3.6
Tech Mahindra
Buy
519
646
49,913
27,281
31,373
17.3
18.4
30.8
38.0
16.9
13.7
3.4
2.9
20.3
20.9
1.6
1.3
Wipro
Buy
561
753
138,599
54,050
61,617
23.7
23.8
39.4
44.1
14.2
12.7
2.8
2.6
19.9
18.8
2.2
1.7
Media
D B Corp
Accumulate
319
356
5,855
2,241
2,495
27.8
27.9
21.8
25.6
14.6
12.5
3.8
3.4
26.7
28.5
2.6
2.3
HT Media
Buy
88
129
2,054
2,495
2,703
13.5
13.6
9.4
10.7
9.4
8.3
1.0
0.9
10.4
10.6
0.4
0.2
Jagran Prakashan
Buy
134
156
4,387
1,939
2,122
26.0
26.0
8.3
9.2
16.2
14.6
2.8
2.5
17.5
17.1
2.2
2.0
Sun TV Network
Neutral
292
-
11,521
2,779
3,196
70.2
70.5
22.8
27.3
12.8
10.7
3.2
2.9
26.7
28.3
3.9
3.4
Market Outlook
July 28, 2015
Stock Watch
Company Name
Reco
CMP
Target
Mkt Cap
Sales ( Čcr )
OPM(%)
EPS (Č)
PER(x)
P/BV(x)
RoE(%)
EV/Sales(x)
(Č)
Price ( Č)
( Č cr )
FY16E FY17E
FY16E
FY17E
FY16E
FY17E
FY16E
FY17E
FY16E
FY17E
FY16E
FY17E
FY16E
FY17E
Media
Hindustan Media
Buy
237
292
1,738
920
1,031
20.0
20.0
19.2
20.9
12.3
11.3
2.0
1.7
16.4
15.3
1.4
1.3
Ventures
Metals & Mining
Coal India
Accumulate
424
450
267,782
77,595
89,628
22.9
24.4
27.6
30.0
15.4
14.1
6.6
6.6
33.9
33.2
2.7
2.4
Hind. Zinc
Neutral
164
-
69,147
15,546
16,821
47.5
49.0
19.7
20.3
8.3
8.1
1.4
1.2
17.2
16.6
2.2
1.7
Hindalco
Neutral
104
-
21,527
112,328
119,817
7.7
7.9
16.3
20.1
6.4
5.2
0.5
0.4
8.0
8.5
0.7
0.6
JSW Steel
Neutral
815
-
19,703
48,125
53,595
18.8
21.0
46.9
97.5
17.4
8.4
0.8
0.8
4.4
9.5
1.2
1.1
NMDC
Neutral
111
-
43,870
12,544
13,330
59.5
59.7
16.3
16.5
6.8
6.7
1.2
1.1
5.1
9.9
2.2
2.2
SAIL
Neutral
57
-
23,356
56,365
63,383
6.9
8.0
7.1
8.2
7.9
6.9
0.5
0.5
7.0
7.1
1.0
0.9
Vedanta
Neutral
129
-
38,096
81,842
88,430
30.6
32.8
20.2
25.7
6.4
5.0
0.5
0.4
7.5
8.5
0.8
0.6
Tata Steel
Neutral
251
-
24,416
136,805
149,228
11.3
11.9
26.4
36.8
9.5
6.8
0.8
0.7
6.0
8.0
0.7
0.7
Oil & Gas
Cairn India
Neutral
169
-
31,638
12,617
14,513
33.7
40.0
25.5
27.7
6.6
6.1
0.5
0.5
7.4
7.7
1.2
1.0
GAIL
Neutral
354
-
44,917
75,595
85,554
8.6
8.0
31.8
36.1
11.1
9.8
1.2
1.1
10.7
11.4
0.7
0.6
ONGC
Neutral
271
-
232,196
174,773
192,517
22.7
24.8
34.6
38.2
7.9
7.1
1.1
1.0
14.2
14.9
1.4
1.3
Petronet LNG
Neutral
190
-
14,220
45,759
49,386
3.7
4.0
12.6
14.9
15.1
12.7
2.3
2.0
16.1
16.7
0.4
0.3
Reliance Industries
Accumulate
1,006
1,100
325,647
339,083
384,014
7.8
9.5
75.7
94.5
13.3
10.6
1.3
1.3
10.7
12.2
1.3
1.2
Pharmaceuticals
Alembic Pharma
Neutral
740
-
13,945
2,405
2,859
19.9
20.4
17.7
22.0
41.8
33.6
12.0
9.1
32.6
30.9
5.8
4.8
Aurobindo Pharma
Accumulate
739
824
43,164
14,435
16,600
22.6
22.6
36.1
41.2
20.5
17.9
6.1
4.6
34.5
29.3
3.3
2.9
Aventis*
Neutral
3,782
-
8,710
2,156
2,455
15.1
16.8
109.7
133.9
34.5
28.2
4.7
3.9
18.4
22.5
3.7
3.1
Cadila Healthcare
Neutral
1,915
-
39,209
10,224
11,840
19.7
20.0
69.8
81.0
27.4
23.6
7.3
5.8
26.8
25.3
3.9
3.3
Cipla
Neutral
675
-
54,222
14,051
16,515
18.9
18.7
25.1
28.9
26.9
23.4
4.3
3.7
17.2
16.9
3.9
3.2
Dr Reddy's
Neutral
3,856
-
65,746
17,443
20,296
22.3
22.4
156.7
180.1
24.6
21.4
4.9
4.1
21.8
20.8
3.7
3.2
Dishman Pharma
Buy
181
254
1,462
1,716
1,888
20.2
20.2
16.3
21.6
11.1
8.4
1.0
0.9
9.7
11.7
1.0
0.8
GSK Pharma*
Neutral
3,383
-
28,657
2,818
3,044
18.9
18.9
56.2
58.6
60.2
57.7
17.1
18.5
27.1
30.7
9.7
9.0
Indoco Remedies
Neutral
360
-
3,318
1,088
1,262
18.2
18.2
13.1
15.5
27.5
23.2
5.4
4.5
21.2
21.1
3.1
2.7
Ipca labs
Accumulate
694
736
8,751
3,533
4,109
18.6
19.6
28.2
34.8
24.6
19.9
3.4
2.9
15.0
15.9
2.7
2.3
Lupin
Neutral
1,618
-
72,769
14,864
17,244
26.9
26.9
62.1
71.1
26.1
22.8
6.3
5.0
27.4
24.6
4.6
3.9
Sun Pharma
Buy
824
950
198,260
27,839
33,542
27.7
29.7
18.9
26.9
43.6
30.6
3.9
3.5
13.0
14.6
6.5
5.1
Power
Tata Power
Neutral
71
-
19,270
38,302
38,404
14.1
13.1
5.1
6.0
13.9
11.9
1.3
1.3
9.2
10.3
1.4
1.4
NTPC
Neutral
134
-
110,572
89,067
98,329
15.9
16.5
12.1
13.1
11.1
10.3
1.2
1.2
11.0
11.6
2.3
2.2
Power Grid
Buy
141
170
73,530
19,986
22,702
86.2
86.3
11.1
12.7
12.7
11.1
1.7
1.5
14.4
14.7
8.8
8.2
Market Outlook
July 28, 2015
Stock Watch
Company Name
Reco
CMP
Target
Mkt Cap
Sales ( Čcr )
OPM(%)
EPS (Č)
PER(x)
P/BV(x)
RoE(%)
EV/Sales(x)
(Č)
Price ( Č)
( Č cr )
FY16E FY17E
FY16E
FY17E
FY16E
FY17E
FY16E
FY17E
FY16E
FY17E
FY16E
FY17E
FY16E
FY17E
Telecom
Bharti Airtel
Neutral
418
-
167,011
101,748
109,191
32.1
31.7
12.0
12.5
34.8
33.4
2.4
2.3
6.9
6.7
2.3
2.1
Idea Cellular
Neutral
172
-
61,808
34,282
36,941
32.0
31.5
5.9
6.2
29.1
27.7
2.7
2.4
9.9
9.3
2.4
2.2
zOthers
Abbott India
Neutral
4,306
-
9,149
2,713
3,141
13.7
13.5
127.8
145.7
33.7
29.6
7.9
6.4
25.9
23.9
3.1
2.6
Bajaj Electricals
Buy
271
341
2,736
4,719
5,287
5.2
5.8
8.6
12.7
31.7
21.4
3.6
3.2
11.4
14.8
0.6
0.5
Finolex Cables
Neutral
253
-
3,872
2,728
3,036
10.8
11.0
14.4
16.8
17.6
15.1
2.7
2.3
15.2
15.3
1.2
1.0
Goodyear India*
Neutral
564
-
1,300
1,536
1,683
9.6
10.0
41.8
48.0
13.5
11.7
2.3
2.0
18.2
18.3
0.6
0.5
Hitachi
Neutral
1,484
-
4,035
1,801
2,051
8.9
9.3
31.0
38.8
47.8
38.3
10.3
8.2
23.9
23.8
2.3
2.0
Jyothy Laboratories
Neutral
307
-
5,564
1,620
1,847
11.5
11.5
7.3
8.5
42.2
36.3
5.5
5.1
13.3
14.4
3.3
2.8
MRF
Accumulate
39,018
43,439
16,548
13,524
14,440
18.6
18.2
2,999.2
3,102.8
13.0
12.6
2.9
2.4
24.7
20.5
1.2
1.1
Page Industries
Neutral
14,233
-
15,875
1,929
2,450
19.8
20.1
229.9
299.0
61.9
47.6
27.3
19.0
52.1
47.1
8.3
6.5
Relaxo Footwears
Neutral
591
-
7,088
1,767
2,152
12.3
12.5
19.3
25.1
30.7
23.6
7.5
5.8
27.7
27.8
4.1
3.3
Siyaram Silk Mills
Neutral
1,186
-
1,112
1,653
1,873
11.7
12.2
99.3
122.1
11.9
9.7
2.2
1.8
19.5
20.2
0.8
0.7
Styrolution ABS India*
Neutral
728
-
1,280
1,271
1,440
8.6
9.2
32.0
41.1
22.7
17.7
2.3
2.1
10.7
12.4
1.0
0.8
Tree House
Accumulate
407
433
1,723
259
324
56.8
56.8
17.0
21.7
23.9
18.8
2.4
2.2
10.1
11.5
6.6
5.4
TVS Srichakra
Neutral
2,448
-
1,874
2,112
2,389
11.9
12.1
168.5
202.5
14.5
12.1
5.0
3.8
39.6
35.5
1.0
0.8
HSIL
Buy
327
434
2,361
2,085
2,436
18.5
18.6
21.7
28.9
15.1
11.3
1.5
1.4
10.0
12.1
1.3
1.0
Kirloskar Engines India
Accumulate
284
298
4,101
2,779
3,314
10.3
11.9
12.0
17.5
23.7
16.2
2.9
2.6
12.5
16.7
1.1
0.9
Ltd
M M Forgings
Buy
670
783
808
586
671
22.3
22.9
53.4
65.2
12.5
10.3
2.7
2.2
24.1
23.5
1.5
1.3
Banco Products (India)
Neutral
110
-
790
1,196
1,370
9.7
11.8
9.4
14.3
11.8
7.8
1.2
1.1
10.4
14.5
0.6
0.5
Competent Automobiles Neutral
180
-
110
1,007
1,114
3.1
3.1
23.7
28.2
7.6
6.4
1.1
0.9
13.9
14.6
0.1
0.1
Nilkamal
Neutral
816
-
1,218
1,947
2,131
8.1
8.3
35.7
45.9
22.9
17.8
2.3
2.0
10.3
12.1
0.7
0.6
Visaka Industries
Accumulate
147
166
233
1,158
1,272
8.6
9.5
23.7
32.7
6.2
4.5
0.6
0.6
10.1
12.5
0.4
0.3
Transport Corporation of
Accumulate
258
293
1,949
2,830
3,350
8.8
9.0
14.4
18.3
17.9
14.1
2.8
2.4
15.4
17.1
0.8
0.7
India
Elecon Engineering
Neutral
84
-
917
1,452
1,596
13.7
14.7
4.2
6.2
20.3
13.5
1.6
1.5
8.1
11.2
0.9
0.8
Surya Roshni
Accumulate
136
152
596
2,992
3,223
8.4
8.7
15.2
19.3
8.9
7.1
0.9
0.8
10.1
11.5
0.5
0.5
MT Educare
Buy
111
141
444
275
355
18.3
17.3
7.4
8.8
15.1
12.6
3.0
2.7
20.2
21.1
1.5
1.1
Radico Khaitan
Buy
89
112
1,185
1,565
1,687
11.9
12.4
5.4
6.6
16.5
13.5
1.3
1.2
8.0
9.0
1.3
1.2
Garware Wall Ropes
Buy
313
390
684
875
983
10.4
10.6
23.1
27.8
13.5
11.2
1.9
1.7
14.1
14.8
0.8
0.7
Source: Company, Angel Research; Note: *December year end; #September year end; &October year end; Price as on July 27, 2015
Market Outlook
July 28, 2015
Research Team Tel: 022 - 39357800
DISCLAIMER
Angel Broking Private Limited (hereinafter referred to as “Angel”) is a registered Member of National Stock Exchange of India Limited,
Bombay Stock Exchange Limited and MCX Stock Exchange Limited. It is also registered as a Depository Participant with CDSL and
Portfolio Manager with SEBI. It also has registration with AMFI as a Mutual Fund Distributor. Angel Broking Private Limited is a registered
entity with SEBI for Research Analyst in terms of SEBI (Research Analyst) Regulations, 2014 vide registration number INH000000164.
Angel or its associates has not been debarred/ suspended by SEBI or any other regulatory authority for accessing /dealing in securities
Market. Angel or its associates including its relatives/analyst do not hold any financial interest/beneficial ownership of more than 1% in
the company covered by Analyst. Angel or its associates/analyst has not received any compensation / managed or co-managed public
offering of securities of the company covered by Analyst during the past twelve months. Angel/analyst has not served as an officer,
director or employee of company covered by Analyst and has not been engaged in market making activity of the company covered by
Analyst.
This document is solely for the personal information of the recipient, and must not be singularly used as the basis of any investment
decision. Nothing in this document should be construed as investment or financial advice. Each recipient of this document should make
such investigations as they deem necessary to arrive at an independent evaluation of an investment in the securities of the companies
referred to in this document (including the merits and risks involved), and should consult their own advisors to determine the merits and
risks of such an investment.
Reports based on technical and derivative analysis center on studying charts of a stock's price movement, outstanding positions and
trading volume, as opposed to focusing on a company's fundamentals and, as such, may not match with a report on a company's
fundamentals.
The information in this document has been printed on the basis of publicly available information, internal data and other reliable sources
believed to be true, but we do not represent that it is accurate or complete and it should not be relied on as such, as this document is for
general guidance only. Angel Broking Pvt. Limited or any of its affiliates/ group companies shall not be in any way responsible for any
loss or damage that may arise to any person from any inadvertent error in the information contained in this report. Angel Broking Pvt.
Limited has not independently verified all the information contained within this document. Accordingly, we cannot testify, nor make any
representation or warranty, express or implied, to the accuracy, contents or data contained within this document. While Angel Broking
Pvt. Limited endeavors to update on a reasonable basis the information discussed in this material, there may be regulatory, compliance,
or other reasons that prevent us from doing so.
This document is being supplied to you solely for your information, and its contents, information or data may not be reproduced,
redistributed or passed on, directly or indirectly.
Neither Angel Broking Pvt. Limited, nor its directors, employees or affiliates shall be liable for any loss or damage that may arise from or
in connection with the use of this information.
Note: Please refer to the important ‘Stock Holding Disclosure' report on the Angel website (Research Section). Also, please refer to the
latest update on respective stocks for the disclosure status in respect of those stocks. Angel Broking Pvt. Limited and its affiliates may have
investment positions in the stocks recommended in this report.