Market Outlook
April 28, 2016
Market Cues
Domestic Indices
Chg (%)
(Pts)
(Close)
BSE Sensex
0.2
57
26,064
Indian markets are expected to open positive tracking the SGX Nifty and Asian cues.
Nifty
0.2
17
7,980
US markets recovered after an early downside after the US Fed left the interest rates
Mid Cap
0.1
14
11,105
unchanged as widely expected and its commentary indicating that the possibility of a
Small Cap
0.3
31
11,142
June rate hike remains, but without making any commitment.
Bankex
(0.9)
(169)
19,222
European markets got off to a weak start due to cautiousness ahead of the fed meet,
concerns over Greece and some mixed corporate results. However, rising crude oil
prices resulted in some positive movement in the later part of the day with markets
Global Indices
Chg (%)
(Pts)
(Close)
ending Wednesdays session with modest gains.
Dow Jones
0.3
51
18,042
Indian markets witnessed choppy trade before ending the day marginally higher
Nasdaq
(0.5)
(25)
4,863
ahead of the FOMC decision and the F&O expiry. Upstream players Cairn India, Oil
FTSE
0.6
35
6,320
India and ONGC rose between 1-3% after U.S. crude oil futures jumped more than
Nikkei
(0.4)
(63)
17,290
3% overnight, buoyed by a weaker dollar.
Hang Seng
(0.2)
(46)
21,362
News & Result Analysis
Shanghai Com
(0.4)
(11)
2,954
Result Review: Alembic Pharma, Elecon Engineering
Result Preview: HCL Tech
Advances / Declines
BSE
NSE
Detailed analysis on Pg2
Advances
1,282
748
Investor’s Ready Reckoner
Declines
1,322
793
Unchanged
170
92
Key Domestic & Global Indicators
Stock Watch: Latest investment recommendations on 150+ stocks
Volumes (` Cr)
Refer Pg7 onwards
BSE
2,500
Top Picks
NSE
17,772
CMP
Target
Upside
Company
Sector
Rating
(`)
(`)
(%)
Amara Raja
Auto & Auto Ancillary
Buy
940
1,076
14.5
Net Inflows (` Cr)
Net
Mtd
Ytd
HCL Tech
IT
Buy
838
1,038
23.9
FII
572
3,232
11,132
LIC Housing
Financials
Buy
463
592
27.8
MFs
181
(441)
2,638
Bharat Electronics
Capital Goods
Buy
1,213
1,414
16.6
Navkar Corporation Others
Buy
185
265
43.5
Top Gainers
Price (`)
Chg (%)
More Top Picks on Pg5
Aban
213
13.3
Key Upcoming Events
Ncc
82
5.7
Previous
Consensus
Date
Region
Event Description
Reading
Expectations
Bajajelec
232
5.7
Apr 28 US
Initial Jobless Claims (Thousands)
247
259
Muthootfin
209
5.4
Apr 28 Germany
Unemployment change (000's)
--
--
Monsanto
1,824
5.2
Apr 28 Eurozone
Consumer Confidence
(9.30)
(9.30)
May 1 Eurozone
Euro-Zone GDP s.a. (QoQ)
0.30
0.40
6.(
Top Losers
Price (`)
Chg (%)
More Events on Pg6
Nhpc
22
(6.5)
Sadbhav
272
(5.0)
Icicibank
245
(3.7)
Axisbank
466
(3.1)
Gruh
259
(2.5)
As on April 27, 2016
Market Outlook
April 28, 2016
Result Review
Alembic Pharma (CMP: `619 / TP: / Upside :)
Alembic Pharma announced its 4QFY2016 results, which were below expectations,
on the sales front. On the sales front, the company posted sales of `626cr V/s
`763cr expected, registering a yoy growth of 24.7%. The growth in the sales was
driven by the International formulation `190.2cr) which posted a yoy growth of
20%, while Indian formulation `259.6cr) posted a yoy 12% growth (the growth in
the segment was driven by the specialty segment by 13% yoy, while acute segment
grew by 7% yoy during the period). API business `166.9cr) posted a growth of
95% yoy.
On the operating front, the EBIDTA margin for the quarter was 22.8% V/s 20.0%
expected. The gross margins expanded to 80.8% V/s 65.4% during the last
corresponding period, however R&D expenditure during the quarter, which was
17.8% of sales in 4QFY2016 V/s 6.1% of sales during the corresponding period,
lead the margin expansion lower than GPM expansion. On the net profit front, the
company posted a net profit of `91.2cr V/s `93.4cr expected, posting a yoy
growth of 29.7%. We maintain our neutral rating on the stock.
Y/E
Sales OPM
PAT EPS ROE P/E P/BV EV/EBITDA EV/Sales
March
(` cr)
(%)
(` cr)
(`)
(%)
(x)
(x)
(x)
(x)
FY2016E
3,274
26.9
660
35.0
55.6
17.7
7.8
13.1
3.5
FY2017E
3,802
19.4
541
28.7
31.2
21.6
5.9
15.3
3.0
Elecon Engineering (CMP: `66/ TP: -/ Upside: -)
For 4QFY2016, Elecon Engineering reported a mixed set of numbers. Its
consolidated top-line reported de-growth of 10.6% on yoy basis to `415cr, which
is below our estimate of `489cr. The disappointing performance can be related to
the Material Handling Equipment (MHE) business as the standalone business
reported a 7.7% yoy growth to `190cr. However, the consolidated EBITDA margin
was able to sustain at 18.0% (18bp yoy decline) which can be attributed to
improved profitability of the Benzlers-Radicon business as well as improvement in
margins in the MHE business. The standalone gear business reported EBTIDA
margin contraction of 520bp yoy to 18.7% mainly owing to higher raw material
cost. On the bottom-line front, the consolidated net profit after adjusting for
minority interest declined by 10.5% yoy to `28cr while the standalone business
reported 31.8% yoy decline to `16cr due to higher operating expenses. The MHE
business is estimated to have posted a net profit of `25cr (assuming minority
interest of `10cr for 39.52%).
The company has announced that it will be merging the MHE business with the
company and as per the arrangement, the shareholders of Elecon EPC (MHE
business) will receive for every 2 (Two) Equity shares held, 37 (Thirty Seven) Equity
shares in Elecon. The company has announced that it will be focusing on the
products aspect of the MHE business in the future and the merger will deliver
economies of scale and financial benefits. At the current moment we maintain our
Neutral view on the stock and await further clarity on the overall performance of
the businesses as well as clarity on the merger.
Market Outlook
April 28, 2016
Result Preview
HCL Tech (CMP: `838 / TP: `1,038 / Upside: 23.9%)
HCL Tech for its 3QFY2016 numbers is likely to post a 2.6% QoQ growth to end
the period at US$1,607mn V/s US$1,566mn in 2QFY2016. In rupee terms, the
company is expected to post sales of `10,850cr V/s `10,341cr, a QoQ growth of
4.9%. On the operating front, the EBIDTA margins are likely to come in at 22.3%
V/s 21.5% in 2QFY2016. On EBIT front, the company is expected to come in at
20.7% V/s 20.0% in 2QFY2016. Thus the net profit is expected to come in at
`1,936cr V/s `1,920cr in 2QFY2016, a QoQ growth of 0.8%. We maintain our
buy with a price target of `838.
Y/E
Sales OPM
PAT EPS ROE P/E P/BV EV/EBITDA EV/Sales
March
(` cr)
(%)
(` cr)
(`)
(%)
(x)
(x)
(x)
(x)
FY2016E
42,038
21.2
7,216
51.1
21.5
16.4
3.5
11.0
2.3
FY2017E
47,503
21.5
8,142
57.7
18.8
14.5
2.7
8.6
1.9
Economic and Political News
Railways to harness 1000 Mw solar power by 2020
Pharma exports up 9.7%; 33% growth in US markets in FY16
DIPP moves cabinet note on 100% FDI in food processing
Corporate News
Tata Motors to issue NCDs to raise `300 crore
Yes Bank to raise over `16,500 cr via equity, debt
Nalco to go for toll-smelting of aluminium in Iran
Essar Oil to double CBM production this year
Market Outlook
April 28, 2016
Quarterly Bloomberg Brokers Consensus Estimate
Ambuja Cements Ltd. - April 28, 2016
Particulars (` cr)
4QFY16E
4QFY15
y-o-y (%)
3QFY15
q-o-q (%)
Net sales
2,485
2,425
2.5
2,356
5.5
EBITDA
393
510
(23.0)
328
19.9
EBITDA margin (%)
15.8
21.0
13.9
Net profit
248
318
(21.9)
110
125.7
Dabur India Ltd. Consol - April 28, 2016
Particulars (` cr)
4QFY16E
4QFY15
y-o-y (%)
3QFY15
q-o-q (%)
Net sales
2,081
1,945
7.0
2,122
(1.9)
EBITDA
388
346
12.2
378
2.5
EBITDA margin (%)
18.6
17.8
17.8
Net profit
319
285
12.1
319
0.2
ACC Ltd. - April 28, 2016
Particulars (` cr)
4QFY16E
4QFY15
y-o-y (%)
3QFY15
q-o-q (%)
Net sales
2,976
2,885
3.1
2,846
4.6
EBITDA
339
608
(44.3)
282
20.4
EBITDA margin (%)
11.4
21.1
9.9
Net profit
186
241
(22.6)
103
81.5
Idea Cellular Ltd. Consol - April 28, 2016
Particulars (` cr)
4QFY16E
4QFY15
y-o-y (%)
3QFY15
q-o-q (%)
Net sales
9,395
8,397
11.9
9,001
4.4
EBITDA
3,308
3,065
7.9
3,129
5.7
EBITDA margin (%)
35.2
36.5
34.8
Net profit
496
942
(47.3)
764
(35.1)
ICICI Bank Ltd. - April 29, 2016
Particulars (` cr)
4QFY16E
4QFY15
y-o-y (%)
3QFY15
q-o-q (%)
Net profit
3,061
2,922
4.8
3,018
1.4
Shriram Transport Finance Co.Ltd. - April 29, 2016
Particulars (` cr)
4QFY16E
4QFY15
y-o-y (%)
3QFY15
q-o-q (%)
Net profit
284
317
(10.4)
375
(24.4)
Market Outlook
April 28, 2016
Top Picks ★★★★★
Large Cap
Market Cap
CMP
Target
Upside
Company
Rationale
(` Cr)
(`)
(`)
(%)
To outpace battery industry growth due to better technological
Amara Raja Batteries
16,055
940
1,076
14.5
products leading to market share gains in both the automotive
OEM and replacement segments.
Uptick in defense capex by government when coupled with
Bharat Electronics
29,102
1,213
1,414
16.6
BELs strong market positioning, indicate that good times are
ahead for BEL.
The stock is trading at attractive valuations and is factoring all
HCL Tech
1,18,163
838
1,038
23.9
the bad news.
Strong visibility for a robust 20% earnings trajectory, coupled
HDFC Bank
2,84,257
1,124
1,262
12.3
with high quality of earnings on account of high quality retail
business and strategic focus on highly rated corporates.
Back on the growth trend, expect a long term growth of 14%
Infosys
2,85,751
1,240
1,374
10.8
to be a US$20bn in FY2020.
LICHF continues to grow its retail loan book at a healthy pace
with improvement in asset quality. We expect the company to
LIC Housing Finance
23,371
463
592
27.8
post a healthy loan book which is likely to reflect in a strong
earnings growth.
Huge bid pipeline of re-development works at Delhi and other
NBCC
12,105
1,009
1,089
8.0
State Governments and opportunity from Smart City, positions
NBCC to report strong growth, going forward.
Source: Company, Angel Research
Mid Cap
Market Cap
CMP
Target
Upside
Company
Rationale
(` Cr)
(`)
(`)
(%)
Favorable outlook for the AC industry to augur well for
Cooling products business which is out pacing the market
Blue Star
3,914
435
481
10.5
growth. EMPPAC division's profitability to improve once
operating environment turns around.
With a focus on the low and medium income (LMI) consumer
Dewan Housing
5,994
205
270
31.5
segment, the company has increased its presence in tier-II &
III cities where the growth opportunity is immense.
Commencement of new projects, downtrend in the interest
IL&FS Transport
2,505
76
93
22.1
rate cycle, to lead to stock re-rating
Economic recovery to have favourable impact on advertising
& circulation revenue growth. Further, the acquisition of a
Jagran Prakashan
5,340
163
205
25.5
radio business (Radio City) would also boost the company's
revenue growth.
Speedier execution and speedier sales, strong revenue visibilty
Mahindra Lifespace
1,828
445
554
24.4
in short-to-long run, attractive valuations
Massive capacity expansion along with rail advantage at ICD
Navkar Corporation
2,633
185
265
43.5
as well CFS augurs well for the company
Earnings boost on back of stable material prices and
Radico Khaitan
1,209
91
156
71.6
favourable pricing environment. Valuation discount to peers
provides additional comfort
Strong brands and distribution network would boost growth
Siyaram Silk Mills
1,008
1,075
1,354
26.0
going ahead. Stock currently trades at an inexpensive
valuation.
Source: Company, Angel Research
Market Outlook
April 28, 2016
Key Upcoming Events
Result Calendar
Date
Company
Apr 28, 2016
Ambuja Cements, ACC, Dabur India, HCL Tech, Sesa Goa
Apr 29, 2016
United Phosphorus, ICICI Bank, IDFC, Shriram Trans., Marico, Aventis, Interglobe Aviation
Apr 30, 2016
Federal Bank, L G Balakrishnan & Bros
May 2, 2016
HDFC
May 3, 2016
TVS Motor, Areva, Godrej Consumer, Adani Power
May 4, 2016
Mangalam Cement, Hexaware, Vesuvius India
May 9, 2016
MM Forging
May 10, 2016
Visaka Industries
May 11, 2016
Apollo Tyres, Kotak Mah. Bank, South Ind.Bank, Asian Paints, Quick Heal
May 12, 2016
Nestle, Dr Reddy's
May 13, 2016
Cadila Healthcare
Source: Bloomberg, Angel Research
Global economic events release calendar
Date
Time
Country
Event Description
Unit
Period
Bloomberg Data
Last Reported Estimated
Apr 28, 2016
6:00PM US
Initial Jobless claims
Thousands
Apr 23
247.00
259.00
1:25PM Germany
Unemployment change (000's)
Thousands
Apr
--
--
2:30PM Euro Zone
Euro-Zone Consumer Confidence
Value
Apr F
(9.30)
(9.30)
6:00PM US
GDP Qoq (Annualised)
% Change
1Q A
1.40
0.60
Apr 29, 2016
1:25PM Germany
PMI Manufacturing
Value
Apr F
51.90
51.90
May 1,, 2016 2:30PM Euro Zone
Euro-Zone GDP s.a. (QoQ)
% Change
1Q A
0.30
0.40
May 2,, 2016 6:30AM China
PMI Manufacturing
Value
Apr
50.20
50.30
May 3,, 2016 2:00PM UK
PMI Manufacturing
Value
Apr
51.00
--
May 4,, 2016 1:25PM Germany
PMI Services
Value
Apr F
54.60
54.60
May 6,, 2016 6:00PM US
Change in Nonfarm payrolls
Thousands
Apr
215.00
200.00
6:00PM US
Unnemployment rate
%
Apr
5.00
5.00
May 8,, 2016
China
Exports YoY%
% Change
Apr
11.50
--
May 10, 2016
India
Imports YoY%
% Change
Apr
(21.56)
--
India
Exports YoY%
% Change
Apr
(5.47)
--
7:00AM China
Consumer Price Index (YoY)
% Change
Apr
2.30
--
May 11, 2016 2:00PM UK
Industrial Production (YoY)
% Change
Mar
(0.50)
--
May 12, 2016 4:30PM UK
BOE Announces rates
% Ratio
May 12
0.50
0.50
5:30PM India
Industrial Production YoY
% Change
Mar
2.00
--
May 13, 2016
US
Producer Price Index (mom)
% Change
Apr
0.20
--
11:30AM Germany
GDP nsa (YoY)
% Change
1Q P
2.10
--
May 14, 201611:00AM China
Industrial Production (YoY)
% Change
Apr
6.80
--
Source: Bloomberg, Angel Research
Market Outlook
April 28, 2016
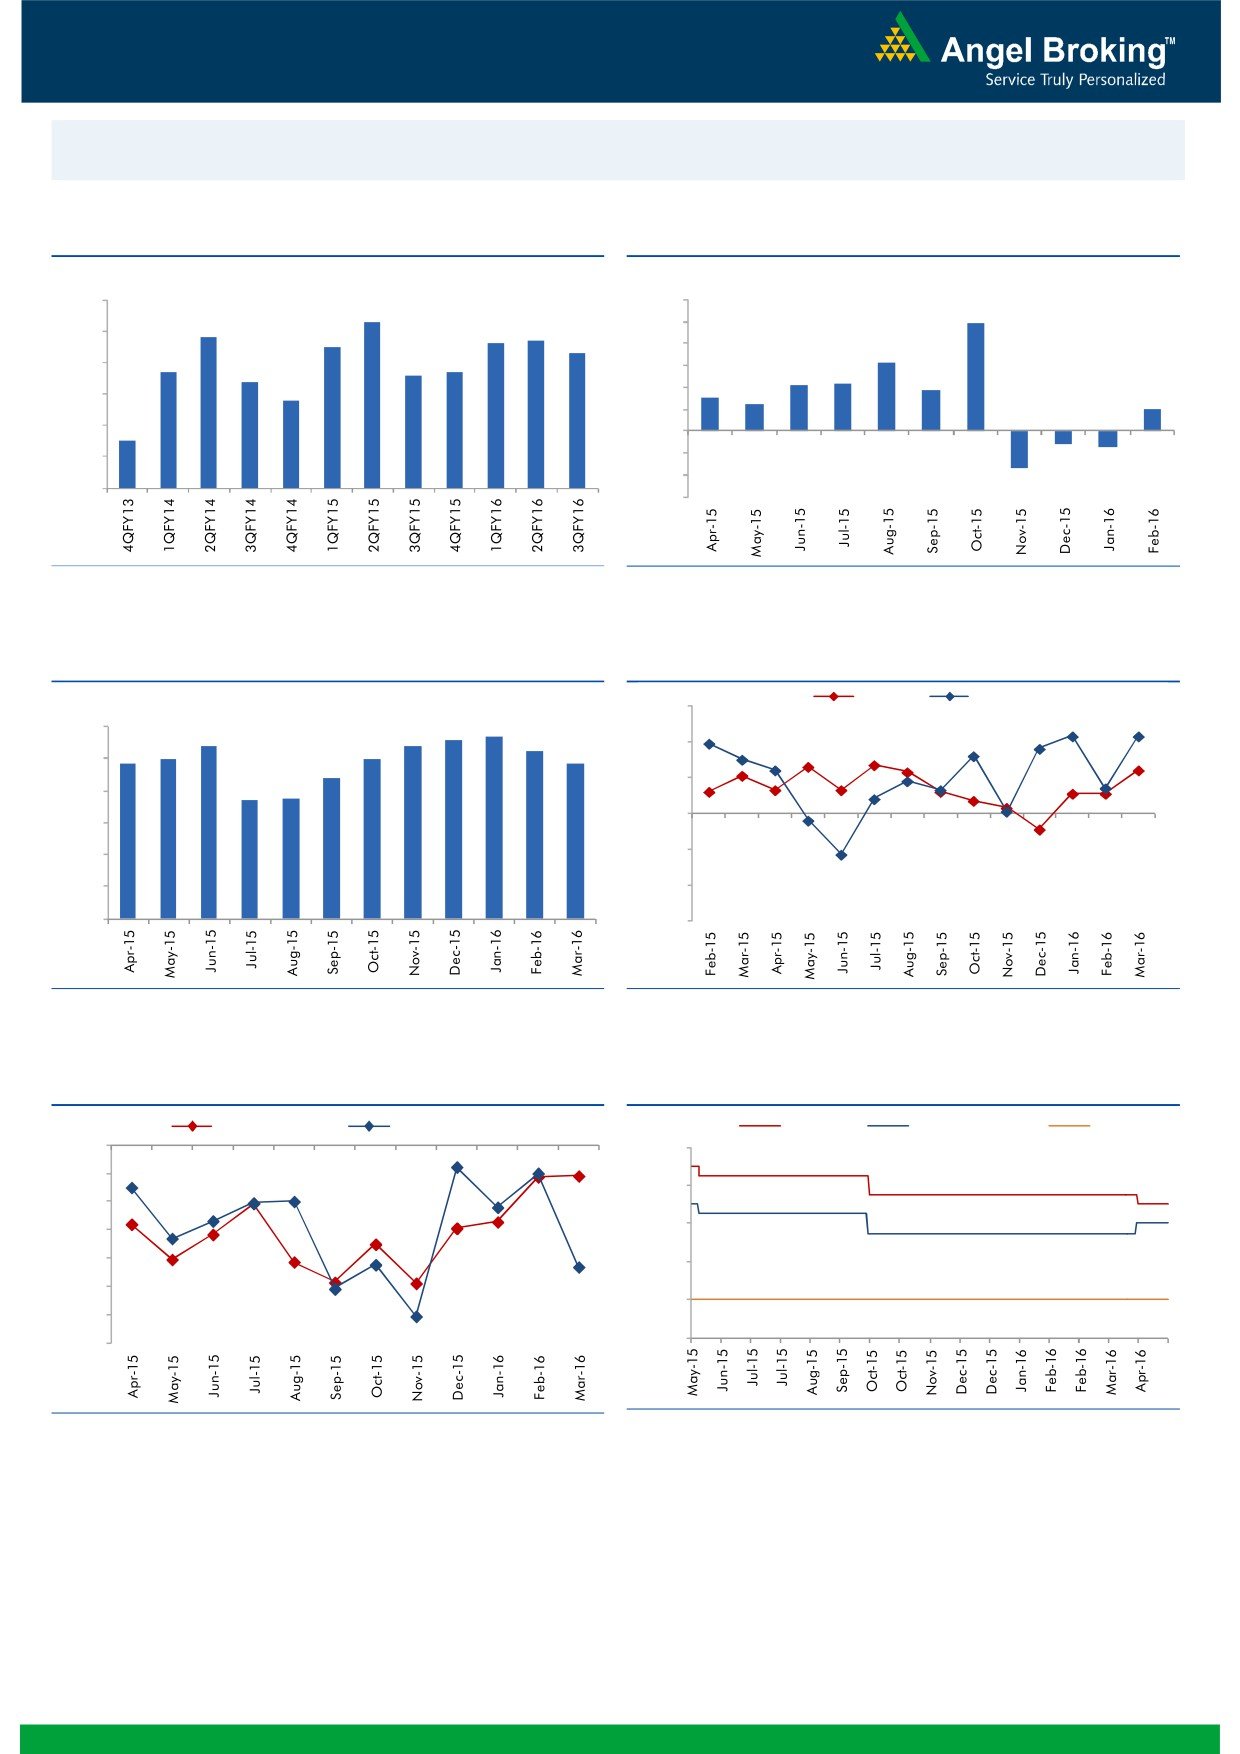
Macro watch
Exhibit 1: Quarterly GDP trends
Exhibit 2: IIP trends
(%)
(%)
9.0
12.0
8.3
9.9
7.8
7.7
10.0
8.0
7.5
7.6
7.3
8.0
6.3
6.7
6.6
6.7
7.0
6.4
6.0
4.2
4.3
3.7
5.8
3.0
4.0
2.5
6.0
2.0
2.0
5.0
4.5
-
4.0
(2.0)
(1.2)
(1.5)
(4.0)
3.0
(3.4)
(6.0)
Source: CSO, Angel Research
Source: MOSPI, Angel Research
Exhibit 3: Monthly CPI inflation trends
Exhibit 4: Manufacturing and services PMI
Mfg. PMI
Services PMI
(%)
56.0
5.6
5.7
6.0
5.4
5.4
5.3
5.0
5.0
54.0
4.9
4.8
5.0
4.4
3.7
3.7
52.0
4.0
50.0
3.0
2.0
48.0
1.0
46.0
-
44.0
Source: MOSPI, Angel Research
Source: Market, Angel Research; Note: Level above 50 indicates expansion
Exhibit 5: Exports and imports growth trends
Exhibit 6: Key policy rates
(%)
Exports yoy growth
Imports yoy growth
(%)
Repo rate
Reverse Repo rate
CRR
0.0
8.00
(5.0)
7.00
(10.0)
6.00
(15.0)
(20.0)
5.00
(25.0)
4.00
(30.0)
3.00
(35.0)
Source: Bloomberg, Angel Research
Source: RBI, Angel Research
Market Outlook
April 28, 2016
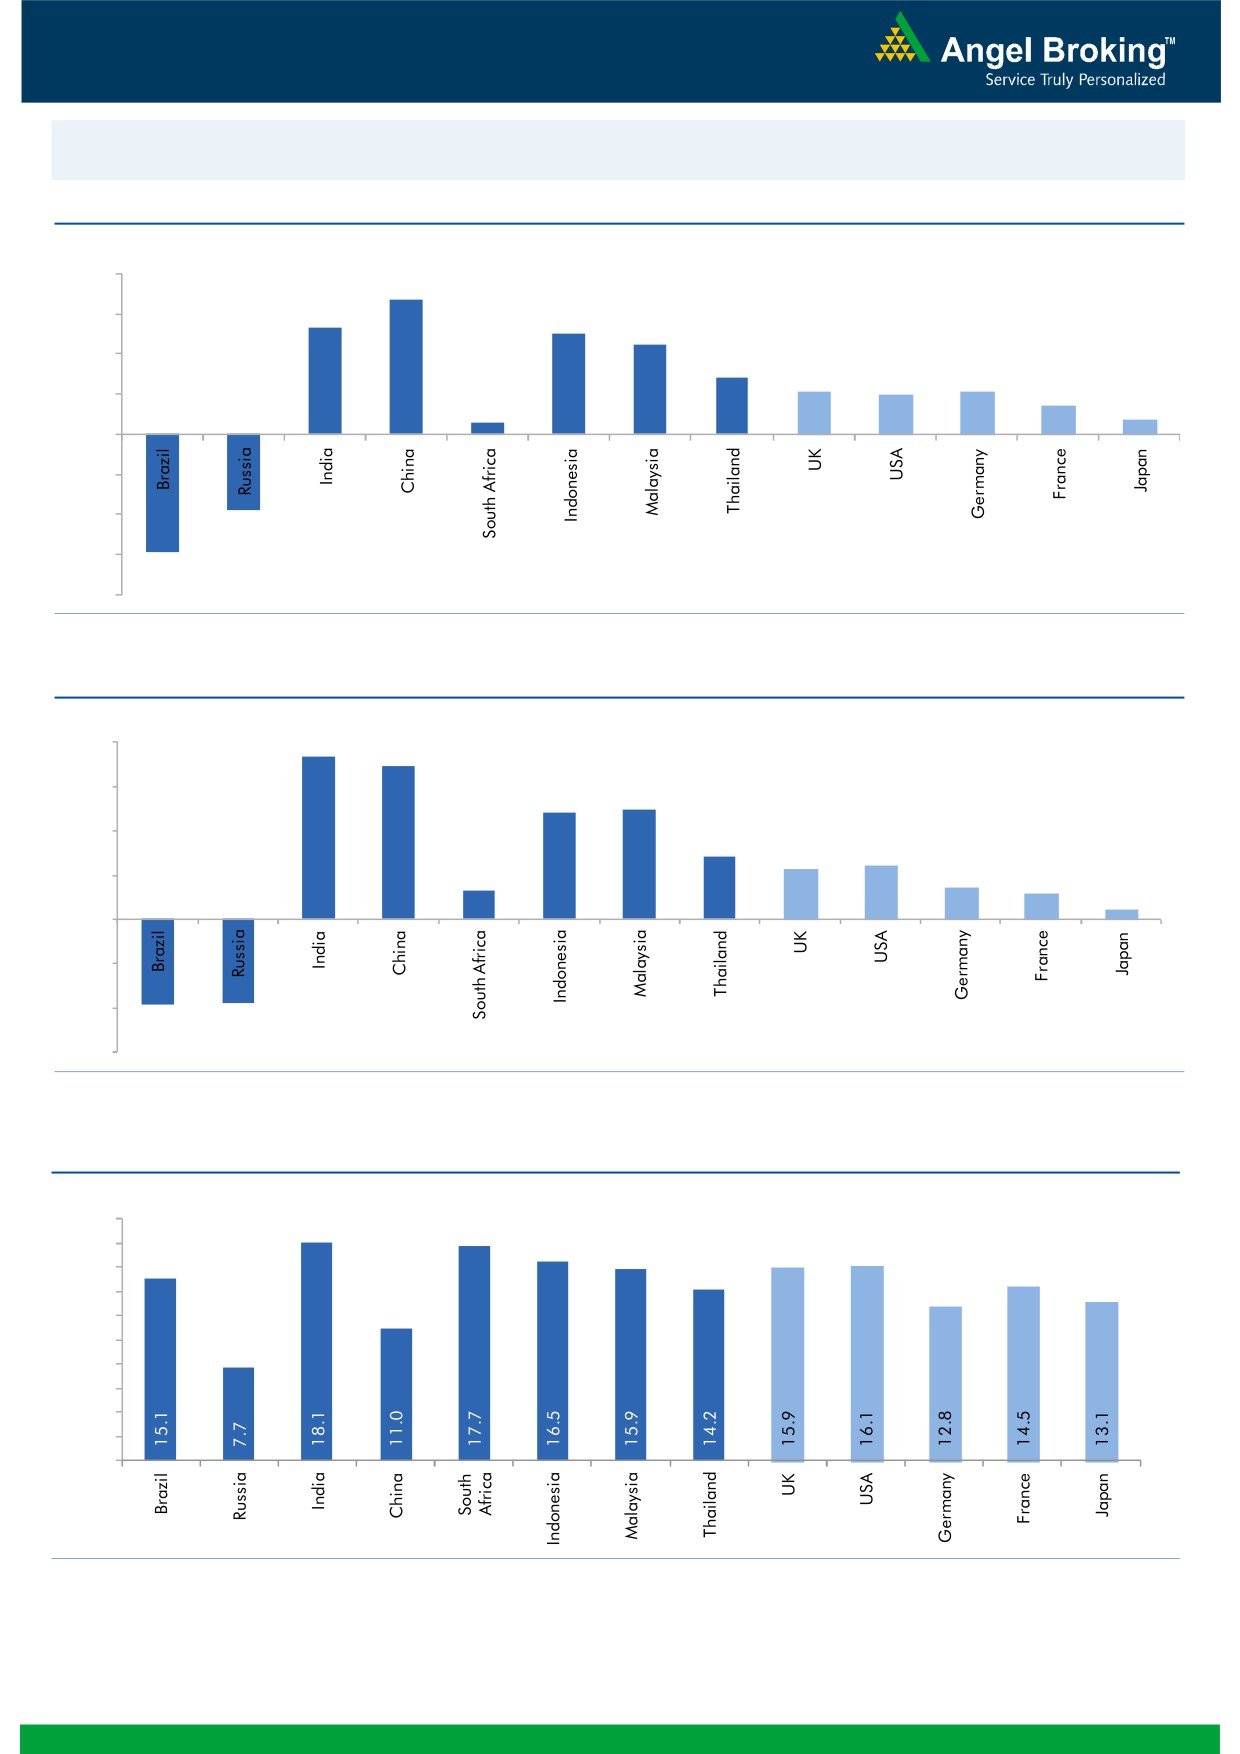
Global watch
Exhibit 1: Latest quarterly GDP Growth (%, yoy) across select developing and developed countries
(%)
8.0
6.7
6.0
5.3
5.0
4.5
4.0
2.8
2.1
2.0
2.1
1.4
2.0
0.6
0.7
-
(2.0)
(4.0)
(3.8)
(6.0)
(5.9)
(8.0)
Source: Bloomberg, Angel Research
Exhibit 2: 2015 GDP Growth projection by IMF (%, yoy) across select developing and developed countries
(%)
8.0
7.3
6.9
6.0
5.0
4.8
4.0
2.8
2.2
2.4
2.0
1.3
1.5
1.1
0.5
-
(2.0)
(4.0)
(3.8)
(3.7)
(6.0)
Source: IMF, Angel Research
Exhibit 3: One year forward P-E ratio across select developing and developed countries
(x)
20.0
18.0
16.0
14.0
12.0
10.0
8.0
6.0
4.0
2.0
-
Source: IMF, Angel Research
Market Outlook
April 28, 2016
Exhibit 4: Relative performance of indices across globe
Returns (%)
Country
Name of index
Closing price
1M
3M
1YR
Brazil
Bovespa
54,478
6.8
41.0
(2.9)
Russia
Micex
1,935
4.3
13.4
15.7
India
Nifty
7,980
4.7
8.3
(5.7)
China
Shanghai Composite
2,954
(0.5)
(0.4)
(29.7)
South Africa
Top 40
46,695
0.2
8.7
(4.6)
Mexico
Mexbol
45,942
(0.5)
10.3
(0.2)
Indonesia
LQ45
835
(0.9)
6.6
(11.7)
Malaysia
KLCI
1,692
(0.6)
4.1
(9.2)
Thailand
SET 50
897
0.5
16.4
(13.5)
USA
Dow Jones
18,042
2.7
13.3
(0.7)
UK
FTSE
6,320
3.5
6.9
(9.2)
Japan
Nikkei
17,290
0.9
3.5
(12.0)
Germany
DAX
10,300
2.4
5.4
(10.3)
France
CAC
4,559
2.5
5.1
(8.9)
Source: Bloomberg, Angel Research
Stock Watch
April 28, 2016
Company Name
Reco
CMP
Target
Mkt Cap
Sales ( Čcr )
OPM(%)
EPS (Č)
PER(x)
P/BV(x)
RoE(%)
EV/Sales(x)
(Č)
Price ( Č)
( Č cr )
FY16E FY17E
FY16E
FY17E
FY16E
FY17E
FY16E
FY17E
FY16E
FY17E
FY16E
FY17E
FY16E
FY17E
Agri / Agri Chemical
Rallis
Neutral
198
-
3,841
2,097
2,415
14.4
14.4
9.5
11.0
20.8
18.0
4.1
3.6
21.1
21.3
1.9
1.6
United Phosphorus
Neutral
515
-
22,067
12,500
14,375
18.3
18.3
29.8
35.9
17.3
14.3
3.2
2.7
20.0
20.3
1.9
1.5
Auto & Auto Ancillary
Ashok Leyland
Neutral
108
-
30,707
17,995
21,544
11.4
11.6
3.4
4.7
31.7
23.0
5.6
5.1
17.7
22.2
1.7
1.4
Bajaj Auto
Neutral
2,549
-
73,763
22,709
25,860
20.9
20.1
129.0
143.6
19.8
17.8
6.1
5.2
30.7
29.4
2.8
2.4
Bharat Forge
Accumulate
805
875
18,734
7,351
8,318
19.9
19.7
31.2
36.5
25.8
22.1
4.6
3.9
19.3
19.2
2.7
2.3
Eicher Motors
Neutral
20,114
-
54,633
15,556
16,747
15.5
17.3
464.8
597.5
43.3
33.7
15.8
11.6
36.2
34.3
3.4
3.1
Gabriel India
Accumulate
93
101
1,335
1,415
1,544
8.7
9.0
4.6
5.4
20.2
17.2
3.7
3.3
18.1
18.9
0.9
0.8
Hero Motocorp
Neutral
2,949
-
58,889
28,244
30,532
15.5
15.9
156.7
168.5
18.8
17.5
7.5
6.4
39.9
36.4
1.9
1.7
Jamna Auto Industries Accumulate
142
160
1,132
1,281
1,473
11.2
11.5
7.6
9.2
18.6
15.4
4.7
3.9
25.4
25.2
0.9
0.8
L G Balakrishnan & Bros Neutral
463
-
727
1,254
1,394
11.6
11.8
35.9
41.7
12.9
11.1
1.8
1.5
13.5
13.8
0.7
0.6
Mahindra and Mahindra Neutral
1,385
-
86,009
38,416
42,904
13.7
13.9
54.8
63.4
25.3
21.8
3.9
3.5
15.4
15.8
1.9
1.6
Maruti
Neutral
3,862
-
116,663
57,865
68,104
16.4
16.7
176.3
225.5
21.9
17.1
4.3
3.6
19.4
21.2
1.8
1.5
Minda Industries
Neutral
1,005
-
1,594
2,523
2,890
8.7
9.0
55.0
65.4
18.3
15.4
3.5
2.9
19.3
18.7
0.7
0.6
Motherson Sumi
Buy
263
313
34,795
39,343
45,100
8.8
9.1
10.1
12.5
26.0
21.0
8.3
6.5
35.3
34.4
1.0
0.8
Rane Brake Lining
Buy
376
465
298
454
511
11.5
12.0
25.2
31.0
14.9
12.1
2.2
2.0
14.9
16.6
0.8
0.7
Setco Automotive
Neutral
33
-
439
594
741
12.7
13.7
1.7
3.2
19.3
10.3
2.0
1.8
10.4
16.9
1.2
1.0
Tata Motors
Neutral
419
-
120,858
259,686
273,957
13.0
13.4
25.9
29.5
16.2
14.2
2.1
1.9
8.0
9.0
0.6
0.6
TVS Motor
Neutral
328
-
15,580
11,263
13,122
6.9
8.5
9.2
15.0
35.7
21.9
8.1
6.5
22.7
29.6
1.4
1.2
Amara Raja Batteries
Accumulate
940
1,076
16,055
4,892
5,871
17.4
17.6
28.8
37.1
32.6
25.3
7.6
6.1
23.4
24.1
3.2
2.6
Exide Industries
Accumulate
149
162
12,699
6,950
7,784
14.4
14.8
6.6
7.3
22.6
20.5
2.9
2.6
12.6
12.8
1.5
1.4
Apollo Tyres
Accumulate
166
183
8,470
12,056
12,714
17.2
16.4
23.0
20.3
7.2
8.2
1.3
1.1
17.7
13.6
0.7
0.8
Ceat
Neutral
1,120
-
4,530
6,041
6,597
14.1
13.7
99.5
111.9
11.3
10.0
2.2
1.9
19.6
18.5
0.9
0.8
JK Tyres
Neutral
85
-
1,936
7,446
7,669
15.2
14.0
19.6
18.4
4.4
4.6
1.1
0.9
25.2
19.5
0.7
0.6
Swaraj Engines
Neutral
1,160
-
1,441
552
630
14.2
14.7
44.6
54.1
26.0
21.4
6.0
5.5
23.2
25.6
2.5
2.1
Subros
Neutral
89
-
534
1,293
1,527
11.8
11.9
4.2
6.7
21.2
13.3
1.6
1.5
7.7
11.5
0.7
0.6
Indag Rubber
Neutral
174
-
457
283
329
17.0
17.2
13.0
15.4
13.4
11.3
2.9
2.4
21.8
21.6
1.3
1.1
Capital Goods
ACE
Neutral
40
-
392
660
839
4.7
8.2
1.0
3.9
39.7
10.2
1.2
1.1
3.2
11.3
0.7
0.6
BEML
Buy
939
1,157
3,909
3,277
4,006
6.0
8.9
36.2
64.3
25.9
14.6
1.8
1.6
5.7
11.7
1.3
1.0
Bharat Electronics
Buy
1,213
1,414
29,102
7,737
8,634
16.8
17.2
54.0
61.5
22.5
19.7
3.2
2.9
39.3
45.6
2.9
2.5
Stock Watch
April 28, 2016
Company Name
Reco
CMP
Target
Mkt Cap
Sales ( Čcr )
OPM(%)
EPS (Č)
PER(x)
P/BV(x)
RoE(%)
EV/Sales(x)
(Č)
Price ( Č)
( Č cr )
FY16E
FY17E
FY16E
FY17E
FY16E
FY17E
FY16E
FY17E
FY16E
FY17E
FY16E
FY17E
FY16E
FY17E
Capital Goods
Voltas
Buy
302
353
9,988
5,363
5,963
8.0
9.1
11.0
13.8
27.4
21.9
4.2
3.7
16.2
17.9
1.8
1.6
BGR Energy
Neutral
108
-
779
3,615
3,181
9.5
9.4
16.7
12.4
6.5
8.7
0.6
0.6
10.0
7.0
0.6
0.8
BHEL
Neutral
128
-
31,317
33,722
35,272
10.8
11.7
10.5
14.2
12.2
9.0
0.9
0.9
7.0
9.0
1.0
1.0
Blue Star
Accumulate
435
481
3,914
3,548
3,977
6.3
6.9
13.7
17.2
31.8
25.4
8.0
5.2
26.1
25.4
1.2
1.0
Crompton Greaves
Neutral
59
-
3,720
13,484
14,687
4.9
6.2
4.5
7.1
13.2
8.4
0.9
0.9
7.2
10.8
0.4
0.4
Greaves Cotton
Neutral
136
-
3,318
1,655
1,755
16.6
16.8
7.4
7.8
18.4
17.4
3.7
3.5
21.1
20.6
2.0
1.8
Inox Wind
Buy
270
458
5,986
4,980
5,943
17.0
17.5
26.6
31.6
10.1
8.5
3.0
2.2
35.0
30.0
1.4
1.1
KEC International
Neutral
127
-
3,261
8,791
9,716
6.1
6.8
5.4
8.2
23.5
15.5
2.4
2.2
10.0
14.0
0.6
0.5
Thermax
Neutral
777
-
9,264
6,413
7,525
7.4
8.5
30.5
39.3
25.5
19.8
3.9
3.4
15.0
17.0
1.4
1.2
VATech Wabag
Neutral
576
-
3,140
2,722
3,336
7.9
8.1
19.5
24.6
29.5
23.4
3.1
2.7
11.1
12.4
1.2
1.0
Cement
ACC
Neutral
1,429
-
26,836
13,151
14,757
16.4
18.3
63.9
83.4
22.4
17.1
2.9
2.6
13.3
16.1
1.9
1.6
Ambuja Cements
Neutral
225
-
34,980
11,564
12,556
19.4
20.7
8.9
10.1
25.3
22.3
3.2
3.0
12.8
13.8
2.7
2.4
HeidelbergCement
Neutral
95
-
2,156
1,772
1,926
13.3
15.4
1.0
3.0
95.2
31.7
2.4
2.2
2.6
7.9
1.8
1.6
India Cements
Neutral
89
-
2,732
4,216
4,840
18.0
19.5
4.0
9.9
22.2
9.0
0.9
0.8
4.0
9.5
1.0
0.8
JK Cement
Neutral
610
-
4,266
3,661
4,742
10.1
15.8
7.5
28.5
81.3
21.4
2.5
2.2
7.5
22.9
1.6
1.2
J K Lakshmi Cement
Neutral
360
-
4,241
2,947
3,616
16.7
19.9
11.5
27.2
31.3
13.3
3.0
2.6
9.8
20.8
1.9
1.5
Mangalam Cements
Neutral
274
-
733
1,053
1,347
10.5
13.3
8.4
26.0
32.7
10.6
1.4
1.3
4.3
12.5
1.1
0.8
Orient Cement
Neutral
151
-
3,088
1,854
2,524
21.2
22.2
7.7
11.1
19.6
13.6
2.8
2.4
13.3
15.7
2.4
1.7
Ramco Cements
Neutral
453
-
10,790
4,036
4,545
20.8
21.3
15.1
18.8
30.0
24.1
3.7
3.3
12.9
14.3
3.2
2.8
Shree Cement^
Neutral
12,739
-
44,378
7,150
8,742
26.7
28.6
228.0
345.5
55.9
36.9
8.2
6.9
15.7
20.3
6.0
4.8
UltraTech Cement
Neutral
3,189
-
87,529
24,669
29,265
18.2
20.6
82.0
120.0
38.9
26.6
4.2
3.7
11.3
14.7
3.6
3.1
Construction
ITNL
Buy
76
93
2,505
7,360
8,825
34.0
35.9
7.0
9.0
10.9
8.5
0.4
0.4
3.2
3.7
3.7
3.6
KNR Constructions
Accumulate
556
603
1,563
937
1,470
14.3
14.0
44.2
38.6
12.6
14.4
2.5
2.2
15.4
15.4
1.7
1.1
Larsen & Toubro
Neutral
1,277
-
119,023
58,870
65,708
8.3
10.3
42.0
53.0
30.4
24.1
2.1
1.9
8.8
11.2
2.2
2.0
Gujarat Pipavav Port
Neutral
170
-
8,214
629
684
51.0
52.2
6.4
5.9
26.6
28.8
3.5
3.2
15.9
12.7
12.7
11.5
MBL Infrastructures
Buy
148
285
612
2,313
2,797
12.2
14.6
19.0
20.0
7.8
7.4
0.8
0.8
11.3
10.6
1.0
0.9
Nagarjuna Const.
Neutral
82
-
4,556
7,892
8,842
8.8
9.1
3.0
5.3
27.3
15.5
1.4
1.3
5.0
8.5
0.8
0.7
PNC Infratech
Neutral
533
-
2,733
1,873
2,288
13.2
13.5
24.0
32.0
22.2
16.7
2.2
1.9
12.1
12.3
1.6
1.3
Simplex Infra
Neutral
272
-
1,345
5,955
6,829
10.3
10.5
16.0
31.0
17.0
8.8
0.9
0.8
5.3
9.9
0.7
0.6
Stock Watch
April 28, 2016
Company Name
Reco
CMP
Target
Mkt Cap
Sales ( Čcr )
OPM(%)
EPS (Č)
PER(x)
P/BV(x)
RoE(%)
EV/Sales(x)
(Č)
Price ( Č)
( Č cr )
FY16E
FY17E
FY16E
FY17E
FY16E
FY17E
FY16E
FY17E
FY16E
FY17E
FY16E
FY17E
FY16E
FY17E
Construction
Power Mech Projects
Neutral
605
-
890
1,539
1,801
12.8
12.7
59.0
72.1
10.3
8.4
1.5
1.3
18.6
16.8
0.6
0.5
Sadbhav Engineering
Accumulate
271
289
4,652
3,481
4,219
10.7
10.8
8.2
11.7
33.1
23.2
3.2
2.8
10.3
13.5
1.6
1.3
NBCC
Accumulate
1,009
1,089
12,105
5,816
7,382
6.9
7.7
29.6
39.8
34.1
25.4
6.1
4.8
24.1
26.7
1.8
1.4
MEP Infra
Neutral
44
-
715
1,956
1,876
28.1
30.5
1.3
3.0
33.9
14.7
7.1
4.8
21.2
32.8
1.8
1.8
SIPL
Neutral
100
-
3,515
675
1,042
62.4
64.7
-
-
3.7
4.3
-
-
16.9
11.4
Engineers India
Neutral
185
-
6,223
1,667
1,725
13.5
16.0
9.7
11.4
19.0
16.2
2.2
2.2
11.7
13.4
2.5
2.5
Financials
Allahabad Bank
Neutral
60
-
3,655
8,569
9,392
2.8
2.9
16.3
27.5
3.7
2.2
0.3
0.3
7.6
11.9
-
-
Axis Bank
Accumulate
466
494
110,948
26,473
31,527
3.5
3.6
35.7
43.5
13.0
10.7
2.2
1.9
17.9
18.9
-
-
Bank of Baroda
Neutral
161
-
37,132
18,485
21,025
1.9
2.0
13.5
21.1
12.0
7.6
1.0
0.8
7.3
10.6
-
-
Bank of India
Neutral
97
-
7,904
15,972
17,271
1.9
2.0
15.3
33.4
6.3
2.9
0.3
0.3
3.6
7.6
-
-
Canara Bank
Neutral
212
-
11,509
15,441
16,945
2.0
2.1
46.6
70.4
4.6
3.0
0.4
0.4
8.0
11.2
-
-
Dena Bank
Neutral
30
-
2,031
3,440
3,840
2.1
2.3
7.3
10.0
4.2
3.0
0.3
0.3
6.1
7.9
-
-
Dewan Housing Finance Buy
205
270
5,994
1,892
2,277
2.9
2.9
25.9
30.8
7.9
6.7
1.2
1.1
15.3
15.9
-
-
Federal Bank
Neutral
48
-
8,237
3,477
3,999
3.0
3.0
5.0
6.2
9.6
7.7
1.0
0.9
10.6
11.9
-
-
HDFC
Neutral
1,123
-
177,424
10,358
11,852
3.3
3.3
41.1
47.0
27.4
23.9
5.2
4.7
24.7
24.9
-
-
HDFC Bank
Accumulate
1,124
1,262
284,257
38,309
47,302
4.3
4.3
49.3
61.1
22.8
18.4
3.9
3.4
18.5
19.7
-
-
ICICI Bank
Neutral
245
-
142,352
34,279
39,262
3.3
3.3
21.0
24.4
11.7
10.0
2.0
1.7
14.4
14.7
-
-
IDBI Bank
Neutral
71
-
14,597
9,625
10,455
1.8
1.8
8.5
14.2
8.3
5.0
0.5
0.5
5.9
9.3
-
-
Indian Bank
Neutral
100
-
4,825
6,160
6,858
2.5
2.5
24.5
29.8
4.1
3.4
0.3
0.3
7.7
8.6
-
-
LIC Housing Finance
Buy
463
592
23,371
3,101
3,745
2.5
2.5
33.0
40.2
14.1
11.5
2.6
2.2
19.7
20.5
-
-
Oriental Bank
Neutral
96
-
3,087
7,643
8,373
2.4
2.4
37.2
45.4
2.6
2.1
0.2
0.2
8.2
9.4
-
-
Punjab Natl.Bank
Neutral
90
-
17,692
23,638
26,557
2.8
2.8
17.9
27.2
5.0
3.3
0.5
0.4
8.5
12.0
-
-
South Ind.Bank
Neutral
18
-
2,458
1,965
2,185
2.5
2.5
2.5
3.3
7.3
5.5
0.7
0.7
9.5
11.7
-
-
St Bk of India
Neutral
197
-
152,539
79,958
86,061
2.6
2.6
13.4
20.7
14.7
9.5
1.2
1.1
11.5
12.8
-
-
Union Bank
Neutral
132
-
9,057
12,646
14,129
2.3
2.4
31.0
39.1
4.3
3.4
0.5
0.4
9.8
11.4
-
-
Vijaya Bank
Neutral
32
-
2,975
3,536
3,827
1.9
1.9
5.5
6.7
5.8
4.8
0.5
0.4
7.8
8.8
-
-
Yes Bank
Neutral
916
-
38,504
7,190
9,011
3.2
3.3
58.2
69.7
15.7
13.1
2.8
2.4
19.2
19.6
-
-
FMCG
Asian Paints
Neutral
890
-
85,330
16,553
19,160
16.0
16.2
17.7
21.5
50.3
41.4
13.4
12.0
29.4
31.2
5.0
4.3
Britannia
Neutral
2,859
-
34,299
8,481
9,795
14.0
14.1
65.5
78.3
43.7
36.5
20.7
17.0
38.3
41.2
4.0
3.4
Stock Watch
April 28, 2016
Company Name
Reco
CMP
Target
Mkt Cap
Sales ( Čcr )
OPM(%)
EPS (Č)
PER(x)
P/BV(x)
RoE(%)
EV/Sales(x)
(Č)
Price ( Č)
( Č cr )
FY16E FY17E
FY16E
FY17E
FY16E
FY17E
FY16E
FY17E
FY16E
FY17E
FY16E
FY17E
FY16E
FY17E
FMCG
Colgate
Neutral
855
-
23,260
4,136
4,632
22.5
23.3
22.2
25.3
38.5
33.8
23.4
20.9
68.6
67.5
5.5
4.9
Dabur India
Neutral
272
-
47,893
9,370
10,265
17.6
17.3
7.3
8.1
37.1
33.6
9.6
8.8
31.7
30.6
4.9
4.5
GlaxoSmith Con*
Neutral
6,003
-
25,244
4,519
5,142
19.6
19.8
164.3
191.2
36.5
31.4
10.1
8.6
30.8
29.9
5.0
4.4
Godrej Consumer
Neutral
1,368
-
46,594
9,003
10,335
18.1
18.7
34.1
41.8
40.1
32.7
8.7
7.4
23.9
24.8
5.3
4.6
HUL
Neutral
893
-
193,240
33,299
35,497
17.1
17.1
18.9
20.0
47.3
44.7
23.9
27.5
87.6
80.8
5.6
5.3
ITC
Accumulate
333
359
268,213
36,804
38,776
37.9
37.9
12.2
12.9
27.3
25.8
7.6
6.7
27.7
25.8
6.9
6.5
Marico
Neutral
250
-
32,287
6,151
6,966
17.2
17.3
5.4
6.4
46.3
39.1
14.6
11.5
33.2
32.4
5.1
4.5
Nestle*
Neutral
5,889
-
56,776
9,393
10,507
22.2
22.3
106.8
121.8
55.1
48.4
19.4
17.4
34.8
36.7
5.8
5.2
Tata Global
Accumulate
122
137
7,725
8,635
9,072
9.8
9.9
5.8
7.2
21.1
17.0
1.9
1.8
6.8
7.4
0.9
0.9
Procter & Gamble
Accumulate
6,424
7,369
20,852
2,588
2,939
23.3
23.2
130.2
146.2
49.3
44.0
98.4
94.3
27.6
25.3
7.6
6.6
Hygiene
IT
HCL Tech^
Buy
838
1,038
118,163
42,038
47,503
21.2
21.5
51.5
57.7
16.3
14.5
3.5
2.7
21.5
18.8
2.4
1.9
Infosys
Accumulate
1,240
1,374
285,751
62,441
70,558
27.5
27.5
59.0
65.3
21.0
19.0
4.2
3.8
22.2
22.4
4.0
3.5
TCS
Buy
2,506
3,004
493,701
108,646
122,770
28.3
28.3
123.7
141.0
20.3
17.8
6.7
6.1
33.1
34.6
4.1
3.5
Tech Mahindra
Accumulate
480
530
46,540
26,524
29,177
16.2
17.0
28.8
33.6
16.7
14.3
3.2
2.7
19.3
19.1
1.5
1.3
Wipro
Buy
561
680
138,595
50,808
56,189
23.7
23.8
37.3
40.7
15.0
13.8
2.9
2.6
19.2
17.7
2.2
1.8
Media
D B Corp
Accumulate
331
356
6,074
2,025
2,187
27.4
27.4
17.4
18.9
19.0
17.5
4.3
3.9
22.9
23.7
3.0
2.7
HT Media
Neutral
90
-
2,097
2,495
2,673
12.9
13.2
6.8
7.2
13.3
12.5
1.0
1.0
7.5
7.8
0.4
0.4
Jagran Prakashan
Buy
163
205
5,340
2,170
2,355
27.2
26.2
8.9
9.9
18.4
16.5
3.9
3.4
20.9
20.5
2.4
2.2
Sun TV Network
Neutral
357
-
14,055
2,510
2,763
71.8
71.5
21.9
24.8
16.3
14.4
3.9
3.5
22.8
24.3
5.1
4.6
Hindustan Media
Neutral
257
-
1,888
914
1,016
21.7
21.5
21.9
23.3
11.7
11.1
2.1
1.8
18.0
16.2
1.5
1.3
Ventures
Metals & Mining
Coal India
Buy
291
380
183,585
76,167
84,130
19.9
22.3
22.4
25.8
13.0
11.3
4.7
4.6
35.5
41.0
1.7
1.6
Hind. Zinc
Neutral
172
-
72,866
14,641
14,026
50.4
50.4
17.7
16.0
9.8
10.8
1.5
1.4
16.2
13.2
2.6
2.5
Hindalco
Neutral
102
-
21,011
104,356
111,186
8.7
9.5
6.7
11.1
15.1
9.2
0.5
0.5
3.5
5.9
0.7
0.7
JSW Steel
Neutral
1,364
-
32,967
42,308
45,147
16.4
20.7
(10.3)
49.5
27.6
1.5
1.5
(1.0)
5.6
1.8
1.7
NMDC
Neutral
99
-
39,171
8,237
10,893
46.6
44.5
10.0
11.7
9.9
8.5
1.1
1.0
12.5
13.0
4.5
3.5
SAIL
Neutral
46
-
18,957
45,915
53,954
7.2
10.5
1.5
4.4
30.5
10.5
0.4
0.4
2.3
4.1
1.1
0.9
Vedanta
Neutral
105
-
31,085
71,445
81,910
26.2
26.3
12.9
19.2
8.1
5.5
0.6
0.5
7.2
8.9
0.9
0.7
Tata Steel
Neutral
357
-
34,634
126,760
137,307
8.9
11.3
6.4
23.1
56.1
15.5
1.1
1.1
2.0
7.1
0.9
0.8
Oil & Gas
Cairn India
Neutral
147
-
27,607
11,323
12,490
49.4
51.0
20.7
20.7
7.1
7.1
0.5
0.4
6.4
6.1
1.5
0.9
Stock Watch
April 28, 2016
Company Name
Reco
CMP
Target
Mkt Cap
Sales ( Čcr )
OPM(%)
EPS (Č)
PER(x)
P/BV(x)
RoE(%)
EV/Sales(x)
(Č)
Price ( Č)
( Č cr )
FY16E FY17E
FY16E
FY17E
FY16E
FY17E
FY16E
FY17E
FY16E
FY17E
FY16E
FY17E
FY16E
FY17E
Oil & Gas
GAIL
Neutral
373
-
47,333
64,856
70,933
9.1
9.6
24.0
28.9
15.6
12.9
1.3
1.2
8.8
9.6
0.9
0.8
ONGC
Neutral
222
-
189,632
154,564
145,998
36.8
37.4
20.8
22.6
10.7
9.8
1.0
0.9
10.1
9.7
1.4
1.6
Petronet LNG
Neutral
264
-
19,766
29,691
31,188
5.8
6.2
12.8
13.4
20.6
19.6
3.1
2.7
15.8
14.8
0.7
0.7
Indian Oil Corp
Neutral
437
-
106,138
359,607
402,760
5.9
6.1
42.5
48.7
10.3
9.0
1.4
1.2
14.1
14.4
0.4
0.4
Reliance Industries
Accumulate
1,020
1,150
330,421
304,775
344,392
12.6
13.4
91.3
102.6
11.2
9.9
1.3
1.1
11.8
12.0
1.0
0.8
Pharmaceuticals
Alembic Pharma
Neutral
619
-
11,663
3,274
3,802
26.9
19.4
35.0
28.7
17.7
21.6
7.8
5.9
55.6
31.2
3.5
3.0
Aurobindo Pharma
Accumulate
765
856
44,742
14,923
17,162
22.0
23.0
35.7
42.8
21.4
17.9
6.3
4.7
34.0
30.2
3.4
2.9
Aventis*
Neutral
4,382
-
10,093
2,082
2,371
17.4
20.8
118.2
151.5
37.1
28.9
5.4
4.4
19.9
25.5
4.5
3.8
Cadila Healthcare
Accumulate
327
352
33,456
10,224
11,840
21.0
22.0
14.6
17.6
22.4
18.6
6.1
4.8
30.8
29.0
3.3
2.8
Cipla
Accumulate
539
605
43,262
13,979
16,447
20.2
18.6
25.7
27.5
21.0
19.6
3.4
2.9
17.6
16.1
3.1
2.6
Dr Reddy's
Buy
3,130
3,933
53,380
16,838
19,575
25.0
23.1
167.5
178.8
18.7
17.5
3.9
3.3
23.1
20.4
3.1
2.6
Dishman Pharma
Neutral
346
-
2,792
1,733
1,906
21.5
21.5
17.0
19.9
20.4
17.4
2.1
1.9
10.5
11.2
2.1
1.8
GSK Pharma*
Neutral
3,757
-
31,821
2,870
3,158
20.0
22.1
59.5
68.3
63.1
55.0
18.6
19.1
28.5
34.3
10.6
9.7
Indoco Remedies
Neutral
273
-
2,512
1,033
1,199
15.9
18.2
9.4
13.6
29.0
20.0
4.3
3.7
15.7
19.7
2.5
2.2
Ipca labs
Buy
496
900
6,261
3,363
3,909
12.9
18.6
13.4
28.0
37.0
17.7
2.7
2.3
7.4
14.0
2.2
1.8
Lupin
Neutral
1,570
-
70,768
13,092
16,561
25.0
27.0
50.4
68.3
31.2
23.0
6.4
5.1
22.8
24.7
5.1
3.9
Sun Pharma
Buy
814
950
195,879
28,163
32,610
25.8
30.7
17.4
26.9
46.8
30.3
4.4
3.8
13.0
16.6
6.4
5.3
Power
Tata Power
Neutral
71
-
19,135
35,923
37,402
22.6
22.8
4.1
5.2
17.5
13.7
1.3
1.3
7.5
9.3
1.5
1.4
NTPC
Neutral
141
-
116,014
87,271
99,297
23.5
23.5
11.8
13.3
12.0
10.6
1.3
1.3
11.5
12.2
2.4
2.1
Power Grid
Buy
144
170
75,440
20,702
23,361
86.7
86.4
12.1
13.2
11.9
10.9
1.8
1.6
15.6
15.1
8.6
8.0
Real Estate
MLIFE
Buy
445
554
1,828
697
1,011
14.9
19.3
13.8
20.1
32.3
22.2
1.2
1.2
3.8
5.3
3.9
2.7
Telecom
Bharti Airtel
Neutral
373
-
149,163
101,748
109,191
32.1
31.7
12.0
12.5
31.1
29.9
2.1
2.0
6.9
6.7
2.1
1.9
Idea Cellular
Neutral
125
-
45,006
34,282
36,941
32.0
31.5
5.9
6.2
21.2
20.2
1.9
1.8
9.9
9.3
1.9
1.8
zOthers
Abbott India
Neutral
4,654
-
9,889
2,715
3,153
14.5
14.1
134.3
152.2
34.7
30.6
8.7
7.1
27.4
25.6
3.4
2.8
Bajaj Electricals
Neutral
232
-
2,346
4,719
5,287
5.2
5.8
8.6
12.7
27.2
18.4
3.1
2.7
11.4
14.8
0.5
0.4
Finolex Cables
Neutral
281
-
4,302
2,520
2,883
12.2
12.0
12.7
14.2
22.2
19.8
3.0
2.7
13.6
13.5
1.5
1.2
Goodyear India*
Accumulate
518
582
1,194
1,800
1,600
11.7
11.5
58.7
52.9
8.8
9.8
2.0
1.7
24.6
18.7
0.4
0.4
Hitachi
Neutral
1,375
-
3,738
1,779
2,081
7.8
8.8
21.8
33.4
63.1
41.1
10.2
8.2
17.4
22.1
2.2
1.8
Jyothy Laboratories
Neutral
302
-
5,464
1,620
1,847
11.5
11.5
7.3
8.5
41.4
35.6
5.4
5.0
13.3
14.4
3.2
2.8
Stock Watch
April 28, 2016
Company Name
Reco
CMP
Target
Mkt Cap
Sales ( Čcr )
OPM(%)
EPS (Č)
PER(x)
P/BV(x)
RoE(%)
EV/Sales(x)
(Č)
Price ( Č)
( Č cr )
FY16E
FY17E
FY16E
FY17E
FY16E
FY17E
FY16E
FY17E
FY16E
FY17E
FY16E
FY17E
FY16E
FY17E
zOthers
MRF
Buy
34,788
45,575
14,754
20,316
14,488
21.4
21.1
5,488.0
3,798.0
6.3
9.2
2.2
1.8
41.1
21.2
0.7
0.9
Page Industries
Neutral
12,948
-
14,442
1,929
2,450
19.8
20.1
229.9
299.0
56.3
43.3
24.9
17.3
52.1
47.1
7.5
5.9
Relaxo Footwears
Neutral
504
-
6,055
1,767
2,152
12.3
12.5
19.3
25.1
26.2
20.1
6.4
4.9
27.7
27.8
3.5
2.8
Siyaram Silk Mills
Buy
1,075
1,354
1,008
1,636
1,815
11.5
11.5
89.9
104.1
12.0
10.3
2.0
1.7
17.9
17.8
0.8
0.7
Styrolution ABS India* Neutral
618
-
1,087
1,271
1,440
8.6
9.2
32.0
41.1
19.3
15.1
2.0
1.8
10.7
12.4
0.8
0.7
TVS Srichakra
Buy
2,290
3,217
1,753
2,035
2,252
15.9
15.3
248.6
268.1
9.2
8.5
4.0
2.9
43.6
33.9
0.9
0.8
HSIL
Neutral
300
-
2,170
2,123
2,384
16.1
16.5
15.0
18.9
20.0
15.9
1.6
1.4
8.0
9.4
1.4
1.2
Kirloskar Engines India
Neutral
243
-
3,511
2,403
2,554
8.6
9.9
9.2
10.5
26.4
23.2
2.5
2.4
9.7
10.7
1.1
1.0
Ltd
M M Forgings
Buy
463
614
559
511
615
21.7
21.6
43.1
55.8
10.7
8.3
2.0
1.6
19.9
21.2
1.3
1.0
Banco Products (India) Neutral
135
-
968
1,208
1,353
11.0
12.3
10.8
14.5
12.6
9.3
1.4
1.3
11.9
14.5
0.8
0.7
Competent Automobiles Neutral
163
-
100
1,040
1,137
3.2
3.1
25.7
28.0
6.4
5.8
1.0
0.8
15.0
14.3
0.1
0.1
Nilkamal
Neutral
1,272
-
1,898
1,871
2,031
10.7
10.5
63.2
69.8
20.1
18.2
3.3
2.8
17.6
16.6
1.1
0.9
Visaka Industries
Buy
119
143
189
1,020
1,120
8.7
9.1
13.9
20.1
8.5
5.9
0.6
0.5
6.4
8.7
0.4
0.4
Transport Corporation of
Neutral
270
-
2,056
2,830
3,350
8.8
9.0
14.4
18.3
18.8
14.8
2.9
2.5
15.4
17.1
0.9
0.7
India
Elecon Engineering
Neutral
66
-
721
1,359
1,482
10.3
13.7
0.8
3.9
82.4
17.0
1.4
1.3
1.6
7.8
0.9
0.8
Surya Roshni
Buy
155
201
680
2,992
3,223
8.1
8.4
14.7
18.3
10.6
8.5
1.0
0.9
9.7
11.0
0.5
0.5
MT Educare
Neutral
172
-
685
286
366
18.3
17.7
7.7
9.4
22.3
18.4
4.7
4.1
20.2
21.1
2.3
1.7
Radico Khaitan
Buy
91
156
1,209
1,517
1,635
12.7
13.4
5.8
7.1
15.6
12.8
1.3
1.2
8.6
9.6
1.3
1.2
Garware Wall Ropes
Buy
363
473
794
862
974
11.2
11.2
24.9
29.6
14.6
12.3
2.2
1.9
15.1
15.4
0.9
0.8
Wonderla Holidays
Neutral
387
-
2,186
206
308
44.0
43.6
9.0
12.9
43.0
30.0
5.9
5.3
13.7
17.8
10.5
7.0
Linc Pen & Plastics
Neutral
192
-
285
340
371
8.3
8.9
10.8
13.2
17.8
14.6
2.9
2.5
16.0
17.1
0.9
0.8
The Byke Hospitality
Neutral
160
-
642
222
287
20.5
20.5
5.6
7.6
28.4
21.2
5.4
4.4
18.9
20.8
2.9
2.3
Interglobe Aviation
Neutral
1,048
-
37,755
17,022
21,122
20.7
14.5
63.9
53.7
16.4
19.5
24.6
20.1
149.9
103.2
2.2
1.8
Coffee Day Enterprises
Neutral
271
-
5,579
2,692
2,964
17.0
18.6
-
4.7
-
57.2
3.3
3.1
0.2
5.5
2.5
2.3
Ltd
Navneet Education
Neutral
89
-
2,114
998
1,062
24.1
24.0
5.8
6.1
15.4
14.6
3.4
3.0
22.0
20.6
2.2
2.1
Navkar Corporation
Buy
185
265
2,633
365
436
38.3
37.5
5.6
5.9
32.8
31.4
2.1
1.9
6.3
6.1
8.0
6.9
UFO Moviez
Neutral
532
-
1,464
558
619
32.0
33.2
22.5
30.0
23.6
17.8
2.8
2.5
12.0
13.8
2.5
2.1
VRL Logistics
Neutral
421
-
3,843
1,725
1,902
16.5
16.7
12.2
14.6
34.6
28.9
7.2
6.3
20.8
21.9
2.4
2.1
Team Lease Serv.
Neutral
960
-
1,642
2,565
3,229
1.3
1.5
15.2
22.8
63.3
42.2
5.1
4.5
8.0
10.7
0.5
0.4
Stock Watch
April 28, 2016
Company Name
Reco
CMP
Target Mkt Cap
Sales ( Čcr )
OPM(%)
EPS (Č)
PER(x)
P/BV(x)
RoE(%)
EV/Sales(x)
(Č)
Price ( Č)
( Č cr )
FY16E FY17E FY16E FY17E FY16E FY17E FY16E FY17E FY16E FY17E FY16E FY17E FY16E FY17E
zOthers
S H Kelkar & Co.
Neutral
232
-
3,357
928
1,036
15.3
15.1
4.9
6.1
47.0
38.0
4.4
4.1
9.4
10.7
3.5
3.1
Quick Heal
Neutral
274
-
1,917
339
408
27.8
27.3
7.1
7.7
38.7
35.4
3.3
3.3
8.5
9.3
4.6
3.8
Narayana Hrudaya
Neutral
300
-
6,133
1,603
1,873
10.9
11.5
1.0
2.6
315.0
113.5
7.6
7.0
2.4
6.1
4.0
3.4
Manpasand Bever.
Neutral
540
-
2,703
540
836
19.9
19.6
10.2
16.9
52.7
32.0
4.3
3.8
8.1
12.0
4.7
3.0
Source: Company, Angel Research; Note: *December year end; #September year end; &October year end; Price as on April 27, 2016
Market Outlook
April 28, 2016
Research Team Tel: 022 - 39357800
DISCLAIMER
Angel Broking Private Limited (hereinafter referred to as “Angel”) is a registered Member of National Stock Exchange of India Limited,
Bombay Stock Exchange Limited and Metropolitian Stock Exchange of India Limited. It is also registered as a Depository Participant with
CDSL and Portfolio Manager with SEBI. It also has registration with AMFI as a Mutual Fund Distributor. Angel Broking Private Limited is a
registered entity with SEBI for Research Analyst in terms of SEBI (Research Analyst) Regulations, 2014 vide registration number
INH000000164. Angel or its associates has not been debarred/ suspended by SEBI or any other regulatory authority for accessing
/dealing in securities Market. Angel or its associates including its relatives/analyst do not hold any financial interest/beneficial ownership
of more than 1% in the company covered by Analyst. Angel or its associates/analyst has not received any compensation / managed or co
-managed public offering of securities of the company covered by Analyst during the past twelve months. Angel/analyst has not served as
an officer, director or employee of company covered by Analyst and has not been engaged in market making activity of the company
covered by Analyst.
This document is solely for the personal information of the recipient, and must not be singularly used as the basis of any investment
decision. Nothing in this document should be construed as investment or financial advice. Each recipient of this document should make
such investigations as they deem necessary to arrive at an independent evaluation of an investment in the securities of the companies
referred to in this document (including the merits and risks involved), and should consult their own advisors to determine the merits and
risks of such an investment.
Reports based on technical and derivative analysis center on studying charts of a stock's price movement, outstanding positions and
trading volume, as opposed to focusing on a company's fundamentals and, as such, may not match with a report on a company's
fundamentals.
The information in this document has been printed on the basis of publicly available information, internal data and other reliable sources
believed to be true, but we do not represent that it is accurate or complete and it should not be relied on as such, as this document is for
general guidance only. Angel Broking Pvt. Limited or any of its affiliates/ group companies shall not be in any way responsible for any
loss or damage that may arise to any person from any inadvertent error in the information contained in this report. Angel Broking Pvt.
Limited has not independently verified all the information contained within this document. Accordingly, we cannot testify, nor make any
representation or warranty, express or implied, to the accuracy, contents or data contained within this document. While Angel Broking
Pvt. Limited endeavors to update on a reasonable basis the information discussed in this material, there may be regulatory, compliance,
or other reasons that prevent us from doing so.
This document is being supplied to you solely for your information, and its contents, information or data may not be reproduced,
redistributed or passed on, directly or indirectly.
Neither Angel Broking Pvt. Limited, nor its directors, employees or affiliates shall be liable for any loss or damage that may arise from or
in connection with the use of this information.
Note: Please refer to the important ‘Stock Holding Disclosure' report on the Angel website (Research Section). Also, please refer to the
latest update on respective stocks for the disclosure status in respect of those stocks. Angel Broking Pvt. Limited and its affiliates may have
investment positions in the stocks recommended in this report.