Market Outlook
March 28, 2016
Market Cues
Domestic Indices
Chg (%)
(Pts)
(Close)
Indian market is expected to open on a flat note tracking the SGX Nifty.
BSE Sensex
0.0
7
25,338
Nifty
0.0
2
7,717
US indices ended on a flat note ahead of the long weekend led by profit taking
along with concerns about the outlook for interest rates following comments from St.
Mid Cap
0.2
26
10,524
Louis Federal Reserve President James Bullard since the Fed's economic outlook
Small Cap
0.2
25
10,502
suggest the next rate hike" may not be far off provided that the economy evolves as
Bankex
(0.2)
(43)
18,110
expected."
The European markets ended Thursday's session firmly in negative territory. The
Global Indices
Chg (%)
(Pts)
(Close)
markets opened notably lower after the weak performance of the Asian markets.
Dow Jones
0.1
13
17,516
Continued weakness in commodity prices caused further weakness in energy and
Nasdaq
0.1
5
4,774
resource stocks. Trading activity was also on the light side ahead of tomorrow's
FTSE
(1.5)
(93)
6,106
Good Friday holiday.
Nikkei
(0.3)
(48)
17,001
Indian shares ended a choppy session marginally higher, as hopes of a rate cut by
Hang Seng
(0.2)
(52)
20,615
RBI and renewed foreign fund flows helped investors shrug off geopolitical worries in
the aftermath of the Brussels bombings. Metal stocks, Tata Steel and Hindalco rose
Shanghai Com
0.4
11
3,010
2-4% backed by signs of revival in China's housing market.
Advances / Declines
BSE
NSE
News & Result Analysis
Advances
1,287
759
BHEL Commissions 600MW power plant in Telangana
Declines
1,320
783
Detailed analysis on Pg2
Unchanged
179
86
Investor’s Ready Reckoner
Key Domestic & Global Indicators
Volumes (` Cr)
Stock Watch: Latest investment recommendations on 150+ stocks
BSE
3,106
Refer Pg4 onwards
NSE
15,927
Top Picks
Net Inflows (` Cr)
Net
Mtd
Ytd
CMP
Target
Upside
Company
Sector
Rating
(`)
(`)
(%)
FII
1,130
17,371
(22,069)
Amara Raja Batteries Auto & Auto Ancillary
Buy
902
1,040
15.2
MFs
(335)
(4,125)
70,694
HCL Tech
IT
Buy
818
1,038
26.9
LIC Housing Finance Financials
Buy
478
592
23.8
Top Gainers
Price (`)
Chg (%)
Bharat Electronics
Capital Goods
Buy
1,202
1,414
17.7
Monsanto
1,818
12.7
Navkar Corporation Others
Buy
164
265
61.4
More Top Picks on Pg3
Neyvelilig
75
11.6
Mrpl
64
7.5
Key Upcoming Events
Mphasis
499
7.4
Previous
Consensus
Date
Region
Event Description
Reading
Expectations
Mmtc
39
6.0
Apr 1 China
PMI Manufacturing
49.00
---
Apr 5 India
RBI Repo Rate
6.75%
---
Top Losers
Price (`)
Chg (%)
Apr 8 India
Imports YoY%
(5.00)
---
Polaris
199
(6.5)
Apr 8 India
Exports YoY%
(5.66)
---
6.(
Renuka
14
(6.0)
Kscl
379
(5.8)
Torntpower
218
(4.8)
Finolexind
352
(4.1)
As on March 23, 2016
Market Outlook
March 28, 2016
BHEL Commissions 600MW power plant in Telangana
Bharat Heavy Electricals Limited (BHEL) has successfully commissioned a 600 Mw
coal-based thermal power plant in Telangana. As per the company the unit has
been commissioned at the upcoming 2x600 Mw Singareni thermal power project
located in Adilabad District. The Company has built 600 Mw rating sets which
comprise a four cylinder turbine, designed in-house.
The company has so far contracted 21 sets of 600 Mw each, of which 15 have
already been commissioned. With the commissioning of the unit, Singareni
Collieries Company Ltd (SCCL) has successfully diversified into the power
generation business. According to the filing, the second unit of Singareni is also in
an advanced stage of construction and is expected to be commissioned shortly.
The heavy engineering major had earlier commissioned a 600 Mw thermal power
plant at Kakatiya in the state in last December. The company commissioned 85%
of the coal-based power stations in Telangana amounting to 5,180 Mw. The state
Governments has recently placed orders with the company for executing around
6,000 Mw of thermal power projects in the state on engineering procurement
construction basis.
The financial performance of BHEL has however deteriorated in the last one year
with loss at net level in the last two quarters. During Q1FY2016 the company
reported PAT of only ~`34cr on revenue of ~`4,361cr, while in the Q2FY2016
the loss was ~`205cr, which widened to ~`1,102cr in 3QFY2016.
We don’t expect any major improvement in the financials of the company, over the
next couple of quarters. Dwindling order inflow in the BTG segment and pricing
pressure will impact the operating performance of the company and hence, there
is very little likely hood of improvement in the margins.
The stock has corrected ~60% from its 52 week high of 290 and hit a new low of
`90 recently. Looking at the recent pressure on operating margins we don’t expect
things to pick up in the near term and we maintain our NEUTRAL rating on the
stock.
Economic and Political News
India, China led investments in renewable energy in 2015: UN
Revised RBI rules for rehab of MSMEs to reduce bad loans: Ficci
India's forex reserves reach all time high
Corporate News
Punj Lloyd CEO, CFO resign; Shiv Punj appointed additional director
Inox Wind acquires Sarayu Wind Power
Tata steel reaches deal to sell two steel plants in Scotland
PVR Looks to Double Screen Count in 3 Yrs
Market Outlook
March 28, 2016
Top Picks ★★★★★
Large Cap
Market Cap
CMP
Target
Upside
Company
Rationale
(` Cr)
(`)
(`)
(%)
To outpace battery industry growth due to better technological
Amara Raja Batteries
15,414
902
1,040
15.2
products leading to market share gains in both the automotive
OEM and replacement segments.
Uptick in defense capex by government when coupled with
Bharat Electronics
28,841
1,202
1,414
17.7
BELs strong market positioning, indicate that good times are
ahead for BEL.
The stock is trading at attractive valuations and is factoring all
HCL Tech
1,15,334
818
1,038
26.9
the bad news.
Strong visibility for a robust 20% earnings trajectory, coupled
HDFC Bank
2,65,108
1,049
1,262
20.3
with high quality of earnings on account of high quality retail
business and strategic focus on highly rated corporates.
Back on the growth trend, expect a long term growth of 14%
Infosys
2,78,319
1,208
1,347
11.5
to be a US$20bn in FY2020.
LICHF continues to grow its retail loan book at a healthy pace
with improvement in asset quality. We expect the company to
LIC Housing Finance
24,115
478
592
23.8
post a healthy loan book which is likely to reflect in a strong
earnings growth.
Huge bid pipeline of re-development works at Delhi and other
NBCC
11,282
940
1,089
15.8
State Governments and opportunity from Smart City, positions
NBCC to report strong growth, going forward.
New launches to enable outpace industry growth; margins
TVS Motors
14,694
309
330
6.7
expansion to boost earnings
Source: Company, Angel Research
Mid Cap
Market Cap
CMP
Target
Upside
Company
Rationale
(` Cr)
(`)
(`)
(%)
Favorable outlook for the AC industry to augur well for
Cooling products business which is out pacing the market
Blue Star
3,423
381
439
15.3
growth. EMPPAC division's profitability to improve once
operating environment turns around.
Commencement of new projects, downtrend in the interest rate
IL&FS Transport
2,396
73
93
27.7
cycle, to lead to stock re-rating
Economic recovery to have favourable impact on advertising &
circulation revenue growth. Further, the acquisition of a radio
Jagran Prakashan
5,067
155
189
21.9
business (Radio City) would also boost the company's revenue
growth.
Speedier execution and speedier sales, strong revenue visibilty
Mahindra Lifespace
1,743
425
554
30.4
in short-to-long run, attractive valuations
Massive capacity expansion along with rail advantage at ICD
Navkar Corporation
2,342
164
265
61.4
as well CFS augurs well for the company
Earnings boost on back of stable material prices and
Radico Khaitan
1,270
95
156
63.4
favourable pricing environment. Valuation discount to peers
provides additional comfort
Strong brands and distribution network would boost growth
Siyaram Silk Mills
914
975
1,354
38.9
going ahead. Stock currently trades at an inexpensive
valuation.
Source: Company, Angel Research
Market Outlook
March 28, 2016
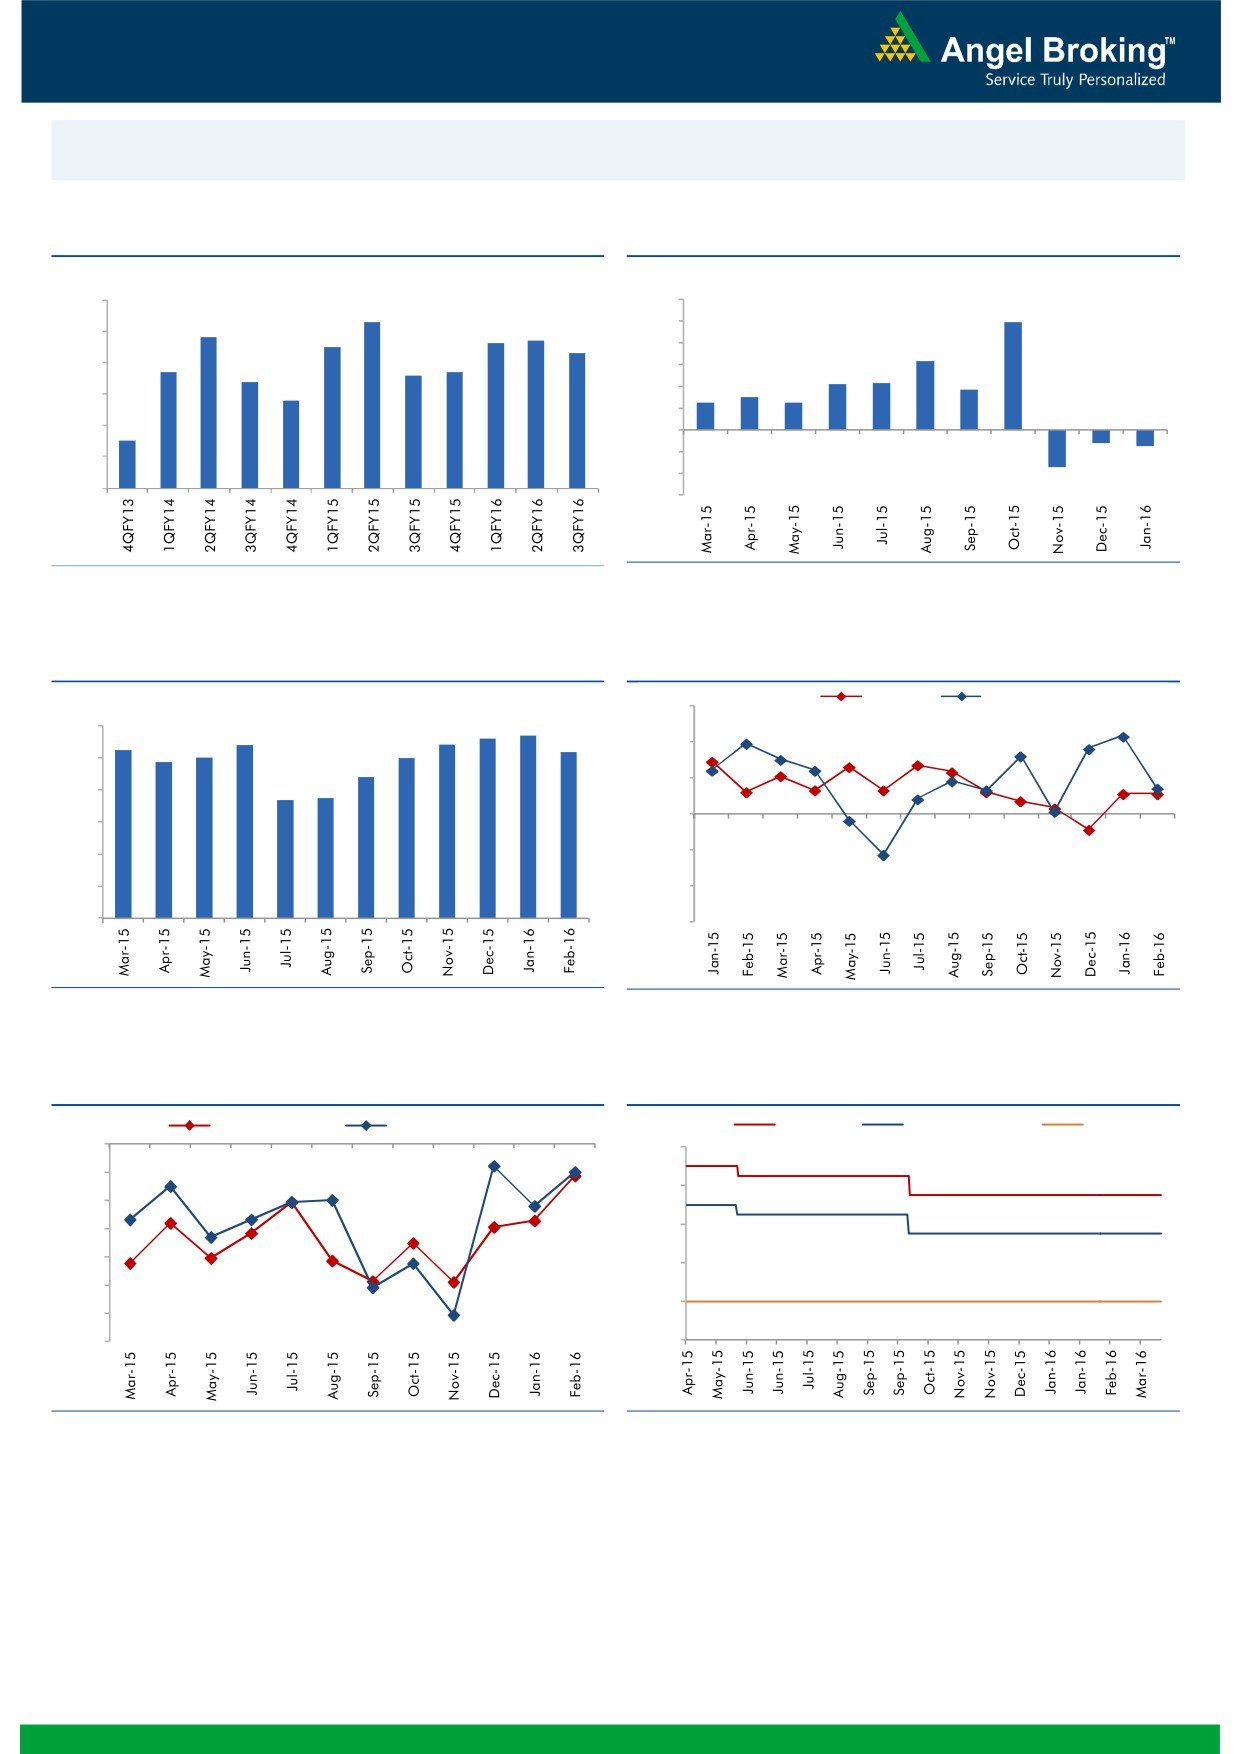
Macro watch
Exhibit 1: Quarterly GDP trends
Exhibit 2: IIP trends
(%)
(%)
9.0
8.3
12.0
9.9
7.8
7.7
10.0
8.0
7.5
7.6
7.3
8.0
6.3
6.7
6.6
6.7
7.0
6.4
6.0
4.2
4.3
3.7
5.8
4.0
2.5
3.0
2.5
6.0
2.0
5.0
4.5
-
4.0
(2.0)
(1.2)
(1.5)
(4.0)
3.0
(3.4)
(6.0)
Source: CSO, Angel Research
Source: MOSPI, Angel Research
Exhibit 3: Monthly CPI inflation trends
Exhibit 4: Manufacturing and services PMI
Mfg. PMI
Services PMI
(%)
56.0
5.6
5.7
6.0
5.4
5.4
5.3
5.2
4.9
5.0
5.0
54.0
5.0
4.4
3.7
3.7
52.0
4.0
50.0
3.0
2.0
48.0
1.0
46.0
-
44.0
Source: MOSPI, Angel Research
Source: Market, Angel Research; Note: Level above 50 indicates expansion
Exhibit 5: Exports and imports growth trends
Exhibit 6: Key policy rates
(%)
Exports yoy growth
Imports yoy growth
(%)
Repo rate
Reverse Repo rate
CRR
0.0
8.00
(5.0)
7.00
(10.0)
(15.0)
6.00
(20.0)
5.00
(25.0)
4.00
(30.0)
(35.0)
3.00
Source: Bloomberg, Angel Research
Source: RBI, Angel Research
Market Outlook
March 28, 2016
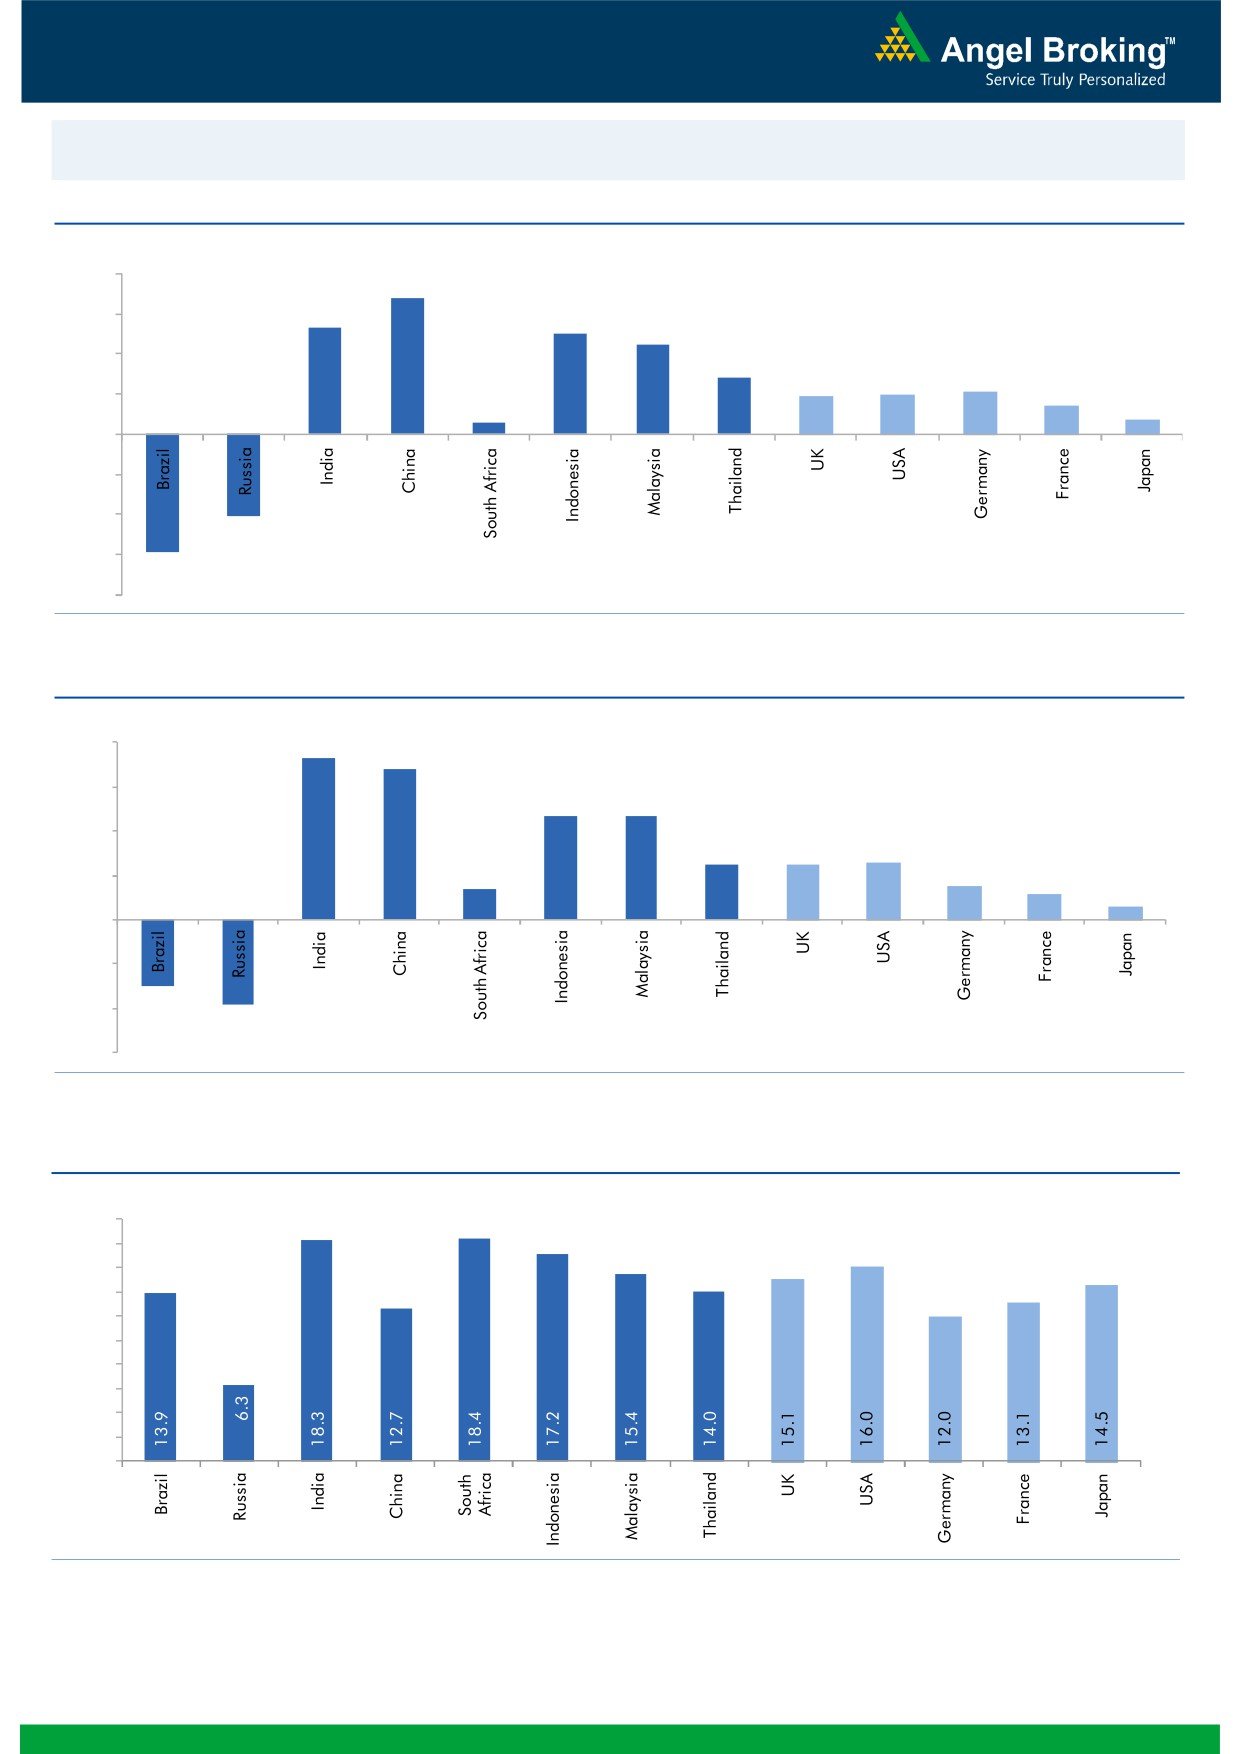
Global watch
Exhibit 1: Latest quarterly GDP Growth (%, yoy) across select developing and developed countries
(%)
8.0
6.8
6.0
5.3
5.0
4.5
4.0
2.8
1.9
2.0
2.1
1.4
2.0
0.6
0.7
-
(2.0)
(4.0)
(4.1)
(6.0)
(5.9)
(8.0)
Source: Bloomberg, Angel Research
Exhibit 2: 2015 GDP Growth projection by IMF (%, yoy) across select developing and developed countries
(%)
8.0
7.3
6.8
6.0
4.7
4.7
4.0
2.5
2.5
2.6
1.4
1.5
2.0
1.2
0.6
-
(2.0)
(3.0)
(4.0)
(3.8)
(6.0)
Source: IMF, Angel Research
Exhibit 3: One year forward P-E ratio across select developing and developed countries
(x)
20.0
18.0
16.0
14.0
12.0
10.0
8.0
6.0
4.0
2.0
-
Source: IMF, Angel Research
Market Outlook
March 28, 2016
Exhibit 4: Relative performance of indices across globe
Returns (%)
Country
Name of index
Closing price
1M
3M
1YR
Brazil
Bovespa
49,657
16.8
10.3
(1.2)
Russia
Micex
1,866
2.4
8.6
15.5
India
Nifty
7,717
7.0
(1.5)
(10.6)
China
Shanghai Composite
2,979
9.3
(17.7)
(16.3)
South Africa
Top 40
46,349
6.1
3.2
(0.8)
Mexico
Mexbol
45,648
5.2
6.3
3.6
Indonesia
LQ45
839
1.9
6.0
(11.0)
Malaysia
KLCI
1,704
2.4
2.9
(5.8)
Thailand
SET 50
898
5.4
10.7
(10.0)
USA
Dow Jones
17,516
6.6
1.5
(0.9)
UK
FTSE
6,106
2.4
0.4
(10.9)
Japan
Nikkei
17,003
5.9
(10.4)
(12.5)
Germany
DAX
9,851
4.6
(6.2)
(17.0)
France
CAC
4,330
2.2
(7.4)
(14.5)
Source: Bloomberg, Angel Research
Stock Watch
March 28, 2016
Company Name
Reco
CMP
Target
Mkt Cap
Sales ( Čcr )
OPM(%)
EPS (Č)
PER(x)
P/BV(x)
RoE(%)
EV/Sales(x)
(Č)
Price ( Č)
( Č cr )
FY16E FY17E
FY16E
FY17E
FY16E
FY17E
FY16E
FY17E
FY16E
FY17E
FY16E
FY17E
FY16E
FY17E
Agri / Agri Chemical
Rallis
Neutral
171
-
3,320
2,097
2,415
14.4
14.4
9.5
11.0
18.0
15.5
3.6
3.1
21.1
21.3
1.6
1.4
United Phosphorus
Accumulate
456
480
19,549
12,500
14,375
18.3
18.3
29.8
35.9
15.3
12.7
2.8
2.4
20.0
20.3
1.7
1.4
Auto & Auto Ancillary
Ashok Leyland
Neutral
106
-
30,152
17,995
21,544
11.4
11.6
3.4
4.7
31.2
22.5
5.5
5.0
17.7
22.2
1.6
1.3
Bajaj Auto
Accumulate
2,354
2,585
68,130
22,709
25,860
20.9
20.1
129.0
143.6
18.3
16.4
5.6
4.8
30.7
29.4
2.5
2.2
Bharat Forge
Neutral
887
-
20,645
7,351
8,318
19.9
19.7
31.2
36.5
28.4
24.3
5.1
4.3
19.3
19.2
2.9
2.6
Eicher Motors
Accumulate
18,554
20,044
50,395
15,556
16,747
15.5
17.3
464.8
597.5
39.9
31.1
14.6
10.7
36.2
34.3
3.2
2.9
Gabriel India
Accumulate
93
101
1,330
1,415
1,544
8.7
9.0
4.6
5.4
20.1
17.2
3.7
3.2
18.1
18.9
0.9
0.8
Hero Motocorp
Neutral
2,870
-
57,317
28,244
30,532
15.5
15.9
156.7
168.5
18.3
17.0
7.3
6.2
39.9
36.4
1.9
1.7
Jamna Auto Industries Accumulate
141
160
1,130
1,281
1,473
11.2
11.5
7.6
9.2
18.6
15.4
4.7
3.9
25.4
25.2
0.9
0.8
L G Balakrishnan & Bros Neutral
457
-
718
1,254
1,394
11.6
11.8
35.9
41.7
12.8
11.0
1.7
1.5
13.5
13.8
0.7
0.6
Mahindra and Mahindra Accumulate
1,249
1,364
77,587
38,416
42,904
13.7
13.9
54.8
63.4
22.8
19.7
3.5
3.1
15.4
15.8
1.7
1.4
Maruti
Neutral
3,736
-
112,848
57,865
68,104
16.4
16.7
176.3
225.5
21.2
16.6
4.1
3.5
19.4
21.2
1.7
1.4
Minda Industries
Accumulate
953
1,047
1,511
2,523
2,890
8.7
9.0
55.0
65.4
17.3
14.6
3.3
2.7
19.3
18.7
0.7
0.6
Motherson Sumi
Buy
254
313
33,597
39,343
45,100
8.8
9.1
10.1
12.5
25.2
20.3
8.0
6.2
35.3
34.4
0.9
0.8
Rane Brake Lining
Buy
363
465
287
454
511
11.5
12.0
25.2
31.0
14.4
11.7
2.2
1.9
14.9
16.6
0.8
0.7
Setco Automotive
Neutral
30
-
406
594
741
12.7
13.7
1.7
3.2
17.9
9.5
1.9
1.6
10.4
16.9
1.1
0.9
Tata Motors
Neutral
377
-
108,833
259,686
273,957
13.0
13.4
25.9
29.5
14.6
12.8
1.9
1.7
8.0
9.0
0.6
0.6
TVS Motor
Accumulate
309
330
14,694
11,263
13,122
6.9
8.5
9.2
15.0
33.6
20.6
7.7
6.1
22.7
29.6
1.3
1.1
Amara Raja Batteries
Buy
902
1,040
15,414
4,892
5,871
17.4
17.6
28.8
37.1
31.3
24.3
7.3
5.9
23.4
24.1
3.1
2.5
Exide Industries
Buy
135
162
11,509
6,950
7,784
14.4
14.8
6.6
7.3
20.5
18.6
2.6
2.4
12.6
12.8
1.4
1.2
Apollo Tyres
Neutral
175
-
8,916
12,056
12,714
17.2
16.4
23.0
20.3
7.6
8.6
1.4
1.2
17.7
13.6
0.8
0.8
Ceat
Neutral
1,075
-
4,350
6,041
6,597
14.1
13.7
99.5
111.9
10.8
9.6
2.1
1.8
19.6
18.5
0.9
0.7
JK Tyres
Neutral
85
-
1,928
7,446
7,669
15.2
14.0
19.6
18.4
4.3
4.6
1.1
0.9
25.2
19.5
0.7
0.6
Swaraj Engines
Accumulate
860
919
1,068
552
630
14.2
14.7
44.6
54.1
19.3
15.9
4.5
4.1
23.2
25.6
1.8
1.5
Subros
Neutral
93
-
555
1,293
1,527
11.8
11.9
4.2
6.7
22.0
13.8
1.7
1.5
7.7
11.5
0.7
0.6
Indag Rubber
Neutral
165
-
434
283
329
17.0
17.2
13.0
15.4
12.8
10.7
2.8
2.3
21.8
21.6
1.3
1.0
Capital Goods
ACE
Neutral
39
-
386
660
839
4.7
8.2
1.0
3.9
39.0
10.0
1.2
1.1
3.2
11.3
0.7
0.6
BEML
Accumulate
1,089
1,157
4,535
3,277
4,006
6.0
8.9
36.2
64.3
30.1
16.9
2.1
1.9
5.7
11.7
1.5
1.2
Bharat Electronics
Buy
1,202
1,414
28,841
7,737
8,634
16.8
17.2
54.0
61.5
22.3
19.5
3.2
2.8
39.3
45.6
2.8
2.4
Stock Watch
March 28, 2016
Company Name
Reco
CMP
Target
Mkt Cap
Sales ( Čcr )
OPM(%)
EPS (Č)
PER(x)
P/BV(x)
RoE(%)
EV/Sales(x)
(Č)
Price ( Č)
( Č cr )
FY16E
FY17E
FY16E
FY17E
FY16E
FY17E
FY16E
FY17E
FY16E
FY17E
FY16E
FY17E
FY16E
FY17E
Capital Goods
Voltas
Buy
270
353
8,919
5,363
5,963
8.0
9.1
11.0
13.8
24.5
19.5
3.8
3.3
16.2
17.9
1.6
1.4
BGR Energy
Neutral
105
-
761
3,615
3,181
9.5
9.4
16.7
12.4
6.3
8.5
0.6
0.6
10.0
7.0
0.6
0.8
BHEL
Neutral
117
-
28,527
33,722
35,272
10.8
11.7
10.5
14.2
11.1
8.2
0.8
0.8
7.0
9.0
0.9
0.9
Blue Star
Buy
381
439
3,423
3,548
3,977
6.3
6.9
13.7
17.2
27.8
22.2
7.0
4.5
26.1
25.4
1.1
0.9
Crompton Greaves
Neutral
48
-
3,008
13,484
14,687
4.9
6.2
4.5
7.1
10.7
6.8
0.8
0.7
7.2
10.8
0.4
0.3
Greaves Cotton
Neutral
125
-
3,040
1,655
1,755
16.6
16.8
7.4
7.8
16.8
16.0
3.4
3.2
21.1
20.6
1.8
1.7
Inox Wind
Buy
267
458
5,934
4,980
5,943
17.0
17.5
26.6
31.6
10.1
8.5
3.0
2.2
35.0
30.0
1.3
1.1
KEC International
Neutral
121
-
3,099
8,791
9,716
6.1
6.8
5.4
8.2
22.3
14.7
2.2
2.0
10.0
14.0
0.6
0.5
Thermax
Neutral
762
-
9,074
6,413
7,525
7.4
8.5
30.5
39.3
25.0
19.4
3.9
3.3
15.0
17.0
1.4
1.1
VATech Wabag
Neutral
540
-
2,943
2,722
3,336
7.9
8.1
19.5
24.6
27.7
22.0
2.9
2.6
11.1
12.4
1.2
1.0
Cement
ACC
Neutral
1,370
-
25,730
13,151
14,757
16.4
18.3
63.9
83.4
21.5
16.4
2.8
2.5
13.3
16.1
1.8
1.5
Ambuja Cements
Neutral
228
-
35,414
11,564
12,556
19.4
20.7
8.9
10.1
25.6
22.6
3.2
3.0
12.8
13.8
2.7
2.5
HeidelbergCement
Neutral
78
-
1,759
1,772
1,926
13.3
15.4
1.0
3.0
77.6
25.9
2.0
1.8
2.6
7.9
1.6
1.4
India Cements
Neutral
86
-
2,642
4,216
4,840
18.0
19.5
4.0
9.9
21.5
8.7
0.9
0.8
4.0
9.5
1.0
0.8
JK Cement
Neutral
630
-
4,405
3,661
4,742
10.1
15.8
7.5
28.5
84.0
22.1
2.5
2.2
7.5
22.9
1.7
1.3
J K Lakshmi Cement
Neutral
337
-
3,962
2,947
3,616
16.7
19.9
11.5
27.2
29.3
12.4
2.8
2.4
9.8
20.8
1.8
1.4
Mangalam Cements
Neutral
226
-
604
1,053
1,347
10.5
13.3
8.4
26.0
26.9
8.7
1.1
1.1
4.3
12.5
1.0
0.7
Orient Cement
Neutral
146
-
2,985
1,854
2,524
21.2
22.2
7.7
11.1
18.9
13.1
2.7
2.3
13.3
15.7
2.3
1.6
Ramco Cements
Neutral
410
-
9,765
4,036
4,545
20.8
21.3
15.1
18.8
27.2
21.8
3.3
3.0
12.9
14.3
2.9
2.5
Shree Cement^
Neutral
12,487
-
43,501
7,150
8,742
26.7
28.6
228.0
345.5
54.8
36.1
8.1
6.8
15.7
20.3
5.8
4.7
UltraTech Cement
Neutral
3,198
-
87,759
24,669
29,265
18.2
20.6
82.0
120.0
39.0
26.7
4.2
3.7
11.3
14.7
3.6
3.1
Construction
ITNL
Buy
73
93
2,396
7,360
8,825
34.0
35.9
7.0
9.0
10.4
8.1
0.4
0.3
3.2
3.7
3.7
3.6
KNR Constructions
Buy
515
603
1,448
937
1,470
14.3
14.0
44.2
38.6
11.7
13.3
2.3
2.0
15.4
15.4
1.6
1.1
Larsen & Toubro
Accumulate
1,242
1,310
115,666
58,870
65,708
8.3
10.3
42.0
53.0
29.6
23.4
2.1
1.9
8.8
11.2
2.2
2.0
Gujarat Pipavav Port
Neutral
176
-
8,489
629
684
51.0
52.2
6.4
5.9
27.4
29.8
3.6
3.3
15.9
12.7
13.1
11.9
MBL Infrastructures
Buy
160
285
663
2,313
2,797
12.2
14.6
19.0
20.0
8.4
8.0
0.9
0.8
11.3
10.6
1.0
0.9
Nagarjuna Const.
Neutral
78
-
4,314
7,892
8,842
8.8
9.1
3.0
5.3
25.9
14.6
1.3
1.2
5.0
8.5
0.8
0.7
PNC Infratech
Accumulate
516
558
2,648
1,873
2,288
13.2
13.5
24.0
32.0
21.5
16.1
2.1
1.9
12.1
12.3
1.5
1.3
Simplex Infra
Neutral
245
-
1,212
5,955
6,829
10.3
10.5
16.0
31.0
15.3
7.9
0.8
0.7
5.3
9.9
0.7
0.6
Stock Watch
March 28, 2016
Company Name
Reco
CMP
Target
Mkt Cap
Sales ( Čcr )
OPM(%)
EPS (Č)
PER(x)
P/BV(x)
RoE(%)
EV/Sales(x)
(Č)
Price ( Č)
( Č cr )
FY16E
FY17E
FY16E
FY17E
FY16E
FY17E
FY16E
FY17E
FY16E
FY17E
FY16E
FY17E
FY16E
FY17E
Construction
Power Mech Projects
Neutral
562
-
826
1,539
1,801
12.8
12.7
59.0
72.1
9.5
7.8
1.4
1.2
18.6
16.8
0.5
0.5
Sadbhav Engineering
Accumulate
274
289
4,695
3,481
4,219
10.7
10.8
8.2
11.7
33.4
23.4
3.2
2.8
10.3
13.5
1.6
1.3
NBCC
Buy
940
1,089
11,282
5,816
7,382
6.9
7.7
29.6
39.8
31.8
23.6
5.7
4.5
24.1
26.7
1.7
1.3
MEP Infra
Neutral
39
-
628
1,956
1,876
28.1
30.5
1.3
3.0
29.7
12.9
6.2
4.2
21.2
32.8
1.7
1.7
SIPL
Neutral
89
-
3,119
675
1,042
62.4
64.7
-
-
3.3
3.8
-
-
16.3
11.0
Engineers India
Neutral
167
-
5,634
1,667
1,725
13.5
16.0
9.7
11.4
17.2
14.7
2.0
2.0
11.7
13.4
2.2
2.2
Financials
Allahabad Bank
Neutral
53
-
3,186
8,569
9,392
2.8
2.9
16.3
27.5
3.3
1.9
0.3
0.2
7.6
11.9
-
-
Axis Bank
Accumulate
438
494
104,228
26,473
31,527
3.5
3.6
35.7
43.5
12.2
10.1
2.1
1.8
17.9
18.9
-
-
Bank of Baroda
Neutral
144
-
33,180
18,485
21,025
1.9
2.0
13.5
21.1
10.7
6.8
0.9
0.8
7.3
10.6
-
-
Bank of India
Neutral
97
-
7,863
15,972
17,271
1.9
2.0
15.3
33.4
6.3
2.9
0.3
0.3
3.6
7.6
-
-
Canara Bank
Neutral
191
-
10,377
15,441
16,945
2.0
2.1
46.6
70.4
4.1
2.7
0.4
0.3
8.0
11.2
-
-
Dena Bank
Neutral
29
-
1,849
3,440
3,840
2.1
2.3
7.3
10.0
4.0
2.9
0.3
0.2
6.1
7.9
-
-
Federal Bank
Neutral
50
-
8,538
3,477
3,999
3.0
3.0
5.0
6.2
9.9
8.0
1.0
0.9
10.6
11.9
-
-
HDFC
Neutral
1,163
-
183,751
10,358
11,852
3.3
3.3
41.1
47.0
28.3
24.7
5.4
4.9
24.7
24.9
-
-
HDFC Bank
Buy
1,049
1,262
265,108
38,309
47,302
4.3
4.3
49.3
61.1
21.3
17.2
3.7
3.2
18.5
19.7
-
-
ICICI Bank
Accumulate
234
254
136,225
34,279
39,262
3.3
3.3
21.0
24.4
11.2
9.6
1.9
1.6
14.4
14.7
-
-
IDBI Bank
Neutral
71
-
13,452
9,625
10,455
1.8
1.8
8.5
14.2
8.3
5.0
0.5
0.5
5.9
9.3
-
-
Indian Bank
Neutral
106
-
5,072
6,160
6,858
2.5
2.5
24.5
29.8
4.3
3.5
0.3
0.3
7.7
8.6
-
-
LIC Housing Finance
Buy
478
592
24,115
3,101
3,745
2.5
2.5
33.0
40.2
14.5
11.9
2.7
2.3
19.7
20.5
-
-
Oriental Bank
Neutral
91
-
2,741
7,643
8,373
2.4
2.4
37.2
45.4
2.5
2.0
0.2
0.2
8.2
9.4
-
-
Punjab Natl.Bank
Neutral
85
-
16,641
23,638
26,557
2.8
2.8
17.9
27.2
4.7
3.1
0.5
0.4
8.5
12.0
-
-
South Ind.Bank
Neutral
18
-
2,397
1,965
2,185
2.5
2.5
2.5
3.3
7.1
5.4
0.7
0.6
9.5
11.7
-
-
St Bk of India
Neutral
197
-
152,771
79,958
86,061
2.6
2.6
13.4
20.7
14.7
9.5
1.2
1.1
11.5
12.8
-
-
Union Bank
Neutral
128
-
8,806
12,646
14,129
2.3
2.4
31.0
39.1
4.1
3.3
0.4
0.4
9.8
11.4
-
-
Vijaya Bank
Neutral
31
-
2,668
3,536
3,827
1.9
1.9
5.5
6.7
5.6
4.7
0.5
0.4
7.8
8.8
-
-
Yes Bank
Neutral
848
-
35,653
7,190
9,011
3.2
3.3
58.2
69.7
14.6
12.2
2.6
2.2
19.2
19.6
-
-
FMCG
Asian Paints
Neutral
850
-
81,532
16,553
19,160
16.0
16.2
17.7
21.5
48.1
39.5
12.8
11.5
29.4
31.2
4.8
4.1
Britannia
Neutral
2,721
-
32,641
8,481
9,795
14.0
14.1
65.5
78.3
41.5
34.8
19.7
16.1
38.3
41.2
3.7
3.2
Colgate
Neutral
841
-
22,862
4,836
5,490
19.5
19.7
48.5
53.2
17.3
15.8
12.7
11.1
99.8
97.5
4.6
4.1
Stock Watch
March 28, 2016
Company Name
Reco
CMP
Target
Mkt Cap
Sales ( Čcr )
OPM(%)
EPS (Č)
PER(x)
P/BV(x)
RoE(%)
EV/Sales(x)
(Č)
Price ( Č)
( Č cr )
FY16E FY17E
FY16E
FY17E
FY16E
FY17E
FY16E
FY17E
FY16E
FY17E
FY16E
FY17E
FY16E
FY17E
FMCG
Dabur India
Accumulate
249
267
43,776
9,370
10,265
17.1
17.2
7.3
8.1
33.9
30.7
10.2
8.3
33.7
30.6
4.6
4.2
GlaxoSmith Con*
Neutral
5,949
-
25,021
4,919
5,742
17.2
17.4
168.3
191.2
35.4
31.1
10.0
8.5
28.8
28.9
4.6
3.9
Godrej Consumer
Neutral
1,298
-
44,196
10,168
12,886
16.1
16.1
32.1
38.4
40.4
33.8
8.2
7.6
19.7
21.0
4.4
3.5
HUL
Neutral
873
-
188,819
34,940
38,957
17.5
17.7
20.8
24.7
42.0
35.3
46.7
37.3
110.5
114.2
5.2
4.6
ITC
Accumulate
324
359
260,841
36,804
38,776
37.9
37.9
12.2
12.9
26.6
25.2
7.4
6.5
27.7
25.8
6.7
6.3
Marico
Neutral
241
-
31,112
6,551
7,766
15.7
16.0
10.4
12.5
23.2
19.3
6.7
5.6
33.2
32.4
4.7
3.9
Nestle*
Buy
5,261
6,646
50,726
11,291
12,847
22.2
22.3
158.9
184.6
33.1
28.5
17.3
15.6
55.0
57.3
4.3
3.8
Tata Global
Buy
119
144
7,539
8,635
9,072
9.8
9.9
6.5
7.6
18.4
15.7
1.8
1.8
6.8
7.4
0.8
0.8
IT
HCL Tech^
Buy
818
1,038
115,334
42,038
47,503
21.2
21.5
51.5
57.7
15.9
14.2
3.4
2.7
21.5
18.8
2.4
1.9
Infosys
Accumulate
1,208
1,347
278,319
61,850
69,981
27.5
27.5
59.4
65.7
20.3
18.4
4.3
3.7
21.2
20.1
3.8
3.2
TCS
Buy
2,475
2,854
487,622
108,487
122,590
28.3
28.5
122.8
138.4
20.2
17.9
7.7
7.0
38.0
38.9
4.1
3.6
Tech Mahindra
Accumulate
480
530
46,420
26,524
29,177
16.2
17.0
28.8
33.6
16.7
14.3
3.2
2.7
19.3
19.1
1.5
1.3
Wipro
Buy
556
680
137,332
50,808
56,189
23.7
23.8
37.3
40.7
14.9
13.7
2.8
2.6
19.2
17.7
2.2
1.8
Media
D B Corp
Buy
307
356
5,632
2,241
2,495
27.8
27.9
21.8
25.6
14.1
12.0
3.7
3.2
26.7
28.5
2.5
2.2
HT Media
Neutral
79
-
1,834
2,495
2,603
11.2
11.2
7.3
8.6
10.8
9.2
0.9
0.8
7.4
8.1
0.2
0.2
Jagran Prakashan
Buy
155
189
5,067
2,170
2,355
27.2
26.2
8.9
9.9
17.4
15.7
3.7
3.2
20.9
20.5
2.2
2.1
Sun TV Network
Neutral
370
-
14,589
2,779
3,196
70.2
70.5
22.8
27.3
16.2
13.6
4.0
3.6
26.7
28.3
5.0
4.3
Hindustan Media
Neutral
247
-
1,814
920
1,031
20.0
20.0
19.2
20.9
12.9
11.8
2.1
1.8
16.4
15.3
1.5
1.3
Ventures
Metals & Mining
Coal India
Buy
298
380
187,975
76,167
84,130
19.9
22.3
22.4
25.8
13.3
11.5
4.8
4.7
35.5
41.0
1.8
1.6
Hind. Zinc
Neutral
170
-
71,661
14,641
14,026
50.4
50.4
17.7
16.0
9.6
10.6
1.5
1.3
16.2
13.2
2.5
2.4
Hindalco
Neutral
91
-
18,843
104,356
111,186
8.7
9.5
6.7
11.1
13.6
8.3
0.5
0.5
3.5
5.9
0.7
0.6
JSW Steel
Neutral
1,248
-
30,163
42,308
45,147
16.4
20.7
(10.3)
49.5
25.2
1.4
1.3
(1.0)
5.6
1.8
1.6
NMDC
Neutral
102
-
40,381
8,237
10,893
46.6
44.5
10.0
11.7
10.2
8.7
1.1
1.0
12.5
13.0
4.7
3.6
SAIL
Neutral
45
-
18,668
45,915
53,954
7.2
10.5
1.5
4.4
30.0
10.3
0.4
0.4
2.3
4.1
1.1
0.9
Vedanta
Neutral
97
-
28,713
71,445
81,910
26.2
26.3
12.9
19.2
7.5
5.1
0.5
0.5
7.2
8.9
0.9
0.6
Tata Steel
Neutral
317
-
30,749
126,760
137,307
8.9
11.3
6.4
23.1
49.8
13.7
1.0
1.0
2.0
7.1
0.8
0.8
Oil & Gas
Cairn India
Neutral
158
-
29,688
11,323
12,490
49.4
51.0
20.7
20.7
7.6
7.7
0.5
0.5
6.4
6.1
1.7
1.0
GAIL
Neutral
356
-
45,170
64,856
70,933
9.1
9.6
24.0
28.9
14.9
12.3
1.3
1.2
8.8
9.6
0.9
0.8
ONGC
Neutral
215
-
183,558
154,564
167,321
36.8
37.4
28.6
32.5
7.5
6.6
1.0
0.9
12.7
13.5
1.4
1.3
Stock Watch
March 28, 2016
Company Name
Reco
CMP
Target
Mkt Cap
Sales ( Čcr )
OPM(%)
EPS (Č)
PER(x)
P/BV(x)
RoE(%)
EV/Sales(x)
(Č)
Price ( Č)
( Č cr )
FY16E FY17E
FY16E
FY17E
FY16E
FY17E
FY16E
FY17E
FY16E
FY17E
FY16E
FY17E
FY16E
FY17E
Oil & Gas
Petronet LNG
Neutral
251
-
18,818
29,691
31,188
5.8
6.2
12.8
13.4
19.6
18.7
2.9
2.6
15.8
14.8
0.7
0.7
Indian Oil Corp
Buy
393
455
95,443
359,607
402,760
5.9
6.1
42.5
48.7
9.3
8.1
1.2
1.1
14.1
14.4
0.4
0.3
Reliance Industries
Accumulate
1,029
1,150
333,521
304,775
344,392
12.6
13.4
91.3
102.6
11.3
10.0
1.3
1.2
11.8
12.0
1.0
0.9
Pharmaceuticals
Alembic Pharma
Neutral
609
-
11,480
3,274
3,802
26.9
19.4
35.0
28.7
17.4
21.2
7.7
5.8
55.6
31.2
3.5
2.9
Aurobindo Pharma
Accumulate
753
856
44,063
14,923
17,162
22.0
23.0
35.7
42.8
21.1
17.6
6.2
4.7
34.0
30.2
3.3
2.8
Aventis*
Neutral
4,154
-
9,567
2,082
2,371
17.4
20.8
118.2
151.5
35.1
27.4
5.1
4.1
19.9
25.5
4.3
3.5
Cadila Healthcare
Accumulate
320
352
32,790
10,224
11,840
21.0
22.0
14.6
17.6
21.9
18.2
6.0
4.7
30.8
29.0
3.3
2.7
Cipla
Accumulate
533
605
42,780
13,979
16,447
20.2
18.6
25.7
27.5
20.7
19.4
3.4
2.9
17.6
16.1
3.1
2.5
Dr Reddy's
Buy
3,047
3,933
51,966
16,838
19,575
25.0
23.1
167.5
178.8
18.2
17.0
3.8
3.2
23.1
20.4
3.0
2.5
Dishman Pharma
Neutral
343
-
2,772
1,733
1,906
21.5
21.5
17.0
19.9
20.2
17.3
2.0
1.8
10.5
11.2
2.1
1.8
GSK Pharma*
Neutral
3,684
-
31,202
2,870
3,158
20.0
22.1
59.5
68.3
61.9
53.9
18.3
18.8
28.5
34.3
10.4
9.5
Indoco Remedies
Neutral
295
-
2,721
1,033
1,199
15.9
18.2
9.4
13.6
31.4
21.7
4.7
4.0
15.7
19.7
2.7
2.4
Ipca labs
Buy
598
900
7,543
3,363
3,909
12.9
18.6
13.4
28.0
44.6
21.4
3.2
2.8
7.4
14.0
2.5
2.2
Lupin
Neutral
1,525
-
68,688
13,092
16,561
25.0
27.0
50.4
68.3
30.3
22.3
6.3
4.9
22.8
24.7
5.0
3.8
Sun Pharma
Accumulate
847
950
203,749
28,163
32,610
25.8
30.7
17.4
26.9
48.7
31.5
4.6
4.0
13.0
16.6
6.7
5.6
Power
Tata Power
Neutral
63
-
16,945
35,923
37,402
22.6
22.8
4.1
5.2
15.5
12.2
1.2
1.1
7.5
9.3
1.4
1.3
NTPC
Accumulate
127
146
105,006
87,271
99,297
23.5
23.5
11.8
13.3
10.8
9.6
1.2
1.1
11.5
12.2
2.2
2.0
Power Grid
Buy
137
170
71,751
20,702
23,361
86.7
86.4
12.1
13.2
11.4
10.4
1.7
1.5
15.6
15.1
8.4
7.8
Real Estate
MLIFE
Buy
425
554
1,743
697
1,011
14.9
19.3
13.8
20.1
30.8
21.1
1.1
1.1
3.8
5.3
3.8
2.6
Telecom
Bharti Airtel
Neutral
359
-
143,327
101,748
109,191
32.1
31.7
12.0
12.5
29.9
28.7
2.1
1.9
6.9
6.7
2.0
1.9
Idea Cellular
Neutral
105
-
37,877
34,282
36,941
32.0
31.5
5.9
6.2
17.8
17.0
1.6
1.5
9.9
9.3
1.7
1.6
zOthers
Abbott India
Neutral
4,758
-
10,110
2,715
3,153
14.5
14.1
134.3
152.2
35.4
31.3
8.8
7.3
27.4
25.6
3.4
2.9
Bajaj Electricals
Buy
197
237
1,986
4,719
5,287
5.2
5.8
8.6
12.7
23.0
15.5
2.6
2.3
11.4
14.8
0.4
0.4
Finolex Cables
Neutral
259
-
3,968
2,520
2,883
12.2
12.0
12.7
14.2
20.5
18.3
2.8
2.5
13.6
13.5
1.3
1.1
Goodyear India*
Buy
483
582
1,115
1,800
1,600
11.7
11.5
58.7
52.9
8.2
9.1
1.8
1.6
24.6
18.7
0.4
0.4
Hitachi
Neutral
1,141
-
3,102
1,779
2,081
7.8
8.8
21.8
33.4
52.3
34.1
8.5
6.8
17.4
22.1
1.8
1.5
Jyothy Laboratories
Neutral
286
-
5,173
1,620
1,847
11.5
11.5
7.3
8.5
39.2
33.7
5.1
4.7
13.3
14.4
3.1
2.6
MRF
Buy
35,299
45,575
14,971
20,316
14,488
21.4
21.1
5,488.0
3,798.0
6.4
9.3
2.2
1.8
41.1
21.2
0.7
0.9
Page Industries
Neutral
11,380
-
12,693
1,929
2,450
19.8
20.1
229.9
299.0
49.5
38.1
21.8
15.2
52.1
47.1
6.6
5.2
Stock Watch
March 28, 2016
Company Name
Reco
CMP
Target
Mkt Cap
Sales ( Čcr )
OPM(%)
EPS (Č)
PER(x)
P/BV(x)
RoE(%)
EV/Sales(x)
(Č)
Price ( Č)
( Č cr )
FY16E
FY17E
FY16E
FY17E
FY16E
FY17E
FY16E
FY17E
FY16E
FY17E
FY16E
FY17E
FY16E
FY17E
zOthers
Relaxo Footwears
Neutral
373
-
4,478
1,767
2,152
12.3
12.5
19.3
25.1
19.4
14.9
4.8
3.7
27.7
27.8
2.6
2.1
Siyaram Silk Mills
Buy
975
1,354
914
1,636
1,815
11.5
11.5
89.9
104.1
10.9
9.4
1.8
1.6
17.9
17.8
0.7
0.6
Styrolution ABS India* Neutral
582
-
1,023
1,271
1,440
8.6
9.2
32.0
41.1
18.2
14.2
1.9
1.7
10.7
12.4
0.8
0.7
TVS Srichakra
Buy
2,376
3,217
1,819
2,035
2,252
15.9
15.3
248.6
268.1
9.6
8.9
4.2
3.0
43.6
33.9
0.9
0.8
HSIL
Accumulate
277
302
2,003
2,123
2,384
16.1
16.5
15.0
18.9
18.4
14.7
1.4
1.3
8.0
9.4
1.3
1.1
Kirloskar Engines India
Neutral
212
-
3,068
2,403
2,554
8.6
9.9
9.2
10.5
23.1
20.2
2.2
2.1
9.7
10.7
0.9
0.8
Ltd
M M Forgings
Buy
447
614
539
511
615
21.7
21.6
43.1
55.8
10.4
8.0
1.9
1.5
19.9
21.2
1.3
1.0
Banco Products (India) Neutral
110
-
786
1,208
1,353
11.0
12.3
10.8
14.5
10.2
7.6
1.2
1.0
11.9
14.5
0.6
0.5
Competent Automobiles Neutral
137
-
84
1,040
1,137
3.2
3.1
25.7
28.0
5.3
4.9
0.8
0.7
15.0
14.3
0.1
0.1
Nilkamal
Neutral
1,125
-
1,678
1,871
2,031
10.7
10.5
63.2
69.8
17.8
16.1
2.9
2.5
17.6
16.6
0.9
0.8
Visaka Industries
Buy
104
144
165
1,086
1,197
9.9
10.3
21.5
28.8
4.8
3.6
0.5
0.4
9.6
11.6
0.4
0.3
Transport Corporation of
Neutral
277
-
2,109
2,830
3,350
8.8
9.0
14.4
18.3
19.3
15.1
3.0
2.6
15.4
17.1
0.9
0.8
India
Elecon Engineering
Neutral
58
-
633
1,359
1,482
10.3
13.7
0.8
3.9
72.4
14.9
1.2
1.1
1.6
7.8
0.8
0.7
Surya Roshni
Buy
136
201
597
2,992
3,223
8.1
8.4
14.7
18.3
9.3
7.4
0.9
0.8
9.7
11.0
0.5
0.4
MT Educare
Neutral
166
-
659
286
366
18.3
17.7
7.7
9.4
21.4
17.7
4.5
4.0
20.2
21.1
2.2
1.7
Radico Khaitan
Buy
95
156
1,270
1,517
1,635
12.7
13.4
5.8
7.1
16.4
13.4
1.4
1.3
8.6
9.6
1.3
1.2
Garware Wall Ropes
Buy
331
473
725
862
974
11.2
11.2
24.9
29.6
13.3
11.2
2.0
1.7
15.1
15.4
0.8
0.7
Wonderla Holidays
Neutral
377
-
2,130
206
308
44.0
43.6
9.0
12.9
41.9
29.2
5.7
5.2
13.7
17.8
10.2
6.8
Linc Pen & Plastics
Neutral
195
-
288
340
371
8.3
8.9
10.8
13.2
18.0
14.8
2.9
2.5
16.0
17.1
0.9
0.8
The Byke Hospitality
Neutral
155
-
623
222
287
20.5
20.5
5.6
7.6
27.6
20.6
5.2
4.3
18.9
20.8
2.8
2.2
Interglobe Aviation
Neutral
899
-
32,378
17,022
21,122
20.7
14.5
63.9
53.7
14.1
16.7
21.1
17.3
149.9
103.2
1.9
1.5
Coffee Day Enterprises
Neutral
226
-
4,659
2,692
2,964
17.0
18.6
-
4.7
-
47.7
2.8
2.6
0.2
5.5
2.1
2.0
Ltd
Navneet Education
Neutral
81
-
1,931
998
1,062
24.1
24.0
5.8
6.1
14.1
13.3
3.1
2.7
22.0
20.6
2.0
1.9
Navkar Corporation
Buy
164
265
2,342
365
436
38.3
37.5
5.6
5.9
29.1
27.9
1.8
1.7
6.3
6.1
7.2
6.2
Source: Company, Angel Research; Note: *December year end; #September year end; &October year end; Price as on March 23, 2016
Market Outlook
March 28, 2016
Research Team Tel: 022 - 39357800
DISCLAIMER
Angel Broking Private Limited (hereinafter referred to as “Angel”) is a registered Member of National Stock Exchange of India Limited,
Bombay Stock Exchange Limited and Metropolitian Stock Exchange of India Limited. It is also registered as a Depository Participant with
CDSL and Portfolio Manager with SEBI. It also has registration with AMFI as a Mutual Fund Distributor. Angel Broking Private Limited is a
registered entity with SEBI for Research Analyst in terms of SEBI (Research Analyst) Regulations, 2014 vide registration number
INH000000164. Angel or its associates has not been debarred/ suspended by SEBI or any other regulatory authority for accessing
/dealing in securities Market. Angel or its associates including its relatives/analyst do not hold any financial interest/beneficial ownership
of more than 1% in the company covered by Analyst. Angel or its associates/analyst has not received any compensation / managed or co
-managed public offering of securities of the company covered by Analyst during the past twelve months. Angel/analyst has not served as
an officer, director or employee of company covered by Analyst and has not been engaged in market making activity of the company
covered by Analyst.
This document is solely for the personal information of the recipient, and must not be singularly used as the basis of any investment
decision. Nothing in this document should be construed as investment or financial advice. Each recipient of this document should make
such investigations as they deem necessary to arrive at an independent evaluation of an investment in the securities of the companies
referred to in this document (including the merits and risks involved), and should consult their own advisors to determine the merits and
risks of such an investment.
Reports based on technical and derivative analysis center on studying charts of a stock's price movement, outstanding positions and
trading volume, as opposed to focusing on a company's fundamentals and, as such, may not match with a report on a company's
fundamentals.
The information in this document has been printed on the basis of publicly available information, internal data and other reliable sources
believed to be true, but we do not represent that it is accurate or complete and it should not be relied on as such, as this document is for
general guidance only. Angel Broking Pvt. Limited or any of its affiliates/ group companies shall not be in any way responsible for any
loss or damage that may arise to any person from any inadvertent error in the information contained in this report. Angel Broking Pvt.
Limited has not independently verified all the information contained within this document. Accordingly, we cannot testify, nor make any
representation or warranty, express or implied, to the accuracy, contents or data contained within this document. While Angel Broking
Pvt. Limited endeavors to update on a reasonable basis the information discussed in this material, there may be regulatory, compliance,
or other reasons that prevent us from doing so.
This document is being supplied to you solely for your information, and its contents, information or data may not be reproduced,
redistributed or passed on, directly or indirectly.
Neither Angel Broking Pvt. Limited, nor its directors, employees or affiliates shall be liable for any loss or damage that may arise from or
in connection with the use of this information.
Note: Please refer to the important ‘Stock Holding Disclosure' report on the Angel website (Research Section). Also, please refer to the
latest update on respective stocks for the disclosure status in respect of those stocks. Angel Broking Pvt. Limited and its affiliates may have
investment positions in the stocks recommended in this report.