Market Outlook
August 27, 2015
Dealer’s Diary
Domestic Indices
Chg (%)
(Pts)
(Close)
BSE Sensex
(1.2)
(318)
25,715
Indian markets are expected to open Positive tracking SGX Nifty.
Nifty
(1.1)
(89)
7,792
U.S. Markets closed in positive territory on Wednesday. The rebound on U.S.
MID CAP
(0.8)
(83)
10,477
Markets came as traders looked to pick up stocks at reduced levels following the
SMALL CAP
0.2
17
10,712
downturn seen over the course of the trading day on Tuesday.
BSE HC
(1.1)
(198)
17,195
European markets ended in negative territory on Wednesday, as concerns about
BSE PSU
(0.6)
(41)
6,723
China continued, even after China's central bank Tuesday cut its key interest rates
BANKEX
(1.7)
(331)
19,395
and reserve ratio, boosting efforts to support the slowing economy.
AUTO
(0.7)
(124)
17,679
Indian markets fell sharply on Wednesday as concerns over China's stock market
METAL
0.2
16
7,162
crisis and growing fears that Chinese growth is weakening continued to haunt
OIL & GAS
(1.0)
(85)
8,532
investors.
BSE IT
(1.0)
(105)
10,892
Global Indices
Chg (%)
(Pts)
(Close)
News & Result Analysis
Dow Jones
4.0
619
16,286
Sun TV Network enters into deal with HOOQ to share its library
Refer detailed news analysis on the following page
NASDAQ
4.2
191
4,698
FTSE
(1.7)
(102)
5,979
Markets Today
Nikkei
3.2
570
18,377
The trend deciding level for the day is 25,843 / 7,833 levels. If NIFTY trades above
Hang Sang
(1.5)
(325)
21,080
this level during the first half-an-hour of trade then we may witness a further rally up
Straits Times
(0.5)
(13)
2,873
to 26,028 - 26,342 / 7,889 - 7,986 levels. However, if NIFTY trades below
Shanghai Com
(1.3)
(38)
2,927
25,843 / 7,833 levels for the first half-an-hour of trade then it may correct towards
25,529 - 25,344 / 7,736 - 7,680 levels.
Indian ADR
Chg (%)
(Pts)
(Close)
Indices
S2
S1
PIVOT
R1
R2
INFY
2.7
0.5
$17.0
SENSEX
25,344
25,529
25,843
26,028
26,342
WIT
2.2
0.3
$11.7
NIFTY
7,680
7,736
7,833
7,889
7,986
IBN
0.2
0.0
$8.7
HDB
0.7
0.4
$57.6
Net Inflows (August 25, 2015)
` cr
Purch
Sales
Net
MTD
YTD
Advances / Declines
BSE
NSE
FII
6,670
8,662
(1,992)
(11,152)
129,818
Advances
1,304
751
MFs
2,798
752
2,046
6,345
64,293
Declines
1,374
743
Unchanged
98
67
FII Derivatives (August 26, 2015)
` cr
Purch
Sales
Net
Open Interest
Volumes (` cr)
Index Futures
8,497
8,586
(89)
24,928
BSE
3,134
Stock Futures
15,293
15,049
243
52,306
NSE
19,956
Gainers / Losers
Gainer
Loser
Company
Price (`)
chg (%)
Company
Price (`)
chg (%)
VAKRANGEE
98
9.3
SADBHAV
290
(6.1)
DENABANK
333
7.7
INFRATEL
387
(5.3)
KEC
128
7.0
BHARATFORG
1,105
(5.1)
IBREALEST
60
6.8
HEXAWARE
225
(5.1)
PTC
55
6.6
KAILASH
3
(5.0)
Market Outlook
August 27, 2015
Sun TV Network enters into deal with HOOQ to share its library
Sun TV Network has yesterday announced a multi-year deal with video-on-
demand service firm HOOQ, a start up joint venture established by Singtel, Sony
Pictures Television and Warner Bros in January this year.
Under the agreement HOOQ would now carry Sun TV's library that includes a mix
of films in Tamil, Telugu, Malayalam and Kannada languages including the latest
hit movies. With around 33 channels across the South Indian languages, Sun
Group's existing library has about 11,000 titles, which is said to be among the
largest in the industry.
Economic and Political News
Natural fertiliser will slash India's fertiliser import, subsidy bills: Dhirendra
Kumar
Andhra Pradesh gives approvals to over 1,200 industries
UK minister calls for closer partnership with India
Corporate News
NTPC, IPPs will continue to bear lower plant load factors
Mahindra to invest `700cr in commercial vehicle biz
Gayatri Projects bags `3,318 crore road contracts from NHAI
Market Outlook
August 27, 2015
Top Picks
Large Cap
Market
CMP
Target
Upside
Company
Sector
Rating
Cap (` Cr)
(`)
(`)
(%)
Axis Bank
Financials
1,17,876
Buy
496
716
44.4
ICICI Bank
Financials
1,61,652
Buy
278
370
32.9
Infosys
IT
2,44,705
Buy
1,065
1,306
22.6
Inox Wind
Capital Goods
7,618
Buy
343
505
47.1
LIC Housing
Financials
21,539
Buy
427
590
38.2
Finance
Power Grid
Power
68,455
Buy
131
170
29.9
TCS
IT
5,04,715
Buy
2,577
3,168
23.0
Tech Mahindra IT
48,792
Buy
507
646
27.4
Yes Bank
Financials
28,518
Buy
682
989
45.1
Source: Angel Research, Bloomberg
Mid Cap
Market
CMP
Target
Upside
Company
Sector
Rating
Cap (` Cr)
(`)
(`)
(%)
Bajaj Electricals
Others
2,296
Buy
228
341
49.7
Garware Wall Ropes Others
630
Buy
288
390
35.4
Hindustan Media Ven. Media
1,578
Buy
215
292
35.8
JK Tyre
Auto Ancillary
2,439
Buy
108
129
19.9
MBL Infrastructures
Construction
957
Buy
231
360
56.0
Minda Industries
Auto Ancillary
817
Buy
515
652
26.6
MT Educare
Others
516
Buy
130
169
30.3
Radico Khaitan
Others
1,201
Buy
90
112
24.0
Surya Roshni
Others
531
Buy
121
183
51.1
Source: Angel Research, Bloomberg
Market Outlook
August 27, 2015
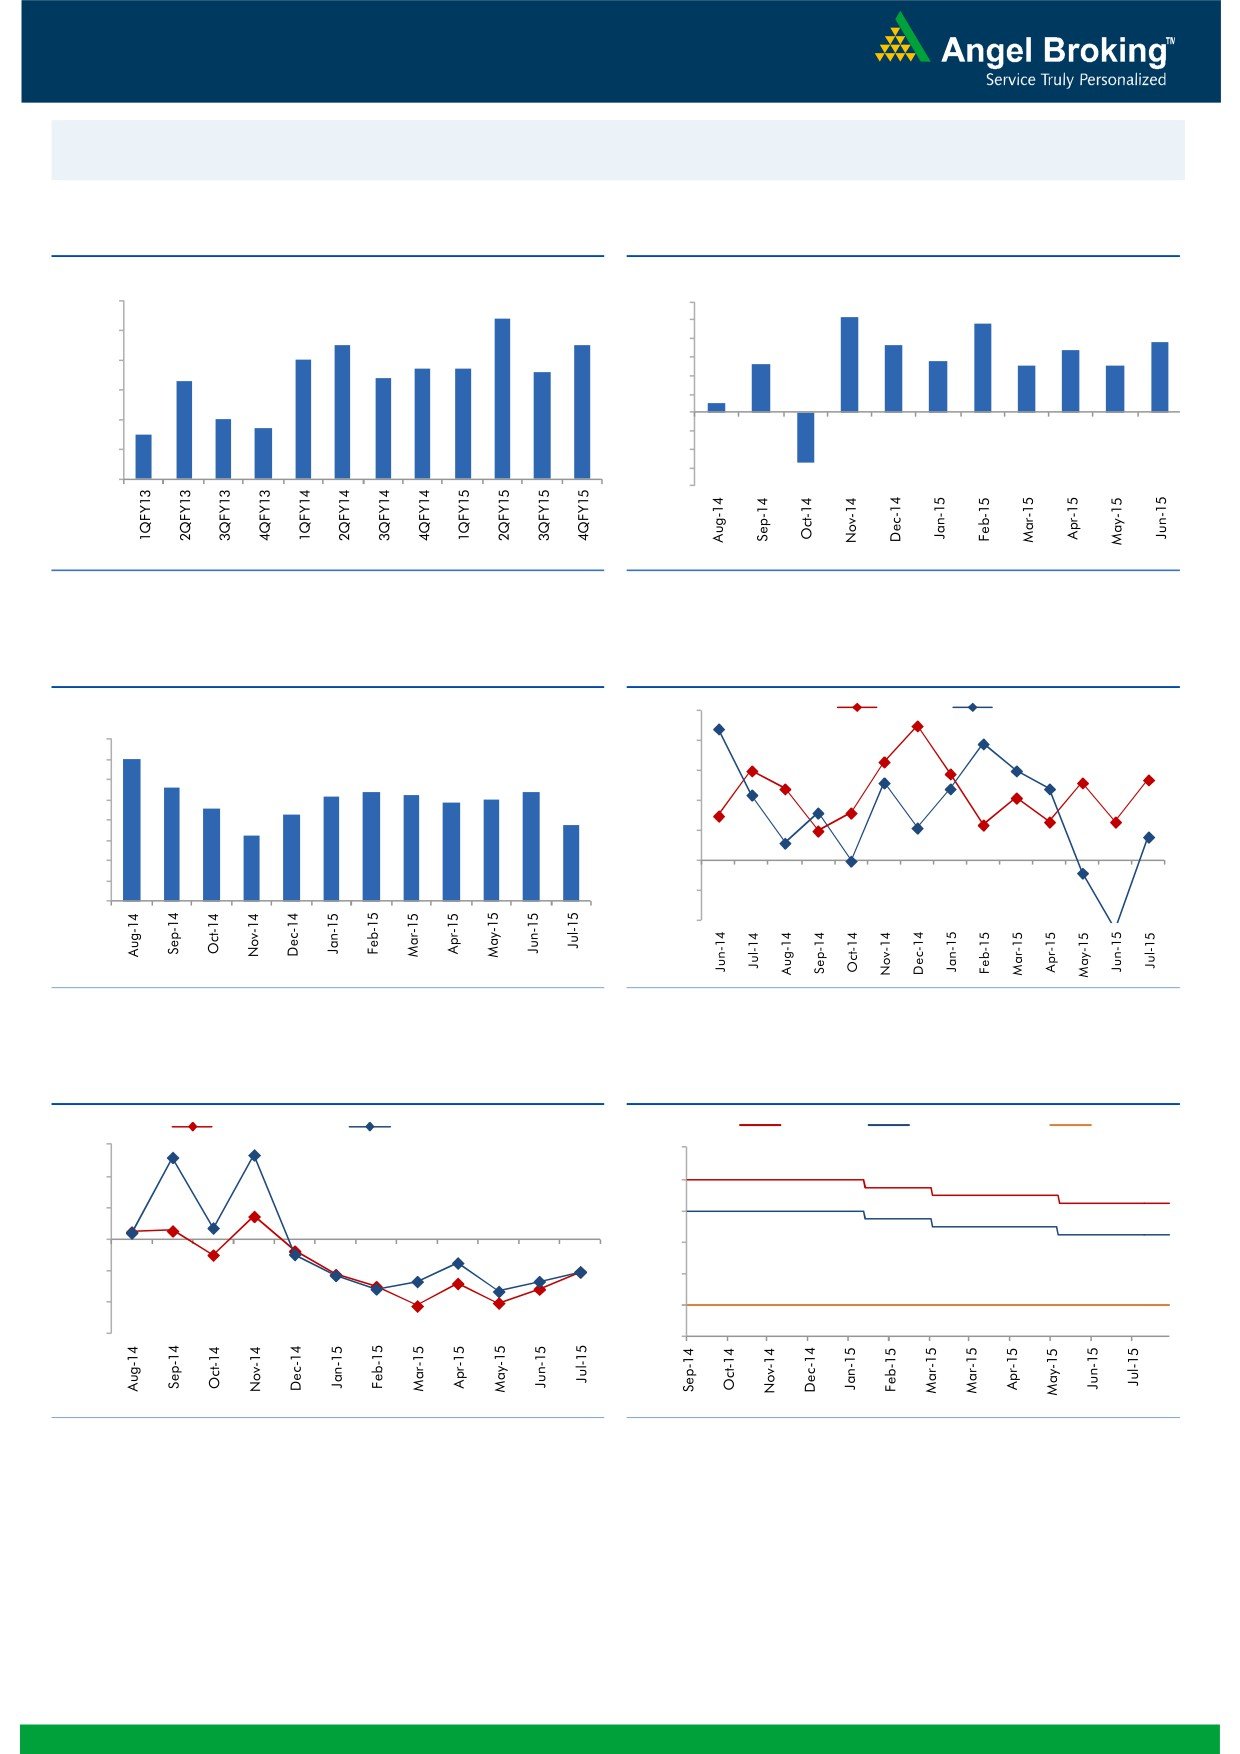
Macro watch
Exhibit 1: Quarterly GDP trends
Exhibit 2: IIP trends
(%)
(%)
9.0
8.4
6.0
5.2
4.8
7.5
7.5
5.0
3.8
8.0
3.6
3.4
7.0
4.0
2.8
6.7
6.7
2.6
2.5
2.5
7.0
6.3
6.4
6.6
3.0
2.0
6.0
0.5
1.0
5.0
4.7
-
5.0
4.5
(1.0)
4.0
(2.0)
(3.0)
3.0
(2.7)
(4.0)
Source: CSO, Angel Research
Source: MOSPI, Angel Research
Exhibit 3: Monthly CPI inflation trends
Exhibit 4: Manufacturing and services PMI
(%)
55.0
Mfg. PMI
Services PMI
8.0
7.0
54.0
7.0
5.6
53.0
6.0
5.2
5.4
5.3
5.4
4.9
5.0
4.6
5.0
4.3
52.0
3.8
4.0
3.3
51.0
3.0
2.0
50.0
1.0
49.0
-
48.0
Source: MOSPI, Angel Research
Source: Market, Angel Research; Note: Level above 50 indicates expansion
Exhibit 5: Exports and imports growth trends
Exhibit 6: Key policy rates
(%)
Exports yoy growth
Imports yoy growth
(%)
Repo rate
Reverse Repo rate
CRR
30.0
9.00
20.0
8.00
10.0
7.00
0.0
6.00
(10.0)
5.00
(20.0)
4.00
(30.0)
3.00
Source: Bloomberg, Angel Research
Source: RBI, Angel Research
Market Outlook
August 27, 2015
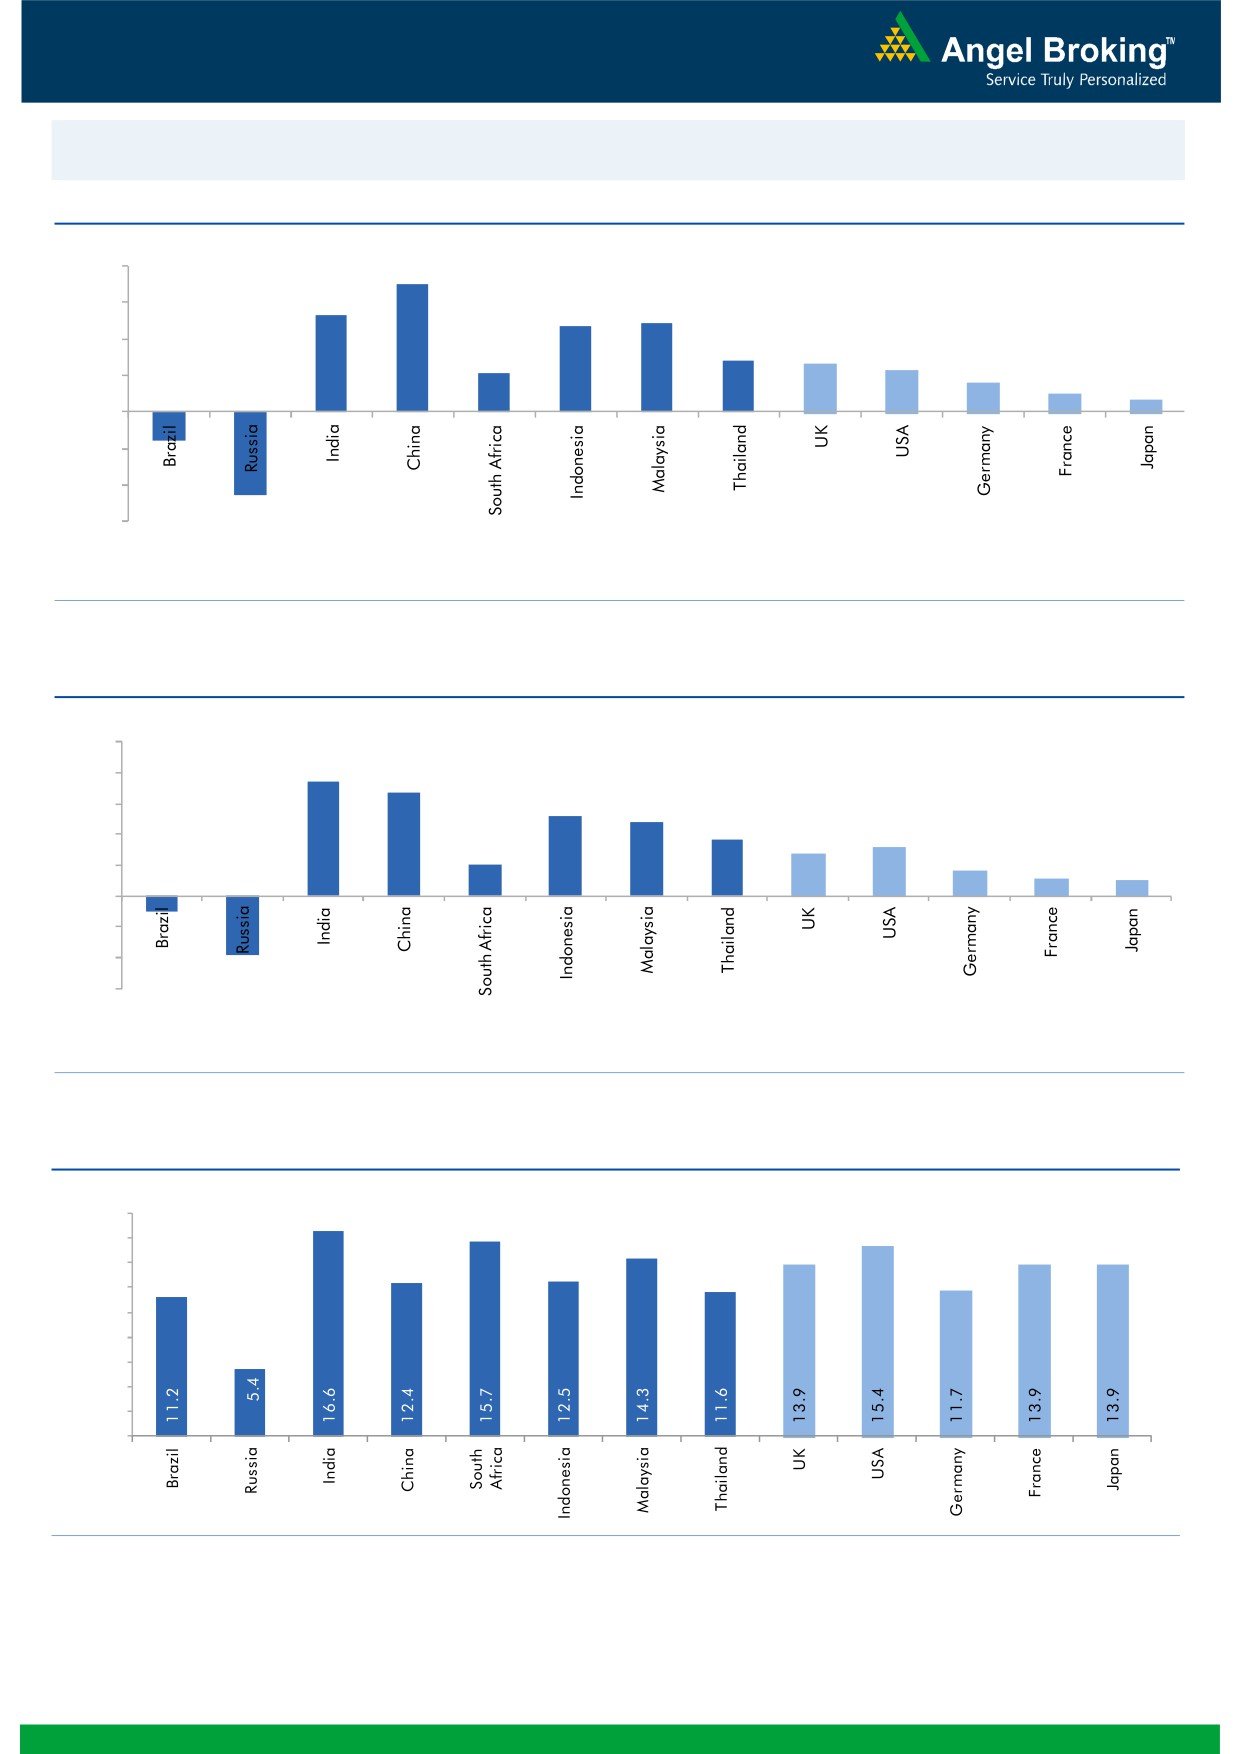
Global watch
Exhibit 1: Latest quarterly GDP Growth (%, yoy) across select developing and developed countries
(%)
8.0
7.0
6.0
5.3
4.9
4.7
4.0
2.8
2.6
2.1
2.3
1.6
2.0
1.0
(1.6)
0.7
(4.6)
-
(2.0)
(4.0)
(6.0)
Source: Bloomberg, Angel Research
Exhibit 2: 2015 GDP Growth projection by IMF (%, yoy) across select developing and developed countries
(%)
10.0
7.5
8.0
6.8
5.2
6.0
4.8
3.7
3.1
4.0
2.7
2.0
1.6
1.2
1.0
2.0
(3.8)
(1.0)
-
(2.0)
(4.0)
(6.0)
Source: IMF, Angel Research
Exhibit 3: One year forward P-E ratio across select developing and developed countries
(x)
18.0
16.0
14.0
12.0
10.0
8.0
6.0
4.0
2.0
-
Source: Bloomberg, Angel Research
Market Outlook
August 27, 2015
Exhibit 4: Relative performance of indices across globe
Returns (%)
Country
Name of index
Closing price
1M
3M
1YR
Brazil
Bovespa
46,038
(5.5)
(14.2)
(21.2)
Russia
Micex
1,661
4.8
(0.0)
14.2
India
Nifty
7,792
(6.8)
(6.3)
(1.3)
China
Shanghai Composite
2,927
(21.4)
(40.8)
30.7
South Africa
Top 40
42,854
(6.6)
(8.7)
(7.3)
Mexico
Mexbol
42,323
(3.2)
(5.5)
(6.9)
Indonesia
LQ45
711
(14.2)
(22.9)
(19.8)
Malaysia
KLCI
1,580
(6.8)
(9.8)
(15.4)
Thailand
SET 50
857
(9.6)
(14.9)
(17.3)
USA
Dow Jones
16,286
(6.6)
(10.3)
(4.9)
UK
FTSE
5,979
(8.1)
(15.1)
(12.3)
Japan
Nikkei
18,377
(7.7)
(8.7)
21.4
Germany
DAX
9,997
(9.6)
(14.4)
4.3
France
CAC
4,501
(8.7)
(12.4)
2.8
Source: Bloomberg, Angel Research
Market Outlook
August 27, 2015
Stock Watch
Company Name
Reco
CMP
Target
Mkt Cap
Sales ( Čcr )
OPM(%)
EPS (Č)
PER(x)
P/BV(x)
RoE(%)
EV/Sales(x)
(Č)
Price ( Č)
( Č cr )
FY16E FY17E
FY16E
FY17E
FY16E
FY17E
FY16E
FY17E
FY16E
FY17E
FY16E
FY17E
FY16E
FY17E
Agri / Agri Chemical
Rallis
Neutral
212
-
4,121
2,075
2,394
14.4
14.4
9.5
11.0
22.3
19.3
4.4
3.8
21.1
21.3
2.0
1.7
United Phosphorus
Neutral
505
-
21,645
13,698
15,752
17.6
17.6
32.1
38.5
15.7
13.1
3.1
2.6
21.4
21.3
1.7
1.4
Auto & Auto Ancillary
Ashok Leyland
Accumulate
88
94
24,901
17,850
20,852
10.6
11.1
3.2
4.3
27.3
20.4
4.5
4.2
16.4
20.8
1.4
1.1
Bajaj Auto
Accumulate
2,244
2,454
64,938
23,842
27,264
19.8
19.6
128.4
144.4
17.5
15.5
5.3
4.6
30.5
29.5
2.3
2.0
Eicher Motors
Buy
18,567
22,859
50,395
11,681
15,550
15.3
16.9
358.5
564.3
51.8
32.9
15.6
11.6
29.8
34.9
4.2
3.1
Hero Motocorp
Accumulate
2,392
2,660
47,764
28,500
33,028
13.8
14.1
144.2
166.3
16.6
14.4
6.1
5.2
36.7
36.0
1.5
1.3
L G Balakrishnan & Bros Neutral
428
-
672
1,254
1,394
11.6
11.8
35.9
41.7
11.9
10.3
1.6
1.4
13.5
13.8
0.6
0.6
Mahindra and Mahindra Buy
1,215
1,493
75,481
40,088
45,176
13.8
14.0
59.6
70.4
20.4
17.3
3.4
3.0
16.6
17.2
1.5
1.3
Maruti
Accumulate
4,204
4,735
127,001
58,102
68,587
16.7
16.9
182.0
225.5
23.1
18.6
4.6
3.9
19.9
21.0
2.0
1.6
Minda Industries
Buy
515
652
817
2,567
2,965
7.3
8.0
38.8
54.3
13.3
9.5
1.9
1.6
14.4
16.8
0.4
0.4
Rane Brake Lining
Buy
292
366
231
454
511
11.1
11.4
23.8
28.1
12.3
10.4
1.7
1.6
14.2
15.3
0.6
0.6
Setco Automotive
Neutral
223
-
597
594
741
12.7
13.7
8.4
15.8
26.6
14.1
2.8
2.4
10.4
16.9
1.5
1.2
Tata Motors
Buy
337
432
97,241
267,464
307,211
13.7
13.7
34.6
40.7
9.7
8.3
1.2
1.1
13.2
13.6
0.5
0.5
TVS Motor
Accumulate
227
255
10,806
11,839
13,985
7.0
8.0
10.8
15.9
21.1
14.3
5.4
4.2
25.5
29.7
0.9
0.7
Amara Raja Batteries
Neutral
1,058
-
18,070
5,101
6,224
17.8
17.6
31.1
39.2
34.0
27.0
8.4
6.7
24.8
24.8
3.5
2.8
Exide Industries
Neutral
153
-
13,001
7,363
8,247
13.7
14.5
6.6
7.7
23.2
19.9
2.9
2.7
12.6
13.3
1.5
1.3
Apollo Tyres
Neutral
179
-
9,114
12,576
12,978
16.8
16.1
22.3
19.9
8.0
9.0
1.4
1.2
17.2
13.4
0.8
0.8
Ceat
Accumulate
1,071
1,166
4,332
6,041
6,597
14.3
14.2
101.5
116.6
10.6
9.2
2.1
1.8
20.0
19.1
0.9
0.7
JK Tyres
Buy
108
129
2,439
7,446
7,669
15.2
14.0
19.6
18.4
5.5
5.9
1.4
1.1
25.2
19.5
0.7
0.6
Swaraj Engines
Neutral
873
-
1,084
593
677
14.5
14.8
51.2
60.8
17.1
14.4
4.0
3.6
23.3
24.8
1.7
1.4
Subros
Neutral
76
-
456
1,268
1,488
11.6
11.9
3.7
6.6
20.5
11.5
1.4
1.3
6.8
11.4
0.7
0.5
Indag Rubber
Neutral
180
-
473
283
329
17.0
17.2
13.0
15.4
13.9
11.7
3.0
2.5
21.8
21.6
1.4
1.1
Capital Goods
ACE
Neutral
39
-
387
660
839
4.7
8.2
1.0
3.9
39.1
10.0
1.2
1.1
3.2
11.3
0.7
0.6
BEML
Neutral
1,264
-
5,265
3,277
4,006
6.0
8.9
29.2
64.3
43.3
19.7
2.4
2.2
5.7
11.7
1.7
1.3
BGR Energy
Neutral
106
-
766
3,615
3,181
9.5
9.4
16.7
12.4
6.4
8.6
0.6
0.6
10.0
7.0
0.6
0.8
BHEL
Neutral
240
-
58,791
33,722
35,272
10.8
11.7
10.5
14.2
22.9
16.9
1.7
1.6
7.0
9.0
1.8
1.7
Blue Star
Accumulate
351
387
3,155
3,649
4,209
5.0
5.9
9.2
14.7
38.4
23.8
6.9
6.5
9.1
17.5
1.0
0.8
Crompton Greaves
Buy
173
204
10,836
13,484
14,687
4.9
6.2
4.5
7.1
38.4
24.4
2.7
2.5
7.2
10.8
0.9
0.8
Inox Wind
Buy
343
505
7,618
4,980
5,943
17.0
17.5
26.6
31.6
12.9
10.9
3.9
2.8
35.0
30.0
1.7
1.4
Market Outlook
August 27, 2015
Stock Watch
Company Name
Reco
CMP
Target
Mkt Cap
Sales ( Čcr )
OPM(%)
EPS (Č)
PER(x)
P/BV(x)
RoE(%)
EV/Sales(x)
(Č)
Price ( Č)
( Č cr )
FY16E
FY17E
FY16E
FY17E
FY16E
FY17E
FY16E
FY17E
FY16E
FY17E
FY16E
FY17E
FY16E
FY17E
Capital Goods
KEC International
Neutral
128
-
3,291
8,791
9,716
6.1
6.8
5.4
8.2
23.7
15.6
2.4
2.2
10.0
14.0
0.6
0.6
Thermax
Neutral
937
-
11,161
6,413
7,525
7.4
8.5
30.5
39.3
30.7
23.8
4.7
4.1
15.0
17.0
1.7
1.4
Cement
ACC
Accumulate
1,361
1,548
25,554
11,856
14,092
14.5
17.8
47.6
76.1
28.6
17.9
2.9
2.7
10.6
15.7
2.0
1.6
Ambuja Cements
Buy
199
233
30,883
10,569
12,022
20.7
22.2
8.7
10.7
22.9
18.6
2.9
2.7
13.0
15.2
2.5
2.2
India Cements
Buy
70
112
2,164
4,716
5,133
15.9
16.9
3.7
7.5
19.0
9.4
0.7
0.7
3.8
7.3
0.8
0.6
JK Cement
Buy
623
767
4,353
4,056
4,748
14.5
17.0
22.6
41.1
27.6
15.2
2.5
2.2
9.3
15.3
1.5
1.3
J K Lakshmi Cement
Buy
331
430
3,899
2,947
3,616
16.7
19.9
11.5
27.2
28.8
12.2
2.7
2.4
9.8
20.8
1.7
1.4
Mangalam Cements
Neutral
222
-
593
1,053
1,347
10.5
13.3
8.4
26.0
26.5
8.6
1.1
1.0
4.3
12.5
0.9
0.7
Orient Cement
Accumulate
164
183
3,360
1,854
2,524
21.2
22.2
7.7
11.1
21.3
14.8
3.1
2.6
13.3
15.7
2.6
1.8
Ramco Cements
Accumulate
325
350
7,742
4,036
4,545
20.8
21.3
15.1
18.8
21.5
17.3
2.6
2.3
12.9
14.3
2.4
2.1
Shree Cement^
Neutral
10,416
-
36,285
7,150
8,742
26.7
28.6
228.0
345.5
45.7
30.2
6.7
5.6
15.7
20.3
4.8
3.9
UltraTech Cement
Accumulate
2,901
3,282
79,614
27,562
31,548
20.4
22.3
111.9
143.3
25.9
20.3
3.7
3.2
15.2
16.8
3.0
2.5
Construction
ITNL
Neutral
89
-
2,191
7,360
8,825
34.0
35.9
1.0
5.0
88.8
17.8
0.4
0.4
0.3
1.4
3.7
3.6
KNR Constructions
Neutral
529
-
1,486
915
1,479
14.3
13.9
20.3
37.2
26.0
14.2
2.4
2.1
9.6
15.6
1.8
1.1
Larsen & Toubro
Buy
1,593
2,013
148,189
68,920
82,446
10.9
11.5
57.0
73.0
27.9
21.8
2.6
2.4
13.6
15.5
2.4
2.0
Gujarat Pipavav Port
Neutral
189
-
9,144
740
843
53.1
53.6
8.0
10.0
23.6
18.9
3.7
3.0
20.4
19.4
11.9
10.1
MBL Infrastructures
Buy
231
360
957
2,313
2,797
12.2
14.6
19.0
20.0
12.2
11.5
1.3
1.2
11.3
10.6
1.1
1.0
Nagarjuna Const.
Neutral
72
72
3,978
7,892
8,842
8.3
9.1
2.4
5.3
29.8
13.5
1.2
1.1
4.2
8.6
0.7
0.6
PNC Infratech
Neutral
447
-
2,294
1,798
2,132
13.2
13.5
22.0
30.0
20.3
14.9
1.8
1.6
11.5
11.4
1.4
1.2
Simplex Infra
Neutral
302
302
1,494
6,241
7,008
10.4
10.7
20.0
36.0
15.1
8.4
1.2
1.1
6.8
11.1
0.7
0.6
Financials
Allahabad Bank
Neutral
83
-
4,762
8,859
9,817
3.0
3.0
23.7
30.1
3.5
2.8
0.4
0.3
10.6
12.3
-
-
Axis Bank
Buy
496
716
117,876
26,522
31,625
3.6
3.6
36.2
45.4
13.7
10.9
2.7
2.3
18.2
19.6
-
-
Bank of Baroda
Neutral
177
-
39,155
18,934
21,374
2.0
2.0
13.2
15.1
13.4
11.7
1.0
0.9
7.1
7.7
-
-
Bank of India
Neutral
139
-
9,249
17,402
20,003
2.0
2.1
40.3
50.7
3.5
2.7
0.3
0.3
9.0
10.4
-
-
Canara Bank
Neutral
279
-
14,364
15,805
17,745
2.0
2.2
64.3
73.5
4.3
3.8
0.5
0.4
10.8
11.3
-
-
Dena Bank
Neutral
43
-
2,385
3,580
4,040
2.1
2.2
8.4
10.9
5.1
3.9
0.4
0.4
6.8
8.4
-
-
Federal Bank
Neutral
61
-
10,392
3,522
4,045
3.2
3.2
12.2
14.1
5.0
4.3
0.6
0.6
12.9
13.4
-
-
HDFC
Neutral
1,102
-
173,788
11,198
13,321
3.5
3.5
45.1
53.7
24.5
20.5
5.1
4.5
27.2
28.2
-
-
HDFC Bank
Buy
1,016
1,255
255,346
38,629
47,500
4.5
4.7
52.6
66.4
19.3
15.3
3.5
3.0
19.6
21.2
-
-
Market Outlook
August 27, 2015
Stock Watch
Company Name
Reco
CMP
Target
Mkt Cap
Sales ( Čcr )
OPM(%)
EPS (Č)
PER(x)
P/BV(x)
RoE(%)
EV/Sales(x)
(Č)
Price ( Č)
( Č cr )
FY16E FY17E
FY16E
FY17E
FY16E
FY17E
FY16E
FY17E
FY16E
FY17E
FY16E
FY17E
FY16E
FY17E
Financials
ICICI Bank
Buy
278
370
161,652
36,037
41,647
3.5
3.6
22.9
26.7
12.1
10.4
2.0
1.8
15.7
15.9
-
-
IDBI Bank
Neutral
56
-
8,998
9,806
11,371
1.7
1.9
10.0
16.3
5.6
3.4
0.4
0.4
6.8
10.4
-
-
Indian Bank
Neutral
134
-
6,429
6,454
7,321
2.5
2.6
26.4
33.3
5.1
4.0
0.4
0.4
8.1
9.6
-
-
LIC Housing Finance
Buy
427
590
21,539
2,934
3,511
2.3
2.3
30.9
36.8
13.8
11.6
2.2
1.9
16.8
17.5
-
-
Oriental Bank
Neutral
130
-
3,901
7,930
8,852
2.5
2.5
51.8
57.1
2.5
2.3
0.3
0.3
9.3
9.5
-
-
Punjab Natl.Bank
Neutral
142
-
26,409
24,160
27,777
2.9
3.0
18.5
24.6
7.7
5.8
0.8
0.6
8.8
10.8
-
-
South Ind.Bank
Neutral
20
-
2,727
1,999
2,249
2.4
2.4
3.5
4.0
5.8
5.0
0.7
0.7
12.6
13.1
-
-
St Bk of India
Buy
246
309
185,978
86,900
100,550
3.1
3.1
22.1
27.7
11.1
8.9
1.4
1.2
12.7
14.3
-
-
Union Bank
Neutral
170
-
10,811
12,995
14,782
2.4
2.4
32.3
40.9
5.3
4.2
0.6
0.5
10.7
12.3
-
-
Vijaya Bank
Neutral
36
-
3,050
3,474
3,932
1.8
1.9
5.9
7.2
6.1
4.9
0.5
0.5
8.1
9.3
-
-
Yes Bank
Buy
682
989
28,518
7,006
8,825
3.1
3.3
61.4
77.1
11.1
8.8
2.1
1.7
20.1
21.3
-
-
FMCG
Asian Paints
Neutral
854
-
81,930
16,553
19,160
16.0
16.2
17.7
21.5
48.3
39.7
12.8
11.5
29.4
31.2
4.8
4.1
Britannia
Neutral
2,886
-
34,620
8,065
9,395
9.6
10.2
47.2
65.5
61.1
44.1
20.3
19.2
38.3
41.2
4.1
3.6
Colgate
Accumulate
1,919
2,022
26,093
4,836
5,490
19.5
19.7
48.5
53.2
39.6
36.1
29.0
25.3
99.8
97.5
5.3
4.7
Dabur India
Neutral
275
-
48,304
9,370
10,265
17.1
17.2
7.3
8.1
37.5
33.9
11.3
9.2
33.7
30.6
5.1
4.6
GlaxoSmith Con*
Neutral
6,016
-
25,301
4,919
5,742
17.2
17.4
168.3
191.2
35.8
31.5
10.1
8.6
28.8
28.9
4.7
4.0
Godrej Consumer
Neutral
1,240
-
42,228
10,168
12,886
16.1
16.1
32.1
38.4
38.6
32.3
7.9
7.3
19.7
21.0
4.3
3.3
HUL
Neutral
858
-
185,745
34,940
38,957
17.5
17.7
20.8
24.7
41.3
34.8
45.9
36.7
110.5
114.2
5.1
4.6
ITC
Buy
318
409
254,864
41,068
45,068
37.8
37.4
13.9
15.9
22.8
20.0
7.7
6.7
34.1
33.8
5.8
5.3
Marico
Neutral
400
-
25,813
6,551
7,766
15.7
16.0
10.4
12.5
38.6
32.0
11.2
9.3
33.2
32.4
3.9
3.3
Nestle*
Accumulate
6,063
6,646
58,461
11,291
12,847
22.2
22.3
158.9
184.6
38.2
32.9
20.0
17.9
55.0
57.3
5.0
4.4
Tata Global
Buy
117
152
7,397
8,635
9,072
9.8
9.9
6.5
7.6
18.1
15.4
1.8
1.7
6.8
7.4
0.8
0.8
IT
HCL Tech^
Buy
904
1,132
127,056
42,038
47,503
23.5
23.5
56.4
62.9
16.0
14.4
3.7
2.8
23.2
19.8
2.6
2.1
Infosys
Buy
1,065
1,306
244,705
60,250
66,999
28.0
28.0
58.3
63.7
18.3
16.7
3.8
3.3
20.9
19.7
3.4
2.9
TCS
Buy
2,577
3,168
504,715
108,420
123,559
28.8
28.7
127.2
143.9
20.3
17.9
8.1
7.5
39.9
41.8
4.2
3.7
Tech Mahindra
Buy
507
646
48,792
25,566
28,890
16.0
17.0
26.3
31.9
19.3
15.9
3.5
3.0
17.9
18.6
1.7
1.4
Wipro
Buy
550
719
135,766
52,414
58,704
23.7
23.8
38.4
42.3
14.3
13.0
2.8
2.5
19.5
18.0
2.2
1.8
Media
D B Corp
Buy
305
356
5,602
2,241
2,495
27.8
27.9
21.8
25.6
14.0
11.9
3.7
3.2
26.7
28.5
2.4
2.2
HT Media
Neutral
84
-
1,959
2,495
2,603
11.2
11.2
7.3
8.6
11.5
9.8
0.9
0.8
7.4
8.1
0.3
0.3
Market Outlook
August 27, 2015
Stock Watch
Company Name
Reco
CMP
Target
Mkt Cap
Sales ( Čcr )
OPM(%)
EPS (Č)
PER(x)
P/BV(x)
RoE(%)
EV/Sales(x)
(Č)
Price ( Č)
( Č cr )
FY16E FY17E
FY16E
FY17E
FY16E
FY17E
FY16E
FY17E
FY16E
FY17E
FY16E
FY17E
FY16E
FY17E
Media
Jagran Prakashan
Buy
132
156
4,319
1,939
2,122
26.0
26.0
8.3
9.2
15.9
14.4
2.7
2.5
17.5
17.1
2.2
2.0
Sun TV Network
Neutral
326
-
12,837
2,779
3,196
70.2
70.5
22.8
27.3
14.3
11.9
3.5
3.2
26.7
28.3
4.4
3.8
Hindustan Media
Buy
215
292
1,578
920
1,031
20.0
20.0
19.2
20.9
11.2
10.3
1.8
1.6
16.4
15.3
1.3
1.1
Ventures
Metals & Mining
Coal India
Accumulate
358
400
226,252
72,015
78,415
21.2
21.5
21.7
25.3
16.5
14.2
5.6
5.5
33.1
39.1
2.4
2.2
Hind. Zinc
Neutral
127
-
53,746
15,546
16,821
47.5
49.0
19.7
20.3
6.5
6.3
1.1
1.0
17.2
16.6
1.2
0.8
Hindalco
Neutral
81
-
16,664
112,328
119,817
7.7
7.9
16.3
20.1
5.0
4.0
0.4
0.3
8.0
8.5
0.6
0.5
JSW Steel
Neutral
889
-
21,477
48,125
53,595
18.8
21.0
46.9
97.5
18.9
9.1
0.9
0.9
4.4
9.5
1.3
1.1
NMDC
Neutral
92
-
36,654
12,544
13,330
59.5
59.7
16.3
16.5
5.7
5.6
1.0
0.9
5.1
9.9
1.7
1.6
SAIL
Neutral
49
-
20,279
56,365
63,383
6.9
8.0
7.1
8.2
6.9
6.0
0.4
0.4
7.0
7.1
0.9
0.8
Vedanta
Neutral
86
-
25,363
81,842
88,430
30.6
32.8
20.2
25.7
4.2
3.3
0.3
0.3
7.5
8.5
0.7
0.5
Tata Steel
Neutral
216
-
20,930
136,805
149,228
11.3
11.9
26.4
36.8
8.2
5.9
0.7
0.6
6.0
8.0
0.7
0.6
Oil & Gas
Cairn India
Neutral
130
-
24,326
12,617
14,513
33.7
40.0
25.5
27.7
5.1
4.7
0.4
0.4
7.4
7.7
0.6
0.5
GAIL
Neutral
282
-
35,784
75,595
85,554
8.6
8.0
31.8
36.1
8.9
7.8
1.0
0.9
10.7
11.4
0.6
0.5
ONGC
Neutral
225
-
192,456
174,773
192,517
22.7
24.8
34.6
38.2
6.5
5.9
0.9
0.9
14.2
14.9
1.2
1.1
Petronet LNG
Buy
179
210
13,403
39,007
40,785
3.8
4.2
9.2
11.0
19.5
16.3
2.2
2.0
11.6
12.7
0.4
0.4
Indian Oil Corp
Buy
394
455
95,637
359,607
402,760
5.9
6.1
42.5
48.7
9.3
8.1
1.2
1.1
14.1
14.4
0.4
0.3
Reliance Industries
Buy
853
1,050
276,360
339,083
384,014
7.8
9.5
75.7
94.5
11.3
9.0
1.1
1.1
10.7
12.2
1.1
1.0
Pharmaceuticals
Alembic Pharma
Neutral
691
-
13,019
2,601
3,115
21.2
20.2
20.8
23.9
33.2
28.9
10.7
8.1
37.2
31.8
5.0
4.1
Aurobindo Pharma
Accumulate
723
824
42,221
14,435
16,600
22.6
22.6
36.1
41.2
20.0
17.6
6.0
4.5
34.5
29.3
3.3
2.8
Aventis*
Neutral
3,913
-
9,011
2,156
2,455
15.1
16.8
109.7
133.9
35.7
29.2
4.9
4.0
18.4
22.5
3.9
3.2
Cadila Healthcare
Neutral
1,835
-
37,580
10,224
11,840
20.0
21.0
71.0
85.6
25.9
21.4
6.9
5.5
30.1
28.5
3.7
3.2
Cipla
Neutral
636
-
51,081
14,051
16,515
20.4
18.7
26.6
28.4
23.9
22.4
4.0
3.4
18.2
16.5
3.6
3.0
Dr Reddy's
Neutral
4,058
-
69,185
17,903
20,842
22.7
22.8
160.5
189.5
25.3
21.4
5.1
4.2
22.2
21.7
3.8
3.2
Dishman Pharma
Buy
192
269
1,550
1,716
1,888
20.2
20.2
16.3
21.6
11.8
8.9
1.1
1.0
9.7
11.7
1.1
0.9
GSK Pharma*
Neutral
3,373
-
28,571
2,870
3,158
20.0
22.1
59.5
68.3
56.7
49.4
16.7
17.2
28.5
34.3
9.5
8.6
Indoco Remedies
Neutral
329
-
3,029
1,088
1,262
18.2
18.2
13.1
15.5
25.1
21.2
4.9
4.1
21.2
21.1
2.8
2.5
Ipca labs
Neutral
768
-
9,696
3,507
4,078
17.6
18.6
25.8
32.0
29.8
24.0
3.9
3.3
13.8
14.9
3.0
2.6
Lupin
Neutral
1,812
-
81,518
14,864
17,244
26.9
26.9
62.1
71.1
29.2
25.5
7.1
5.6
27.4
24.6
5.2
4.4
Sun Pharma
Accumulate
873
950
210,082
28,163
32,610
25.8
30.7
17.4
26.9
50.2
32.5
4.8
4.1
13.0
16.6
6.9
5.8
Market Outlook
August 27, 2015
Stock Watch
Company Name
Reco
CMP
Target
Mkt Cap
Sales ( Čcr )
OPM(%)
EPS (Č)
PER(x)
P/BV(x)
RoE(%)
EV/Sales(x)
(Č)
Price ( Č)
( Č cr )
FY16E FY17E
FY16E
FY17E
FY16E
FY17E
FY16E
FY17E
FY16E
FY17E
FY16E
FY17E
FY16E
FY17E
Power
Tata Power
Neutral
60
-
16,282
38,302
38,404
14.1
13.1
5.1
6.0
11.7
10.1
1.1
1.1
9.2
10.3
1.3
1.3
NTPC
Buy
120
157
98,739
87,064
98,846
23.5
23.5
11.7
13.2
10.2
9.1
1.1
1.1
11.4
12.1
2.2
1.9
Power Grid
Buy
131
170
68,455
20,702
23,361
86.7
86.4
12.1
13.2
10.8
9.9
1.6
1.4
15.6
15.1
8.2
7.7
Telecom
Bharti Airtel
Neutral
340
-
135,812
101,748
109,191
32.1
31.7
12.0
12.5
28.3
27.2
1.9
1.8
6.9
6.7
2.0
1.8
Idea Cellular
Neutral
152
-
54,574
34,282
36,941
32.0
31.5
5.9
6.2
25.7
24.5
2.4
2.1
9.9
9.3
2.2
2.0
zOthers
Abbott India
Neutral
4,675
-
9,934
2,715
3,153
14.5
14.1
134.3
152.2
34.8
30.7
8.7
7.2
27.4
25.6
3.4
2.8
Bajaj Electricals
Buy
228
341
2,296
4,719
5,287
5.2
5.8
8.6
12.7
26.6
18.0
3.0
2.7
11.4
14.8
0.5
0.4
Finolex Cables
Neutral
237
-
3,632
2,728
3,036
10.8
11.0
14.4
16.8
16.5
14.2
2.5
2.2
15.2
15.3
1.1
0.9
Goodyear India*
Accumulate
573
655
1,322
1,953
1,766
12.4
12.0
67.4
59.6
8.5
9.6
2.1
1.8
27.7
20.2
0.5
0.4
Hitachi
Neutral
1,317
-
3,582
1,806
2,112
9.0
9.2
28.6
29.1
46.1
45.3
11.5
9.2
28.1
22.6
2.1
1.7
Jyothy Laboratories
Neutral
296
-
5,356
1,620
1,847
11.5
11.5
7.3
8.5
40.6
34.9
5.2
4.9
13.3
14.4
3.2
2.7
MRF
Accumulate
40,089
43,575
17,002
20,727
14,841
19.3
18.6
4,905.8
3,351.9
8.2
12.0
2.6
2.1
37.6
19.6
0.8
1.0
Page Industries
Neutral
13,832
-
15,428
1,929
2,450
19.8
20.1
229.9
299.0
60.2
46.3
26.6
18.5
52.1
47.1
8.0
6.3
Relaxo Footwears
Neutral
495
-
5,942
1,767
2,152
12.3
12.5
19.3
25.1
25.7
19.8
6.3
4.9
27.7
27.8
3.4
2.8
Siyaram Silk Mills
Buy
1,050
1,221
984
1,653
1,873
11.7
12.2
99.3
122.1
10.6
8.6
1.9
1.6
19.5
20.2
0.8
0.7
Styrolution ABS India*
Neutral
740
-
1,301
1,271
1,440
8.6
9.2
32.0
41.1
23.1
18.0
2.4
2.1
10.7
12.4
1.0
0.9
Tree House
Buy
377
449
1,595
259
324
56.8
56.8
17.0
21.7
22.2
17.4
2.2
2.0
10.1
11.5
6.1
5.0
TVS Srichakra
Buy
2,578
3,210
1,974
2,127
2,388
15.2
14.9
237.7
267.5
10.9
9.6
4.6
3.3
51.7
39.8
1.0
0.8
HSIL
Buy
265
434
1,913
2,085
2,436
18.5
18.6
21.7
28.9
12.2
9.2
1.2
1.1
10.0
12.1
1.0
0.8
Kirloskar Engines India
Accumulate
270
297
3,908
2,634
3,252
10.1
12.0
10.9
17.4
24.8
15.5
2.8
2.5
11.4
16.8
1.1
0.9
Ltd
M M Forgings
Buy
614
797
741
563
671
22.1
22.9
51.0
66.5
12.0
9.2
2.5
2.0
23.1
24.1
1.5
1.2
Banco Products (India)
Neutral
117
-
840
1,208
1,353
11.0
12.3
10.8
14.5
10.9
8.1
1.3
1.1
11.9
14.5
0.7
0.6
Competent Automobiles Neutral
162
-
99
1,007
1,114
3.1
3.1
23.7
28.2
6.8
5.7
1.0
0.8
13.9
14.6
0.1
0.1
Nilkamal
Accumulate
943
1,005
1,407
1,948
2,147
10.6
10.3
60.0
67.0
15.7
14.1
2.5
2.1
16.8
16.1
0.8
0.7
Visaka Industries
Accumulate
146
166
232
1,158
1,272
8.6
9.5
23.7
32.7
6.2
4.5
0.6
0.6
10.1
12.5
0.4
0.3
Transport Corporation of
Buy
225
293
1,714
2,830
3,350
8.8
9.0
14.4
18.3
15.7
12.3
2.4
2.1
15.4
17.1
0.7
0.6
India
Elecon Engineering
Buy
70
87
765
1,452
1,596
14.0
14.7
4.4
6.2
15.9
11.3
1.3
1.2
8.6
11.2
0.8
0.7
Surya Roshni
Buy
121
183
531
2,992
3,223
8.3
8.5
14.7
18.3
8.2
6.6
0.8
0.7
9.8
11.0
0.5
0.4
MT Educare
Buy
130
169
516
286
366
18.3
17.7
7.7
9.4
16.8
13.8
3.5
3.1
20.2
21.1
1.7
1.3
Market Outlook
August 27, 2015
Stock Watch
Company Name
Reco
CMP
Target Mkt Cap
Sales ( Čcr )
OPM(%)
EPS (Č)
PER(x)
P/BV(x)
RoE(%)
EV/Sales(x)
(Č)
Price ( Č)
( Č cr )
FY16E FY17E FY16E FY17E FY16E FY17E FY16E FY17E FY16E FY17E FY16E FY17E FY16E FY17E
zOthers
Radico Khaitan
Buy
90
112
1,201
1,565
1,687
11.9
12.4
5.4
6.6
16.7
13.7
1.3
1.2
8.0
9.0
1.3
1.2
Garware Wall Ropes
Buy
288
390
630
875
983
10.4
10.6
23.1
27.8
12.5
10.4
1.8
1.5
14.1
14.8
0.7
0.6
Source: Company, Angel Research; Note: *December year end; #September year end; &October year end; Price as on August 26, 2015
Market Outlook
August 27, 2015
Research Team Tel: 022 - 39357800
DISCLAIMER
Angel Broking Private Limited (hereinafter referred to as “Angel”) is a registered Member of National Stock Exchange of India Limited,
Bombay Stock Exchange Limited and MCX Stock Exchange Limited. It is also registered as a Depository Participant with CDSL and
Portfolio Manager with SEBI. It also has registration with AMFI as a Mutual Fund Distributor. Angel Broking Private Limited is a registered
entity with SEBI for Research Analyst in terms of SEBI (Research Analyst) Regulations, 2014 vide registration number INH000000164.
Angel or its associates has not been debarred/ suspended by SEBI or any other regulatory authority for accessing /dealing in securities
Market. Angel or its associates including its relatives/analyst do not hold any financial interest/beneficial ownership of more than 1% in
the company covered by Analyst. Angel or its associates/analyst has not received any compensation / managed or co-managed public
offering of securities of the company covered by Analyst during the past twelve months. Angel/analyst has not served as an officer,
director or employee of company covered by Analyst and has not been engaged in market making activity of the company covered by
Analyst.
This document is solely for the personal information of the recipient, and must not be singularly used as the basis of any investment
decision. Nothing in this document should be construed as investment or financial advice. Each recipient of this document should make
such investigations as they deem necessary to arrive at an independent evaluation of an investment in the securities of the companies
referred to in this document (including the merits and risks involved), and should consult their own advisors to determine the merits and
risks of such an investment.
Reports based on technical and derivative analysis center on studying charts of a stock's price movement, outstanding positions and
trading volume, as opposed to focusing on a company's fundamentals and, as such, may not match with a report on a company's
fundamentals.
The information in this document has been printed on the basis of publicly available information, internal data and other reliable sources
believed to be true, but we do not represent that it is accurate or complete and it should not be relied on as such, as this document is for
general guidance only. Angel Broking Pvt. Limited or any of its affiliates/ group companies shall not be in any way responsible for any
loss or damage that may arise to any person from any inadvertent error in the information contained in this report. Angel Broking Pvt.
Limited has not independently verified all the information contained within this document. Accordingly, we cannot testify, nor make any
representation or warranty, express or implied, to the accuracy, contents or data contained within this document. While Angel Broking
Pvt. Limited endeavors to update on a reasonable basis the information discussed in this material, there may be regulatory, compliance,
or other reasons that prevent us from doing so.
This document is being supplied to you solely for your information, and its contents, information or data may not be reproduced,
redistributed or passed on, directly or indirectly.
Neither Angel Broking Pvt. Limited, nor its directors, employees or affiliates shall be liable for any loss or damage that may arise from or
in connection with the use of this information.
Note: Please refer to the important ‘Stock Holding Disclosure' report on the Angel website (Research Section). Also, please refer to the
latest update on respective stocks for the disclosure status in respect of those stocks. Angel Broking Pvt. Limited and its affiliates may have
investment positions in the stocks recommended in this report.