Market Outlook
November 26, 2015
Market Cues
Domestic Indices
Chg (%)
(Pts)
(Close)
Indian markets are expected to open positively tracking the SGX Nifty and global
BSE Sensex
(0.2)
(44)
25,776
cues.
Nifty
(0.2)
(18)
7,832
U.S. stocks closed flat in a quiet trading session with gains in health care and
Mid Cap
0.1
9
10,906
consumer stocks after data showed thath the economy had a modest growth. Market
Small Cap
0.3
38
11,458
trading volumes were low as many market participants were awayin the last session
Bankex
(0.3)
(62)
19,429
of the week as the markets are shut for Thursday and most of the Firday afternoon.
The European markets rallied on a report that European Central bank is
Global Indices
Chg (%)
(Pts)
(Close)
contemplating expanding its stimulus to boost the economy.
Dow Jones
0.0
1
17,813
Indian markets closed with marginal losses in a volatile trading session. Decline in
Nasdaq
0.3
13
5,116
the capital goods heavyweights (L&T, Siemens, ABB India and Thermax) led to
indices closing marginally in losses.
FTSE
1.0
60
6,338
Nikkei
0.2
45
19,925
News & Result Analysis
Hang Seng
(0.4)
(78)
22,588
Lupin Receives FDA Approvals for Generic Loestrin® Fe 1/20 and
Shanghai Com
0.2
6
3,616
Loestrin®1.5/30 Tablets
Idea Cellular to buy Videocon spectrum in Gujarat, UP for `3,310 cr
Detailed analysis on Pg2
Advances / Declines
BSE
NSE
Advances
1,475
840
Investor’s Ready Reckoner
Declines
1,182
674
Key Domestic & Global Indicators
Unchanged
205
77
Stock Watch: Latest investment recommendations on 150+ stocks
Refer P4 onwards
Volumes (` Cr)
Top Picks
BSE
2,738
CMP
Target
Upside
Company
Sector
Rating
NSE
15,852
(`)
(`)
(%)
Axis Bank
Financials
Buy
464
630
35.7
HCL Tech
IT
Buy
866
1,132
30.7
Net Inflows (` Cr)
Net
Mtd
Ytd
ICICI Bank
Financials
Buy
263
357
35.4
FII
(28)
(4,474)
(19,294)
Ashok Leyland
Automobiles
Buy
95
111
17.2
MFs
144
4,197
54,544
Larsen & Toubro
Construction
Buy
1,342
1,646
22.6
More Top Picks on Pg4
Top Gainers
Price (`)
Chg (%)
Key Upcoming Events
Rcom
71
9.3
Previous
Consensus
Date
Region
Event Description
Mrpl
60
7.0
Reading
Expectations
Fsl
43
5.9
Nov 27
UK
GDP (QoQ) (Q3)
0.5%
0.5%
Dec 1
China
Manufacturing PMI (Nov)
49.8
-
Gmrinfra
15
5.5
Dec 1
Germany
Manufacturing PMI (Nov)
52.6
-
Rtnpower
10
5.4
Dec 1
India
RBI Repo Rate
6.75%
-
Top Losers
Price (`)
Chg (%)
Emami
931
(5.2)
Aiaeng
906
(3.2)
Bankindia
125
(3.0)
Bosch
18,445
(3.0)
Geship
375
(2.8)
As on November 24, 2015
Market Outlook
November 26, 2015
Lupin Receives FDA Approvals for Generic Loestrin® Fe 1/20 and
Loestrin®1.5/30 Tablets
Pharma Major Lupin Limited (Lupin) announced today that it has received final
approvals for its Blisovi® Fe 1/20 Tablets (Norethindrone Acetate and Ethinyl
Estradiol Tablets USP, 1 mg/0.02 mg and Ferrous Fumarate Tablets, 75 mg) and
Blisovi® 1.5/30 Tablets (Norethindrone Acetate and Ethinyl Estradiol Tablets USP,
1.5 mg/0.03 mg and Ferrous Fumarate Tablets, 75 mg) from the United States
Food and Drug Administration (FDA) to market generic versions of Warner
Chilcott's Loestrin® Fe 1/20 Tablets (Norethindrone Acetate and Ethinyl Estradiol
Tablets USP, 1 mg/0.02 mg and Ferrous Fumarate Tablets, 75 mg) and Loestrin®
Fe 1.5/30 Tablets (Norethindrone Acetate and Ethinyl Estradiol Tablets USP, 1.5
mg/0.03 mg and Ferrous Fumarate Tablets, 75 mg). Lupin’s US subsidiary, Lupin
Pharmaceuticals Inc. shall commence promoting the product in the US shortly.
Lupin's Blisovi® Fe 1/20 Tablets and Blisovi® 1.5/30 Tablets are the AB rated
generic equivalent of Warner Chilcott's Loestrin® Fe 1/20 Tablets and Loestrin®
Fe 1.5/30 Tablets and are indicated for the prevention of pregnancy in women
who elect to use oral contraceptives as a method of contraception. Loestrin® Fe
1/20 had US sales of US $139.7mn (IMS MAT September 2015) while Loestrin®
Fe 1.5/30 had US sales of US $55.5mn (IMS MAT September 2015). The product
is highly competitive and hence we don’t expect any major contribution coming
through. We maintain our neutral stance on the stock.
In 4G push, Idea Cellular to buy Videocon spectrum in Gujarat,
UP for Rs 3,310 cr
Idea Cellular Ltd, India's third-biggest mobile phone operator, has agreed to buy
radio airwaves in two services areas from smaller rival Videocon
Telecommunications for `3,310 crore to boost its high-speed data services.The
deal comes a month after the government allowed carriers to trade mobile
airwaves. Idea plans to use the acquired spectrum for launching 4G broadband
services in Gujarat and Uttar Pradesh (west), the company said in a statement.
This is first such spectrum sale in the country. Along with the right to use spectrum,
Idea will also be taking over the outstanding liability of Videocon, which it has to
pay to government for these set of airwaves.Videocon had acquired spectrum in
1800 Mhz band, known as 2G spectrum, in these two service areas for a total of
`1,329 crore in November 2012 and made upfront payment of `438.57 crore to
the government.
Videocon Telecom said it also plans to sell spectrum in low-scale operation circles
of UP East and Bihar and is seeking a value of Rs 3,500 crore. The company had
won spectrum in six circles - UP East, UP West, Bihar, Gujarat, MP and Haryana in
the 2012 auctions for `2,221.44 crore.
"The amount of outstanding on the Deferred Payment Liability after repayment of
first installment on December 1, 2015 by Seller (Videocon) will be `482.26 crore
and this amount plus interest accrued thereon till the date of closing of transaction
will be reduced from the payment of the aggregate consideration of `3,310
crores," Idea said.
Market Outlook
November 26, 2015
"With this spectrum trading arrangement, Idea's 4G (LTE) spectrum footprint will
expand to 12 service areas covering over 75% of Idea's current revenue and over
72% of existing 170 million quality subscribers," the statement said.
Idea plans to launch 4G services in 750 towns across existing 10 circles by the first
half of calendar year 2016. UP East, UP West and Bihar are Idea’s low operation
circles, and the company is looking at exercising Spectrum Trading options. We
currently have Neutral view on Idea Cellular.
Economic and Political News
MERC issues regulations to cover the revived Dabhol project
Subramanian panel to submit GST report by December 5
Home prices to remain resilient in 2016: Fitch
Corporate News
Nestle India aims to restore fast growth
Will have full control over Gujarat plant: Maruti
Pfizer-Allergan deal could open up opportunities for Indian drugmakers
Market Outlook
November 26, 2015
Top Picks ★★★★★
Large Cap
Market Cap
CMP
Target
Upside
Company
Rationale
(` Cr)
(`)
(`)
(%)
To outpace battery industry growth due to better technological
Amara Raja Batteries
15,089
883
1,040
17.7
products leading to market share gains in both the automotive
OEM and replacement segments.
Earnings to grow strongly given the MHCV cyclical upturn.
Ashok Leyland
26,965
95
111
17.2
Focus on exports and LCV's provides additional growth
avenue.
Healthy pace of branch expansion, backed by distribution
Axis Bank
110,297
464
630
35.7
network, will be the driving force for the bank’s retail business
and overall earnings.
The stock is trading at attractive valuations and is factoring all
HCL Tech
121,778
866
1,132
30.7
the bad news.
Strong visibility for a robust 20% earnings trajectory, coupled
HDFC Bank
267,911
1,064
1,262
18.6
with high quality of earnings on account of high quality retail
business and strategic focus on highly rated corporates.
Due to its robust franchise and capital adequacy position, the
bank is well positioned to grow by at least a few percentage
ICICI Bank
153,003
263
357
35.4
points higher than the average industry growth rate from a
structural point of view.
Back on the growth trend, expect a long term growth of 14%
Infosys
239,112
1,041
1,306
25.5
to be a US$20bn in FY2020.
Well positioned to benefit from such expected gradual
recovery in the overall domestic capex cycle, given its presence
Larsen & Toubro
124,927
1,342
1,646
22.6
across various infrastructure segments, its execution
capabilities, and its strong balance sheet.
LICHF continues to grow its retail loan book at a healthy pace
with improvement in asset quality. We expect the company to
LIC Housing Finance
23,961
475
571
20.2
post a healthy loan book which is likely to reflect in a strong
earnings growth.
Source: Company, Angel Research
Mid Cap
Market Cap
CMP
Target
Upside
Company
Rationale
(` Cr)
(`)
(`)
(%)
Government thrust on Renewable sector and strong order
Inox Wind
8,076
364
505
38.8
book would drive future growth.
Change in business focus towards high-margin chronic and
Ipca labs
9,682
767
900
17.3
lifestyle segments and increasing penetration in Europe and
US
Economic recovery to have favourable impact on advertising &
circulation revenue growth. Further, the acquisition of a radio
Jagran Prakashan
4,631
142
169
19.3
business (Radio City) would also boost the company's revenue
growth.
Strong brand & quality teaching with innovative technologies
MT Educare
562
141
169
19.8
& higher government educational spending to boost growth
Earnings boost on back of stable material prices and
Radico Khaitan
1,633
123
156
27.1
favourable pricing environment. Valuation discount to peers
provides additional comfort
Strong brands and distribution network would boost growth
Siyaram Silk Mills
888
947
1,145
20.9
going ahead. Stock currently trades at an inexpensive
valuation.
Structural shift in the Lighting industry towards LED lighting will
Surya Roshni
576
131
183
39.3
drive growth.
Source: Company, Angel Research
Market Outlook
November 26, 2015
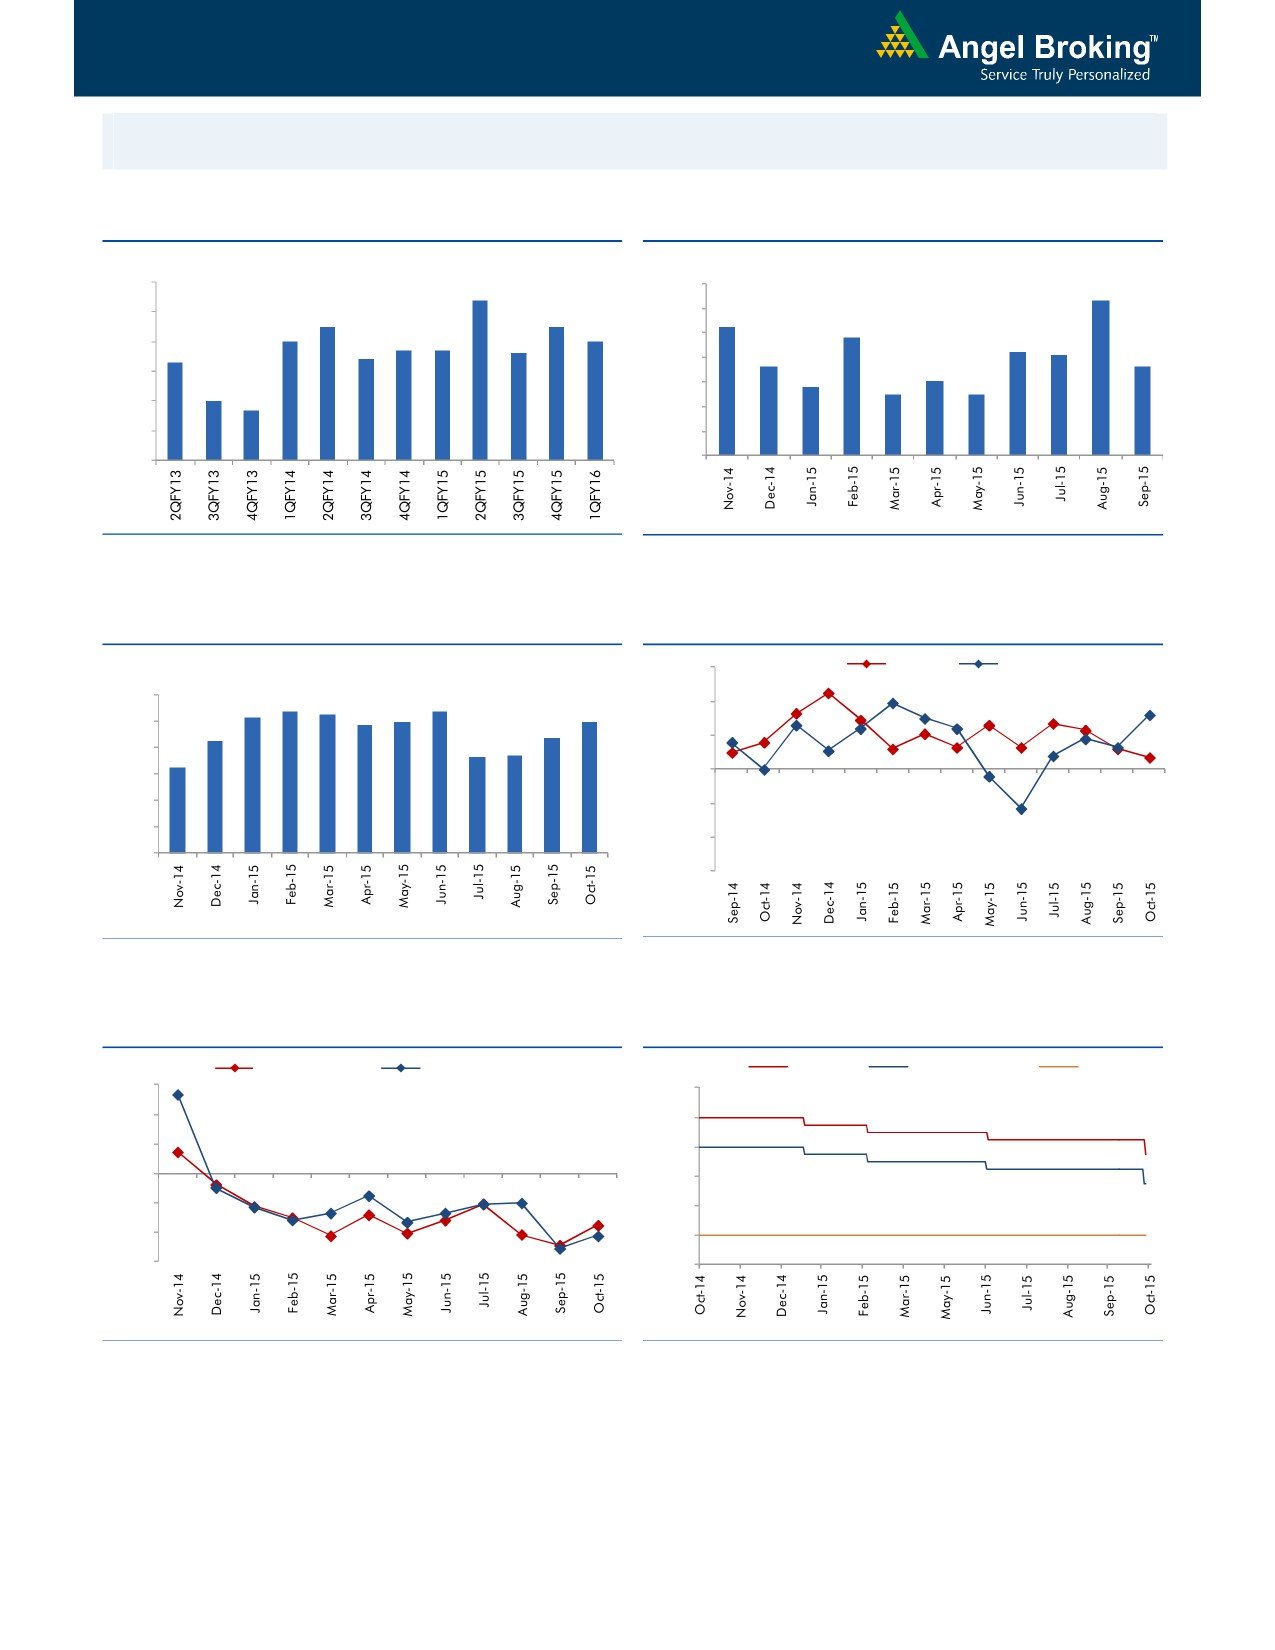
Macro watch
Exhibit 1: Quarterly GDP trends
Exhibit 2: IIP trends
(%)
(%)
9.0
8.4
7.0
6.3
8.0
7.5
7.5
6.0
5.2
7.0
7.0
4.8
6.7
6.7
5.0
4.2
7.0
6.4
6.6
4.1
6.3
3.6
3.6
4.0
6.0
2.8
3.0
2.5
2.5
5.0
3.0
4.7
5.0
2.0
4.0
1.0
3.0
-
Source: CSO, Angel Research
Source: MOSPI, Angel Research
Exhibit 3: Monthly CPI inflation trends
Exhibit 4: Manufacturing and services PMI
(%)
56.0
Mfg. PMI
Services PMI
6.0
5.2
5.4
5.3
5.4
4.9
5.0
5.0
54.0
5.0
4.3
4.4
3.7
3.7
52.0
4.0
3.3
50.0
3.0
2.0
48.0
1.0
46.0
-
44.0
Source: MOSPI, Angel Research
Source: Market, Angel Research; Note: Level above 50 indicates expansion
Exhibit 5: Exports and imports growth trends
Exhibit 6: Key policy rates
(%)
Exports yoy growth
Imports yoy growth
(%)
Repo rate
Reverse Repo rate
CRR
30.0
9.00
20.0
8.00
10.0
7.00
0.0
6.00
(10.0)
5.00
(20.0)
4.00
(30.0)
3.00
Source: Bloomberg, Angel Research
Source: RBI, Angel Research
Market Outlook
November 26, 2015
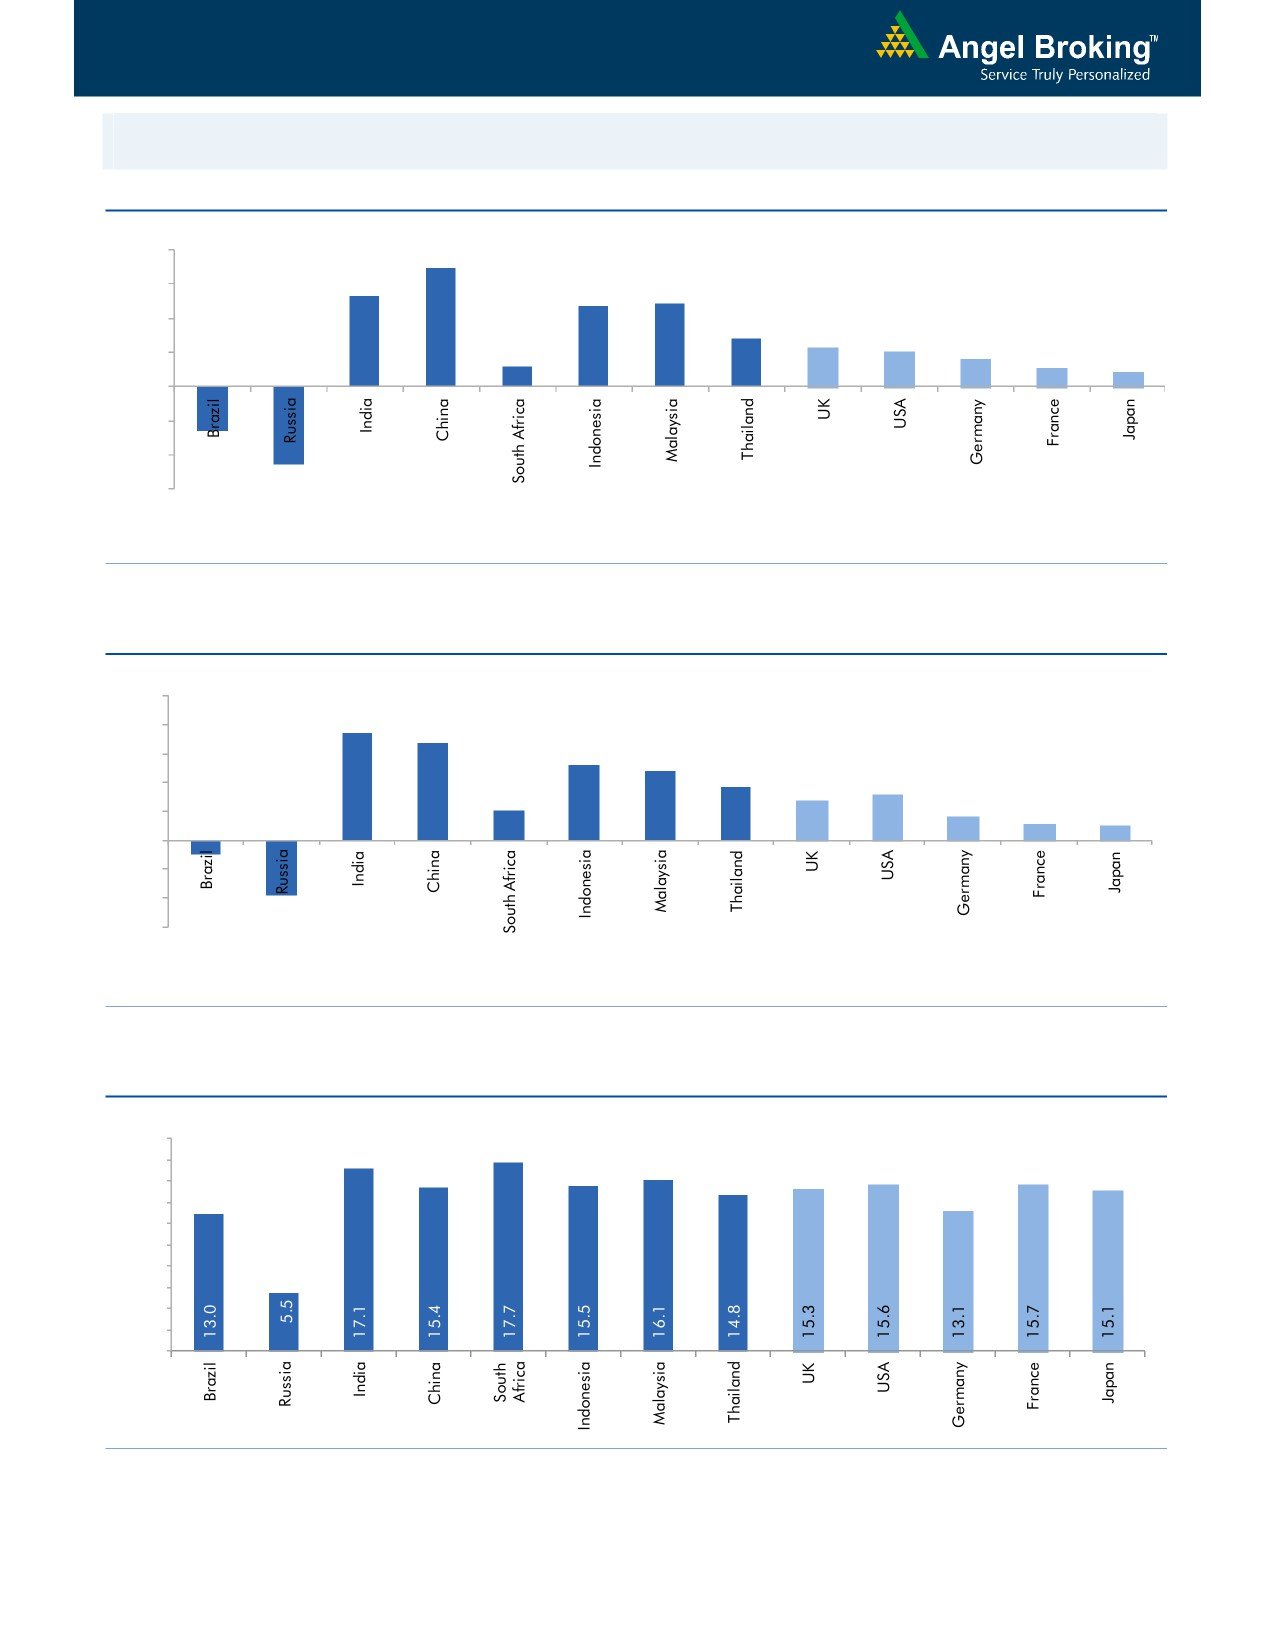
Global watch
Exhibit 1: Latest quarterly GDP Growth (%, yoy) across select developing and developed countries
(%)
8.0
6.9
6.0
5.3
4.9
4.7
4.0
2.8
2.3
2.0
1.6
2.0
1.2
1.1
0.8
(2.6)
-
(2.0)
(4.0)
(4.6)
(6.0)
Source: Bloomberg, Angel Research
Exhibit 2: 2015 GDP Growth projection by IMF (%, yoy) across select developing and developed countries
(%)
10.0
7.5
8.0
6.8
5.2
6.0
4.8
3.7
3.1
4.0
2.7
2.0
1.6
2.0
1.2
1.0
-
(2.0)
(4.0)
(1.0)
(3.8)
(6.0)
Source: IMF, Angel Research
Exhibit 3: One year forward P-E ratio across select developing and developed countries
(x)
20.0
18.0
16.0
14.0
12.0
10.0
8.0
6.0
4.0
2.0
-
Source: IMF, Angel Research
Market Outlook
November 26, 2015
Exhibit 4: Relative performance of indices across globe
Country
Name of index
Closing price
1M
1YR
Brazil
Bovespa
46,867
(0.7)
(14.9)
Russia
Micex
1,834
6.3
19.9
India
Nifty
7,832
(5.6)
(7.5)
China
Shanghai Composite
3,654
6.6
40.3
South Africa
Top 40
46,672
(4.4)
3.9
Mexico
Mexbol
44,139
(2.0)
(1.2)
Indonesia
LQ45
794
(2.4)
(10.3)
Malaysia
KLCI
1,687
(1.2)
(8.5)
Thailand
SET 50
886
(3.8)
(17.1)
USA
Dow Jones
17,813
0.9
(0.0)
UK
FTSE
6,338
(1.2)
(5.8)
Japan
Nikkei
19,963
5.4
14.8
Germany
DAX
11,170
3.5
13.3
France
CAC
4,893
(0.1)
11.9
Source: Bloomberg, Angel Research
Stock Watch
November 26, 2015
Company Name
Reco
CMP
Target
Mkt Cap
Sales ( Čcr )
OPM(%)
EPS (Č)
PER(x)
P/BV(x)
RoE(%)
EV/Sales(x)
(Č)
Price ( Č)
( Č cr )
FY16E FY17E
FY16E
FY17E
FY16E
FY17E
FY16E
FY17E
FY16E
FY17E
FY16E
FY17E
FY16E
FY17E
Agri / Agri Chemical
Rallis
Neutral
188
-
3,655
2,075
2,394
14.4
14.4
9.5
11.0
19.8
17.1
3.9
3.4
21.1
21.3
1.8
1.6
United Phosphorus
Buy
438
510
18,779
13,698
15,752
17.6
17.6
32.1
38.5
13.7
11.4
2.7
2.2
21.4
21.3
1.5
1.2
Auto & Auto Ancillary
Ashok Leyland
Buy
95
111
26,965
18,763
22,357
11.1
11.2
3.6
4.8
26.3
19.7
4.9
4.5
18.7
22.6
1.4
1.1
Bajaj Auto
Accumulate
2,479
2,672
71,730
24,115
27,600
21.3
21.0
136.8
157.2
18.1
15.8
5.8
5.0
32.2
31.5
2.5
2.2
Bharat Forge
Buy
877
1,016
20,422
8,013
9,250
20.0
20.3
35.2
43.1
24.9
20.4
4.9
4.0
21.6
21.8
2.7
2.3
Eicher Motors
Accumulate
16,649
19,036
45,190
15,379
16,498
15.6
16.6
473.2
574.8
35.2
29.0
13.0
9.7
36.7
33.2
2.9
2.6
Hero Motocorp
Neutral
2,646
-
52,833
28,561
31,559
14.7
14.7
151.1
163.2
17.5
16.2
6.8
5.8
38.7
35.6
1.7
1.5
Jamna Auto Industries Accumulate
230
258
4,589
1,292
1,486
9.3
9.8
12.0
15.0
19.2
15.3
4.0
3.4
20.7
21.8
3.6
3.2
L G Balakrishnan & Bros Neutral
481
-
755
1,254
1,394
11.6
11.8
35.9
41.7
13.4
11.6
1.8
1.6
13.5
13.8
0.7
0.6
Mahindra and Mahindra Accumulate
1,318
1,410
81,857
38,513
43,579
13.6
13.7
56.1
65.1
23.5
20.3
3.7
3.3
15.7
16.2
1.8
1.5
Maruti
Accumulate
4,640
4,960
140,179
57,865
68,104
16.4
16.7
176.3
225.5
26.3
20.6
5.1
4.4
19.4
21.2
2.2
1.8
Minda Industries
Neutral
845
-
1,340
2,567
2,965
8.0
8.3
46.1
57.8
18.3
14.6
3.1
2.5
16.7
17.3
0.6
0.5
Motherson Sumi
Accumulate
293
313
38,762
39,343
45,100
8.8
9.1
10.1
12.5
29.0
23.4
9.2
7.2
35.3
34.4
1.1
0.9
Rane Brake Lining
Accumulate
340
366
269
454
511
11.1
11.4
23.8
28.1
14.3
12.1
2.0
1.8
14.2
15.3
0.7
0.7
Setco Automotive
Neutral
219
-
584
594
741
12.7
13.7
8.4
15.8
26.0
13.8
2.7
2.3
10.4
16.9
1.4
1.2
Tata Motors
Neutral
401
-
115,791
255,254
301,772
12.9
13.4
23.7
37.3
16.9
10.8
2.1
1.7
7.4
12.1
0.6
0.6
TVS Motor
Accumulate
290
313
13,799
11,845
14,040
7.2
9.0
10.4
17.4
27.9
16.7
7.0
5.3
25.1
32.0
1.1
0.9
Amara Raja Batteries
Buy
883
1,040
15,089
4,892
5,871
17.4
17.6
28.8
37.1
30.7
23.8
7.2
5.7
23.4
24.1
3.0
2.5
Exide Industries
Accumulate
149
162
12,640
6,950
7,784
14.4
14.8
6.6
7.3
22.5
20.4
2.8
2.6
12.6
12.8
1.5
1.4
Apollo Tyres
Accumulate
162
171
8,244
12,146
12,689
16.8
16.0
21.2
19.0
7.6
8.5
1.3
1.1
16.5
13.0
0.8
0.8
Ceat
Accumulate
1,062
1,119
4,297
6,041
6,597
14.1
13.7
99.5
111.9
10.7
9.5
2.1
1.8
19.6
18.5
0.9
0.7
JK Tyres
Neutral
97
-
2,194
7,446
7,669
15.2
14.0
19.6
18.4
4.9
5.3
1.2
1.0
25.2
19.5
0.7
0.6
Swaraj Engines
Neutral
919
-
1,142
552
630
14.2
14.7
44.6
54.1
20.6
17.0
4.8
4.4
23.2
25.6
1.9
1.6
Subros
Neutral
88
-
528
1,268
1,488
11.6
11.9
3.7
6.6
23.8
13.3
1.6
1.5
6.8
11.4
0.7
0.6
Indag Rubber
Neutral
199
-
521
283
329
17.0
17.2
13.0
15.4
15.3
12.9
3.3
2.8
21.8
21.6
1.6
1.3
Capital Goods
ACE
Neutral
43
-
427
660
839
4.7
8.2
1.0
3.9
43.2
11.1
1.4
1.2
3.2
11.3
0.8
0.6
BEML
Neutral
1,055
-
4,395
3,277
4,006
6.0
8.9
29.2
64.3
36.1
16.4
2.0
1.8
5.7
11.7
1.4
1.1
BGR Energy
Neutral
115
-
833
3,615
3,181
9.5
9.4
16.7
12.4
6.9
9.3
0.7
0.6
10.0
7.0
0.6
0.8
BHEL
Neutral
174
-
42,588
33,722
35,272
10.8
11.7
10.5
14.2
16.6
12.3
1.2
1.2
7.0
9.0
1.3
1.3
Stock Watch
November 26, 2015
Company Name
Reco
CMP
Target
Mkt Cap
Sales ( Čcr )
OPM(%)
EPS (Č)
PER(x)
P/BV(x)
RoE(%)
EV/Sales(x)
(Č)
Price ( Č)
( Č cr )
FY16E
FY17E
FY16E
FY17E
FY16E
FY17E
FY16E
FY17E
FY16E
FY17E
FY16E
FY17E
FY16E
FY17E
Capital Goods
Blue Star
Accumulate
357
382
3,211
3,624
4,157
5.3
6.0
9.6
14.5
37.1
24.7
6.8
5.8
18.6
25.4
1.0
0.9
Crompton Greaves
Neutral
195
-
12,190
13,484
14,687
4.9
6.2
4.5
7.1
43.2
27.4
3.1
2.9
7.2
10.8
1.0
0.9
Inox Wind
Buy
364
505
8,076
4,980
5,943
17.0
17.5
26.6
31.6
13.7
11.5
4.1
3.0
35.0
30.0
1.8
1.4
KEC International
Neutral
158
-
4,068
8,791
9,716
6.1
6.8
5.4
8.2
29.3
19.3
2.9
2.7
10.0
14.0
0.7
0.6
Thermax
Neutral
854
-
10,171
6,413
7,525
7.4
8.5
30.5
39.3
28.0
21.7
4.3
3.7
15.0
17.0
1.6
1.3
Cement
ACC
Buy
1,342
1,630
25,194
13,151
14,757
16.4
18.3
63.9
83.4
21.0
16.1
2.7
2.5
13.3
16.1
1.8
1.5
Ambuja Cements
Buy
202
233
31,403
11,564
12,556
19.4
20.7
8.9
10.1
22.7
20.0
2.9
2.7
12.8
13.8
2.4
2.1
India Cements
Buy
84
112
2,588
4,216
4,840
18.0
19.5
4.0
9.9
21.1
8.5
0.8
0.8
4.0
9.5
0.9
0.8
JK Cement
Buy
646
744
4,519
3,661
4,742
10.1
15.8
18.0
61.0
35.9
10.6
2.6
2.3
7.5
22.9
1.7
1.3
J K Lakshmi Cement
Buy
351
430
4,129
2,947
3,616
16.7
19.9
11.5
27.2
30.5
12.9
2.9
2.5
9.8
20.8
1.8
1.4
Mangalam Cements
Neutral
192
-
512
1,053
1,347
10.5
13.3
8.4
26.0
22.8
7.4
1.0
0.9
4.3
12.5
0.9
0.6
Orient Cement
Accumulate
163
183
3,332
1,854
2,524
21.2
22.2
7.7
11.1
21.1
14.7
3.0
2.6
13.3
15.7
2.5
1.8
Ramco Cements
Neutral
375
-
8,923
4,036
4,545
20.8
21.3
15.1
18.8
24.8
19.9
3.0
2.7
12.9
14.3
2.7
2.3
Shree Cement^
Neutral
11,162
-
38,885
7,150
8,742
26.7
28.6
228.0
345.5
49.0
32.3
7.2
6.0
15.7
20.3
5.2
4.2
UltraTech Cement
Buy
2,778
3,282
76,223
25,021
30,023
19.1
21.6
89.0
132.0
31.2
21.0
3.6
3.1
12.2
15.9
3.1
2.6
Construction
ITNL
Neutral
90
-
2,956
7,360
8,825
34.0
35.9
1.0
5.0
89.9
18.0
0.4
0.4
0.3
1.4
3.8
3.7
KNR Constructions
Accumulate
627
673
1,763
937
1,470
14.3
14.0
33.5
38.6
18.7
16.2
2.8
2.5
15.4
15.4
2.0
1.3
Larsen & Toubro
Buy
1,342
1,646
124,927
64,148
73,241
11.5
11.7
62.0
66.0
21.7
20.3
2.2
2.0
13.4
14.0
2.1
1.9
Gujarat Pipavav Port
Neutral
167
-
8,095
629
684
51.0
52.2
6.4
5.9
26.2
28.4
3.5
3.2
15.9
12.7
12.5
11.3
MBL Infrastructures
Buy
218
285
905
2,313
2,797
12.2
14.6
19.0
20.0
11.5
10.9
1.2
1.1
11.3
10.6
1.1
1.0
Nagarjuna Const.
Neutral
78
-
4,328
7,892
8,842
8.3
9.1
2.4
5.3
32.4
14.7
1.3
1.2
4.2
8.6
0.8
0.7
PNC Infratech
Neutral
532
-
2,731
1,798
2,132
13.2
13.5
22.0
30.0
24.2
17.7
2.2
2.0
11.5
11.4
1.6
1.4
Simplex Infra
Neutral
329
-
1,626
6,241
7,008
10.4
10.7
20.0
36.0
16.4
9.1
1.3
1.2
6.8
11.1
0.8
0.7
Power Mech Projects
Neutral
626
-
3,761
1,539
1,801
12.8
12.7
59.0
72.1
10.6
8.7
2.6
2.3
18.6
16.8
2.5
2.1
Sadbhav Engineering
Neutral
320
-
2,243
3,481
4,219
10.7
10.8
8.0
12.0
40.0
26.7
1.3
1.2
10.3
13.5
0.9
0.8
National Buildings
Construction
Accumulate
995
1,089
7,973
7,382
9,506
7.7
8.6
39.8
54.4
25.0
18.3
4.1
3.7
26.7
29.1
0.8
0.6
Corporation
Sadbhav Infrastructure
Neutral
320
-
2,243
3,481
4,219
10.7
10.8
8.0
12.0
40.0
26.7
1.3
1.2
10.3
13.5
0.9
0.8
Project
Financials
Allahabad Bank
Neutral
74
-
4,426
8,332
9,259
2.8
2.8
21.0
25.6
3.5
2.9
0.4
0.3
9.8
10.9
-
-
Axis Bank
Buy
464
630
110,297
26,473
31,527
3.5
3.6
35.7
43.5
13.0
10.7
2.5
2.2
17.9
18.9
-
-
Stock Watch
November 26, 2015
Company Name
Reco
CMP
Target
Mkt Cap
Sales ( Čcr )
OPM(%)
EPS (Č)
PER(x)
P/BV(x)
RoE(%)
EV/Sales(x)
(Č)
Price ( Č)
( Č cr )
FY16E
FY17E
FY16E
FY17E
FY16E
FY17E
FY16E
FY17E
FY16E
FY17E
FY16E
FY17E
FY16E
FY17E
Financials
Bank of Baroda
Neutral
168
-
38,733
19,105
21,474
2.0
2.0
19.1
24.8
8.8
6.8
0.9
0.8
10.2
12.1
-
-
Bank of India
Neutral
125
-
9,859
15,972
17,271
1.9
2.0
15.3
33.4
8.1
3.7
0.4
0.3
3.6
7.6
-
-
Canara Bank
Neutral
264
-
14,327
15,251
16,725
2.0
2.0
59.3
68.6
4.5
3.9
0.5
0.4
10.1
10.7
-
-
Dena Bank
Neutral
42
-
2,343
3,440
3,840
2.1
2.3
7.3
10.0
5.8
4.2
0.4
0.4
6.1
7.9
-
-
Federal Bank
Neutral
57
-
9,775
3,477
3,999
3.0
3.0
5.0
6.2
11.4
9.1
1.1
1.0
10.6
11.9
-
-
HDFC
Neutral
1,219
-
192,272
10,358
11,852
3.3
3.3
41.1
47.0
29.7
25.9
5.7
5.1
24.7
24.9
-
-
HDFC Bank
Buy
1,064
1,262
267,911
38,309
47,302
4.3
4.3
49.3
61.1
21.6
17.4
3.7
3.2
18.5
19.7
-
-
ICICI Bank
Buy
263
357
153,003
35,168
40,517
3.4
3.4
21.4
25.2
12.3
10.5
2.1
1.8
14.7
15.2
-
-
IDBI Bank
Neutral
82
-
13,152
9,625
10,455
1.8
1.8
8.5
14.2
9.6
5.8
0.6
0.5
5.9
9.3
-
-
Indian Bank
Neutral
125
-
6,016
6,160
6,858
2.5
2.5
24.5
29.8
5.1
4.2
0.4
0.4
7.7
8.6
-
-
LIC Housing Finance
Buy
475
571
23,961
3,101
3,745
2.5
2.5
33.0
40.2
14.4
11.8
2.7
2.3
19.7
20.5
-
-
Oriental Bank
Neutral
147
-
4,408
7,643
8,373
2.4
2.4
37.2
45.4
4.0
3.2
0.4
0.3
8.2
9.4
-
-
Punjab Natl.Bank
Neutral
138
-
27,127
23,638
26,557
2.8
2.8
17.9
27.2
7.7
5.1
0.8
0.6
8.5
12.0
-
-
South Ind.Bank
Neutral
20
-
2,707
1,965
2,185
2.5
2.5
2.5
3.3
8.1
6.1
0.8
0.7
9.5
11.7
-
-
St Bk of India
Buy
242
283
187,471
82,520
93,299
2.7
2.8
20.0
24.5
12.1
9.9
1.3
1.2
11.5
12.8
-
-
Union Bank
Neutral
159
-
10,913
12,646
14,129
2.3
2.4
31.0
39.1
5.1
4.1
0.6
0.5
9.8
11.4
-
-
Vijaya Bank
Neutral
34
-
2,934
3,536
3,827
1.9
1.9
5.5
6.7
6.2
5.1
0.5
0.5
7.8
8.8
-
-
Yes Bank
Buy
744
914
31,167
7,228
9,043
3.2
3.3
57.7
69.4
12.9
10.7
2.3
2.0
19.1
19.6
-
-
FMCG
Asian Paints
Neutral
857
-
82,155
16,553
19,160
16.0
16.2
17.7
21.5
48.5
39.8
12.9
11.6
29.4
31.2
4.8
4.1
Britannia
Neutral
2,934
-
35,200
8,065
9,395
9.6
10.2
47.2
65.5
62.1
44.8
20.7
19.5
38.3
41.2
4.2
3.6
Colgate
Neutral
945
-
25,700
4,836
5,490
19.5
19.7
48.5
53.2
19.5
17.8
14.3
12.4
99.8
97.5
5.2
4.6
Dabur India
Neutral
275
-
48,330
9,370
10,265
17.1
17.2
7.3
8.1
37.5
34.0
11.3
9.2
33.7
30.6
5.1
4.6
GlaxoSmith Con*
Neutral
5,877
-
24,718
4,919
5,742
17.2
17.4
168.3
191.2
34.9
30.7
9.9
8.4
28.8
28.9
4.6
3.9
Godrej Consumer
Neutral
1,257
-
42,791
10,168
12,886
16.1
16.1
32.1
38.4
39.2
32.7
8.0
7.4
19.7
21.0
4.3
3.4
HUL
Neutral
811
-
175,576
34,940
38,957
17.5
17.7
20.8
24.7
39.0
32.9
43.4
34.7
110.5
114.2
4.8
4.3
ITC
Buy
336
409
269,690
41,068
45,068
37.8
37.4
13.9
15.9
24.1
21.1
8.1
7.1
34.1
33.8
6.2
5.6
Marico
Neutral
433
-
27,903
6,551
7,766
15.7
16.0
10.4
12.5
41.7
34.6
12.1
10.1
33.2
32.4
4.2
3.5
Nestle*
Accumulate
6,060
6,646
58,431
11,291
12,847
22.2
22.3
158.9
184.6
38.1
32.8
19.9
17.9
55.0
57.3
5.0
4.4
Tata Global
Accumulate
134
144
8,463
8,635
9,072
9.8
9.9
6.5
7.6
20.7
17.7
2.1
2.0
6.8
7.4
0.9
0.9
Stock Watch
November 26, 2015
Company Name
Reco
CMP
Target
Mkt Cap
Sales ( Čcr )
OPM(%)
EPS (Č)
PER(x)
P/BV(x)
RoE(%)
EV/Sales(x)
(Č)
Price ( Č)
( Č cr )
FY16E FY17E
FY16E
FY17E
FY16E
FY17E
FY16E
FY17E
FY16E
FY17E
FY16E
FY17E
FY16E
FY17E
IT
HCL Tech^
Buy
866
1,132
121,778
42,038
47,503
23.2
23.5
55.8
62.9
15.5
13.8
3.6
2.7
23.0
19.8
2.5
2.0
Infosys
Buy
1,041
1,306
239,112
60,250
66,999
28.0
28.0
58.3
63.7
17.9
16.3
3.7
3.2
20.9
19.7
3.3
2.8
TCS
Buy
2,370
3,165
467,011
111,274
126,852
28.4
28.7
125.4
143.9
18.9
16.5
7.5
6.9
39.9
42.2
3.8
3.3
Tech Mahindra
Buy
538
646
51,719
25,566
28,890
16.0
17.0
26.3
31.9
20.4
16.9
3.7
3.1
17.9
18.6
1.8
1.5
Wipro
Buy
564
719
139,277
52,414
58,704
23.7
23.8
38.4
42.3
14.7
13.3
2.9
2.6
19.5
18.0
2.2
1.8
Media
D B Corp
Accumulate
326
356
5,997
2,241
2,495
27.8
27.9
21.8
25.6
15.0
12.8
3.9
3.5
26.7
28.5
2.6
2.3
HT Media
Neutral
80
-
1,868
2,495
2,603
11.2
11.2
7.3
8.6
11.0
9.3
0.9
0.8
7.4
8.1
0.3
0.2
Jagran Prakashan
Buy
142
169
4,631
2,170
2,355
27.0
27.6
12.8
10.3
11.0
13.8
3.1
2.9
21.8
19.4
1.9
1.6
Sun TV Network
Neutral
382
-
15,038
2,779
3,196
70.2
70.5
22.8
27.3
16.7
14.0
4.1
3.7
26.7
28.3
5.2
4.5
Hindustan Media
Neutral
285
-
2,088
920
1,031
20.0
20.0
19.2
20.9
14.8
13.6
2.4
2.1
16.4
15.3
1.8
1.6
Ventures
Metals & Mining
Coal India
Accumulate
332
380
209,924
76,167
84,130
19.9
22.3
22.4
25.8
14.8
12.9
5.3
5.2
35.5
41.0
2.1
1.9
Hind. Zinc
Buy
141
175
59,767
14,641
14,026
50.4
50.4
17.7
16.0
8.0
8.8
1.2
1.1
16.2
13.2
1.7
1.5
Hindalco
Neutral
74
-
15,229
104,356
111,186
8.7
9.5
6.7
11.1
11.0
6.7
0.4
0.4
3.5
5.9
0.7
0.6
JSW Steel
Neutral
888
-
21,463
42,308
45,147
16.4
20.7
(10.3)
49.5
17.9
1.0
1.0
(1.0)
5.6
1.6
1.5
NMDC
Neutral
92
-
36,396
8,237
10,893
46.6
44.5
10.0
11.7
9.2
7.9
1.0
0.9
12.5
13.0
4.2
3.2
SAIL
Neutral
44
-
18,131
45,915
53,954
7.2
10.5
1.5
4.4
29.2
10.0
0.4
0.4
2.3
4.1
1.0
0.9
Vedanta
Neutral
90
-
26,771
71,445
81,910
26.2
26.3
12.9
19.2
7.0
4.7
0.5
0.4
7.2
8.9
0.8
0.6
Tata Steel
Neutral
224
-
21,789
126,760
137,307
8.9
11.3
6.4
23.1
35.3
9.7
0.7
0.7
2.0
7.1
0.8
0.7
Oil & Gas
Cairn India
Neutral
139
-
25,967
11,323
12,490
49.4
51.0
20.7
20.7
6.7
6.7
0.4
0.4
6.4
6.1
1.4
0.7
GAIL
Neutral
356
-
45,139
64,856
70,933
9.1
9.6
24.0
28.9
14.9
12.3
1.3
1.2
8.8
9.6
0.9
0.8
ONGC
Neutral
233
-
199,215
154,564
167,321
36.8
37.4
28.6
32.5
8.1
7.2
1.0
1.0
12.7
13.5
1.5
1.4
Petronet LNG
Neutral
233
-
17,486
29,691
31,188
5.8
6.2
12.8
13.4
18.2
17.4
2.7
2.4
15.8
14.8
0.7
0.6
Indian Oil Corp
Accumulate
418
455
101,549
359,607
402,760
5.9
6.1
42.5
48.7
9.9
8.6
1.3
1.2
14.1
14.4
0.4
0.3
Reliance Industries
Accumulate
968
1,050
313,480
304,775
344,392
12.6
13.4
91.3
102.6
10.6
9.4
1.2
1.1
11.8
12.0
1.0
0.8
Pharmaceuticals
Alembic Pharma
Neutral
677
-
12,767
2,658
3,112
24.1
20.2
24.6
23.9
27.5
28.3
9.9
7.6
42.5
30.2
4.8
4.0
Aurobindo Pharma
Neutral
836
-
48,831
14,923
17,162
23.0
23.0
38.2
43.6
21.9
19.2
6.7
5.1
36.0
30.2
3.6
3.1
Aventis*
Neutral
4,498
-
10,359
2,082
2,371
17.4
20.8
118.2
151.5
38.1
29.7
5.6
4.5
19.9
25.5
4.7
3.9
Cadila Healthcare
Neutral
413
-
42,265
10,224
11,840
21.0
22.0
14.6
17.6
28.3
23.5
7.8
6.1
30.8
29.0
4.2
3.5
Cipla
Neutral
637
-
51,158
14,211
16,611
20.6
19.0
27.0
28.9
23.6
22.0
4.0
3.4
18.4
16.8
3.6
3.0
Stock Watch
November 26, 2015
Company Name
Reco
CMP
Target
Mkt Cap
Sales ( Čcr )
OPM(%)
EPS (Č)
PER(x)
P/BV(x)
RoE(%)
EV/Sales(x)
(Č)
Price ( Č)
( Č cr )
FY16E FY17E
FY16E
FY17E
FY16E
FY17E
FY16E
FY17E
FY16E
FY17E
FY16E
FY17E
FY16E
FY17E
Pharmaceuticals
Dr Reddy's
Buy
3,389
3,933
57,781
16,838
19,575
25.0
23.1
167.5
178.8
20.2
19.0
4.3
3.6
23.1
20.4
3.4
2.8
Dishman Pharma
Neutral
316
-
2,548
1,733
1,906
21.5
21.5
17.0
19.9
18.6
15.9
1.9
1.7
10.5
11.2
2.0
1.7
GSK Pharma*
Neutral
3,244
-
27,475
2,870
3,158
20.0
22.1
59.5
68.3
54.5
47.5
16.1
16.5
28.5
34.3
9.1
8.3
Indoco Remedies
Neutral
300
-
2,768
1,033
1,199
15.9
18.2
9.4
13.6
32.0
22.1
4.7
4.0
15.7
19.7
2.8
2.4
Ipca labs
Buy
767
900
9,682
3,363
3,909
12.9
18.6
13.4
28.0
57.3
27.4
7.5
6.0
7.4
14.0
3.2
2.7
Lupin
Neutral
1,860
-
83,754
13,092
16,561
25.0
27.0
50.4
68.3
36.9
27.2
7.6
6.0
22.8
24.7
6.1
4.7
Sun Pharma
Buy
708
950
170,352
28,163
32,610
25.8
30.7
17.4
26.9
40.7
26.3
3.9
3.3
13.0
16.6
5.5
4.6
Power
Tata Power
Neutral
67
-
18,013
35,923
37,402
22.6
22.8
4.1
5.2
16.4
12.9
1.3
1.2
7.5
9.3
1.5
1.3
NTPC
Buy
131
157
108,139
87,064
98,846
23.5
23.5
11.7
13.2
11.2
9.9
1.3
1.2
11.4
12.1
2.3
2.0
Power Grid
Buy
131
170
68,743
20,702
23,361
86.7
86.4
12.1
13.2
10.9
10.0
1.6
1.4
15.6
15.1
8.2
7.7
Telecom
Bharti Airtel
Neutral
341
-
136,411
101,748
109,191
32.1
31.7
12.0
12.5
28.4
27.3
2.0
1.8
6.9
6.7
2.0
1.8
Idea Cellular
Neutral
140
-
50,341
34,282
36,941
32.0
31.5
5.9
6.2
23.7
22.6
2.2
2.0
9.9
9.3
2.0
1.9
zOthers
Abbott India
Neutral
5,299
-
11,260
2,715
3,153
14.5
14.1
134.3
152.2
39.5
34.8
9.9
8.1
27.4
25.6
3.9
3.3
Bajaj Electricals
Buy
225
341
2,272
4,719
5,287
5.2
5.8
8.6
12.7
26.3
17.8
3.0
2.6
11.4
14.8
0.5
0.4
Finolex Cables
Neutral
262
-
4,012
2,520
2,883
12.2
12.0
12.7
14.2
20.7
18.5
2.8
2.5
13.6
13.5
1.3
1.1
Goodyear India*
Accumulate
558
622
1,286
1,888
1,680
12.1
11.9
62.2
56.6
9.0
9.9
2.1
1.8
25.9
19.7
0.5
0.5
Hitachi
Neutral
1,354
-
3,682
1,779
2,081
7.8
8.8
21.8
33.4
62.1
40.5
10.0
8.1
17.4
22.1
2.1
1.8
Jyothy Laboratories
Neutral
301
-
5,450
1,620
1,847
11.5
11.5
7.3
8.5
41.3
35.5
5.3
4.9
13.3
14.4
3.2
2.8
MRF
Buy
38,949
45,575
16,519
20,316
14,488
21.4
21.1
5,488.0
3,798.0
7.1
10.3
2.4
2.0
41.1
21.2
0.8
1.0
Page Industries
Neutral
12,841
-
14,323
1,929
2,450
19.8
20.1
229.9
299.0
55.9
43.0
24.6
17.1
52.1
47.1
7.5
5.8
Relaxo Footwears
Neutral
499
-
5,990
1,767
2,152
12.3
12.5
19.3
25.1
25.9
19.9
6.4
4.9
27.7
27.8
3.4
2.8
Siyaram Silk Mills
Buy
947
1,145
888
1,636
1,815
11.5
11.5
89.9
104.1
10.5
9.1
1.8
1.5
17.9
17.8
0.7
0.6
Styrolution ABS India*
Neutral
734
-
1,290
1,271
1,440
8.6
9.2
32.0
41.1
22.9
17.9
2.3
2.1
10.7
12.4
1.0
0.9
Tree House
Buy
218
314
921
256
315
57.2
57.5
16.5
21.0
13.2
10.4
1.3
1.1
9.6
10.9
3.7
3.2
TVS Srichakra
Buy
2,805
3,240
2,148
2,101
2,338
15.7
15.0
248.6
270.0
11.3
10.4
4.9
3.5
43.6
34.0
1.1
0.9
HSIL
Neutral
299
-
2,159
2,123
2,384
16.1
16.5
15.0
18.9
19.9
15.8
1.5
1.4
8.0
9.4
1.4
1.2
Kirloskar Engines India
Neutral
273
-
3,954
2,471
2,826
8.8
10.4
9.1
13.3
30.0
20.5
2.9
2.7
9.7
13.4
1.3
1.1
Ltd
M M Forgings
Buy
506
614
611
511
615
21.7
21.6
43.1
55.8
11.7
9.1
2.1
1.8
19.9
21.2
1.4
1.1
Banco Products (India)
Neutral
134
-
957
1,208
1,353
11.0
12.3
10.8
14.5
12.4
9.2
1.4
1.3
11.9
14.5
0.8
0.7
Stock Watch
November 26, 2015
Company Name
Reco
CMP
Target Mkt Cap
Sales ( Čcr )
OPM(%)
EPS (Č)
PER(x)
P/BV(x)
RoE(%)
EV/Sales(x)
(Č)
Price ( Č)
( Č cr )
FY16E FY17E FY16E FY17E FY16E FY17E FY16E FY17E FY16E FY17E FY16E FY17E FY16E FY17E
zOthers
Competent Automobiles Neutral
141
-
86
1,040
1,137
3.2
3.1
25.7
28.0
5.5
5.0
0.8
0.7
15.0
14.3
0.1
0.1
Nilkamal
Accumulate
982
1,038
1,466
1,910
2,083
10.5
10.3
63.3
69.2
15.5
14.2
2.5
2.2
17.6
16.5
0.8
0.7
Visaka Industries
Buy
122
144
194
1,086
1,197
9.9
10.3
21.5
28.8
5.7
4.3
0.5
0.5
9.6
11.6
0.4
0.3
Transport Corporation of
Neutral
303
-
2,305
2,830
3,350
8.8
9.0
14.4
18.3
21.1
16.6
3.3
2.8
15.4
17.1
0.9
0.8
India
Elecon Engineering
Neutral
86
-
931
1,369
1,533
13.7
14.9
3.3
6.1
25.8
14.1
1.7
1.6
6.6
11.4
1.0
0.9
Surya Roshni
Buy
131
183
576
2,992
3,223
8.1
8.4
14.7
18.3
8.9
7.2
0.8
0.8
9.7
11.0
0.5
0.4
MT Educare
Buy
141
169
562
286
366
18.3
17.7
7.7
9.4
18.3
15.1
3.9
3.4
20.2
21.1
1.9
1.4
Radico Khaitan
Buy
123
156
1,633
1,565
1,687
12.2
13.0
5.7
7.1
21.5
17.3
1.8
1.7
8.3
9.6
1.5
1.4
Garware Wall Ropes
Accumulate
370
423
810
861
967
10.9
10.9
24.0
28.2
15.4
13.1
2.3
2.0
14.6
14.9
1.0
0.8
Wonderla Holidays
Neutral
383
-
2,164
206
308
44.0
43.6
9.0
12.9
42.6
29.7
5.8
5.3
13.7
17.8
10.4
6.9
Linc Pen & Plastics
Accumulate
173
185
256
340
371
8.3
8.9
10.8
13.2
16.0
13.1
2.6
2.2
16.0
17.1
0.8
0.7
The Byke Hospitality
Accumulate
165
181
660
222
287
20.5
20.5
5.6
7.6
29.2
21.8
5.5
4.5
18.9
20.8
3.0
2.3
Interglobe Aviation
Neutral
1,088
-
39,189
17,022
21,122
20.7
14.5
63.9
53.7
17.0
20.3
25.5
20.9
149.9
103.2
2.3
1.9
Coffee Day Enterprises
Neutral
266
-
5,470
2,692
2,964
17.0
18.6
-
4.7
-
56.0
3.3
3.1
0.2
5.5
2.4
2.3
Ltd
Navneet Education
Accumulate
85
97
426
998
1,062
24.1
24.0
5.8
6.1
14.8
14.0
3.3
2.9
22.0
20.6
0.5
0.5
Source: Company, Angel Research; Note: *December year end; #September year end; &October year end; Price as on November 25, 2015
Market Outlook
November 26, 2015
Research Team Tel: 022 - 39357800
DISCLAIMER
Angel Broking Private Limited (hereinafter referred to as “Angel”) is a registered Member of National Stock Exchange of India Limited,
Bombay Stock Exchange Limited and Metropolitian Stock Exchange of India Limited. It is also registered as a Depository Participant with
CDSL and Portfolio Manager with SEBI. It also has registration with AMFI as a Mutual Fund Distributor. Angel Broking Private Limited is a
registered entity with SEBI for Research Analyst in terms of SEBI (Research Analyst) Regulations, 2014 vide registration number
INH000000164. Angel or its associates has not been debarred/ suspended by SEBI or any other regulatory authority for accessing
/dealing in securities Market. Angel or its associates including its relatives/analyst do not hold any financial interest/beneficial ownership
of more than 1% in the company covered by Analyst. Angel or its associates/analyst has not received any compensation / managed or co
-managed public offering of securities of the company covered by Analyst during the past twelve months. Angel/analyst has not served as
an officer, director or employee of company covered by Analyst and has not been engaged in market making activity of the company
covered by Analyst.
This document is solely for the personal information of the recipient, and must not be singularly used as the basis of any investment
decision. Nothing in this document should be construed as investment or financial advice. Each recipient of this document should make
such investigations as they deem necessary to arrive at an independent evaluation of an investment in the securities of the companies
referred to in this document (including the merits and risks involved), and should consult their own advisors to determine the merits and
risks of such an investment.
Reports based on technical and derivative analysis center on studying charts of a stock's price movement, outstanding positions and
trading volume, as opposed to focusing on a company's fundamentals and, as such, may not match with a report on a company's
fundamentals.
The information in this document has been printed on the basis of publicly available information, internal data and other reliable sources
believed to be true, but we do not represent that it is accurate or complete and it should not be relied on as such, as this document is for
general guidance only. Angel Broking Pvt. Limited or any of its affiliates/ group companies shall not be in any way responsible for any
loss or damage that may arise to any person from any inadvertent error in the information contained in this report. Angel Broking Pvt.
Limited has not independently verified all the information contained within this document. Accordingly, we cannot testify, nor make any
representation or warranty, express or implied, to the accuracy, contents or data contained within this document. While Angel Broking
Pvt. Limited endeavors to update on a reasonable basis the information discussed in this material, there may be regulatory, compliance,
or other reasons that prevent us from doing so.
This document is being supplied to you solely for your information, and its contents, information or data may not be reproduced,
redistributed or passed on, directly or indirectly.
Neither Angel Broking Pvt. Limited, nor its directors, employees or affiliates shall be liable for any loss or damage that may arise from or
in connection with the use of this information.
Note: Please refer to the important ‘Stock Holding Disclosure' report on the Angel website (Research Section). Also, please refer to the
latest update on respective stocks for the disclosure status in respect of those stocks. Angel Broking Pvt. Limited and its affiliates may have
investment positions in the stocks recommended in this report.