Market Outlook
August 26, 2015
Dealer’s Diary
Domestic Indices
Chg (%)
(Pts)
(Close)
BSE Sensex
1.1
291
26,032
Indian markets are expected to open negative tracking SGX Nifty.
Nifty
0.9
72
7,881
After moving sharply higher at the start of trading on Tuesday, U.S. Market erased
MID CAP
2.0
206
10,560
the early gains over the course of the session before closing notably lower.
SMALL CAP
1.0
107
10,695
European markets closed in positive territory, after the People's Bank of China
BSE HC
1.2
198
17,393
lowered interest rates for the fifth time in nine months.
BSE PSU
2.5
168
6,763
Indian markets reversed intra-day losses to end higher amid a volatile trading
BANKEX
2.5
484
19,726
session on Tuesday, helped by a rebound in global stocks.
AUTO
2.1
359
17,803
METAL
4.0
277
7,146
News & Result Analysis
OIL & GAS
3.7
310
8,617
Aurobindo Pharma appoints former Ranbaxy senior executive Sanjeev Dani as
BSE IT
(0.5)
(53)
10,997
COO
Global Indices
Chg (%)
(Pts)
(Close)
Refer detailed news analysis on the following page
Dow Jones
(1.3)
(205)
15,666
Markets Today
NASDAQ
(0.4)
(20)
4,506
The trend deciding level for the day is 25,819 / 7,824 levels. If NIFTY trades above
FTSE
3.1
182
6,081
this level during the first half-an-hour of trade then we may witness a further rally up
Nikkei
(4.0)
(734)
17,807
to 26,339 - 26,645 / 7,982 - 8,083 levels. However, if NIFTY trades below
Hang Sang
0.7
153
21,405
25,819 / 7,824 levels for the first half-an-hour of trade then it may correct towards
Straits Times
1.5
43
2,886
25,512 - 24,992 / 7,724 - 7,566 levels.
Shanghai Com
(7.6)
(245)
2,965
Indices
S2
S1
PIVOT
R1
R2
SENSEX
24,992
25,512
25,819
26,339
26,645
Indian ADR
Chg (%)
(Pts)
(Close)
NIFTY
7,566
7,724
7,824
7,982
8,083
INFY
(0.2)
(0.0)
$16.5
WIT
0.3
0.0
$11.4
Net Inflows (August 24, 2015)
IBN
2.0
0.2
$8.7
` cr
Purch
Sales
Net
MTD
YTD
HDB
0.7
0.4
$57.2
FII
4,795
9,937
(5,142)
(9,159)
131,810
MFs
3,220
1,222
1,999
4,300
62,248
Advances / Declines
BSE
NSE
Advances
1,174
754
FII Derivatives (August 25, 2015)
Declines
1,570
765
` cr
Purch
Sales
Net
Open Interest
Unchanged
97
56
Index Futures
8,577
7,554
1,024
21,803
Stock Futures
16,141
14,842
1,299
51,818
Volumes (` cr)
BSE
4,805
Gainers / Losers
Gainer
Loser
NSE
27,645
Company
Price (`)
chg (%)
Company
Price (`)
chg (%)
IBREALEST
56
20.2
SUNASIAN
352
(20.0)
TVSMOTOR
113
16.8
VAKRANGEE
90
(10.0)
DELTACORP
79
13.2
CENTRALBK
63
(9.7)
AMARAJABAT
1,078
9.6
GATI
126
(9.5)
PFC
213
9.3
MRPL
51
(6.6)
Market Outlook
August 26, 2015
Aurobindo Pharma appoints former Ranbaxy senior executive
Sanjeev Dani as COO
Aurobindo Pharma has appointed Sanjeev Dani, former senior executive with
Ranbaxy Laboratories, as chief operating officer and head of formulation business.
The company announced the appointment on Tuesday in a call with investors
while declaring its results for the first quarter of the current fiscal.
Dani, who quit Ranbaxy in 2014, will lead the front-end operations of emerging
markets and Europe at Aurobindo Pharma. He has replaced Arvind Vasudeva,
who was in this role since November 2012.
Dani spent over a decade at Ranbaxy, managing various markets including India,
the Middle East, Asia Pacific and Africa.
Dani was one of the key members of Ranbaxy's leadership team that got
disbanded before Sun Pharmaceutical Industries acquired the company last year
for $3.2 billion. Since the merger of Ranbaxy, Sun Pharma has been busy
integrating the mammoth company with 15,000 employees. The integration has
weighed heavily on Sun Pharma's quarterly revenues. As part of the integration,
Sun Pharma in June gave marching orders to 18 senior level executives from
Ranbaxy.
Economic and Political News
Tamil Nadu targets 147 lakh MT food grains production in 2015-16
India in strong position to overtake Chinese quicker: Subramanian Swamy
GST Bill: Govt moves to call for special session, but Congress non-committal
Corporate News
Bosch & Siemens aims to consolidate in India
Aban Offshore to seek shareholders approval to raise funds
Suzlon commissions 6.25 MW-wind power project for National Stock
Exchange
Market Outlook
August 26, 2015
Top Picks
Large Cap
Market
CMP
Target
Upside
Company
Sector
Rating
Cap (` Cr)
(`)
(`)
(%)
Axis Bank
Financials
1,19,397
Buy
502
716
42.5
ICICI Bank
Financials
1,64,582
Buy
284
370
30.5
Infosys
IT
2,49,563
Buy
1,087
1,306
20.2
Inox Wind
Capital Goods
7,695
Buy
347
505
45.6
LIC Housing
Financials
21,996
Buy
436
590
35.4
Finance
Power Grid
Power
67,357
Buy
129
170
32.0
TCS
IT
5,02,874
Buy
2,567
3,168
23.4
Tech Mahindra IT
50,826
Buy
528
646
22.3
Yes Bank
Financials
28,445
Buy
680
989
45.5
Source: Angel Research, Bloomberg
Mid Cap
Market
CMP
Target
Upside
Company
Sector
Rating
Cap (` Cr)
(`)
(`)
(%)
Bajaj Electricals
Others
2,315
Buy
230
341
48.5
Garware Wall Ropes
Others
625
Buy
286
390
36.6
Hindustan Media Ven. Media
1,593
Buy
217
292
34.6
JK Tyre
Auto Ancillary
2,412
Buy
106
129
21.3
MBL Infrastructures
Construction
909
Buy
219
360
64.2
Minda Industries
Auto Ancillary
933
Buy
588
652
10.8
MT Educare
Others
516
Buy
130
169
30.5
Radico Khaitan
Others
1,183
Buy
89
112
25.9
Surya Roshni
Others
507
Buy
116
183
58.2
Source: Angel Research, Bloomberg
Market Outlook
August 26, 2015
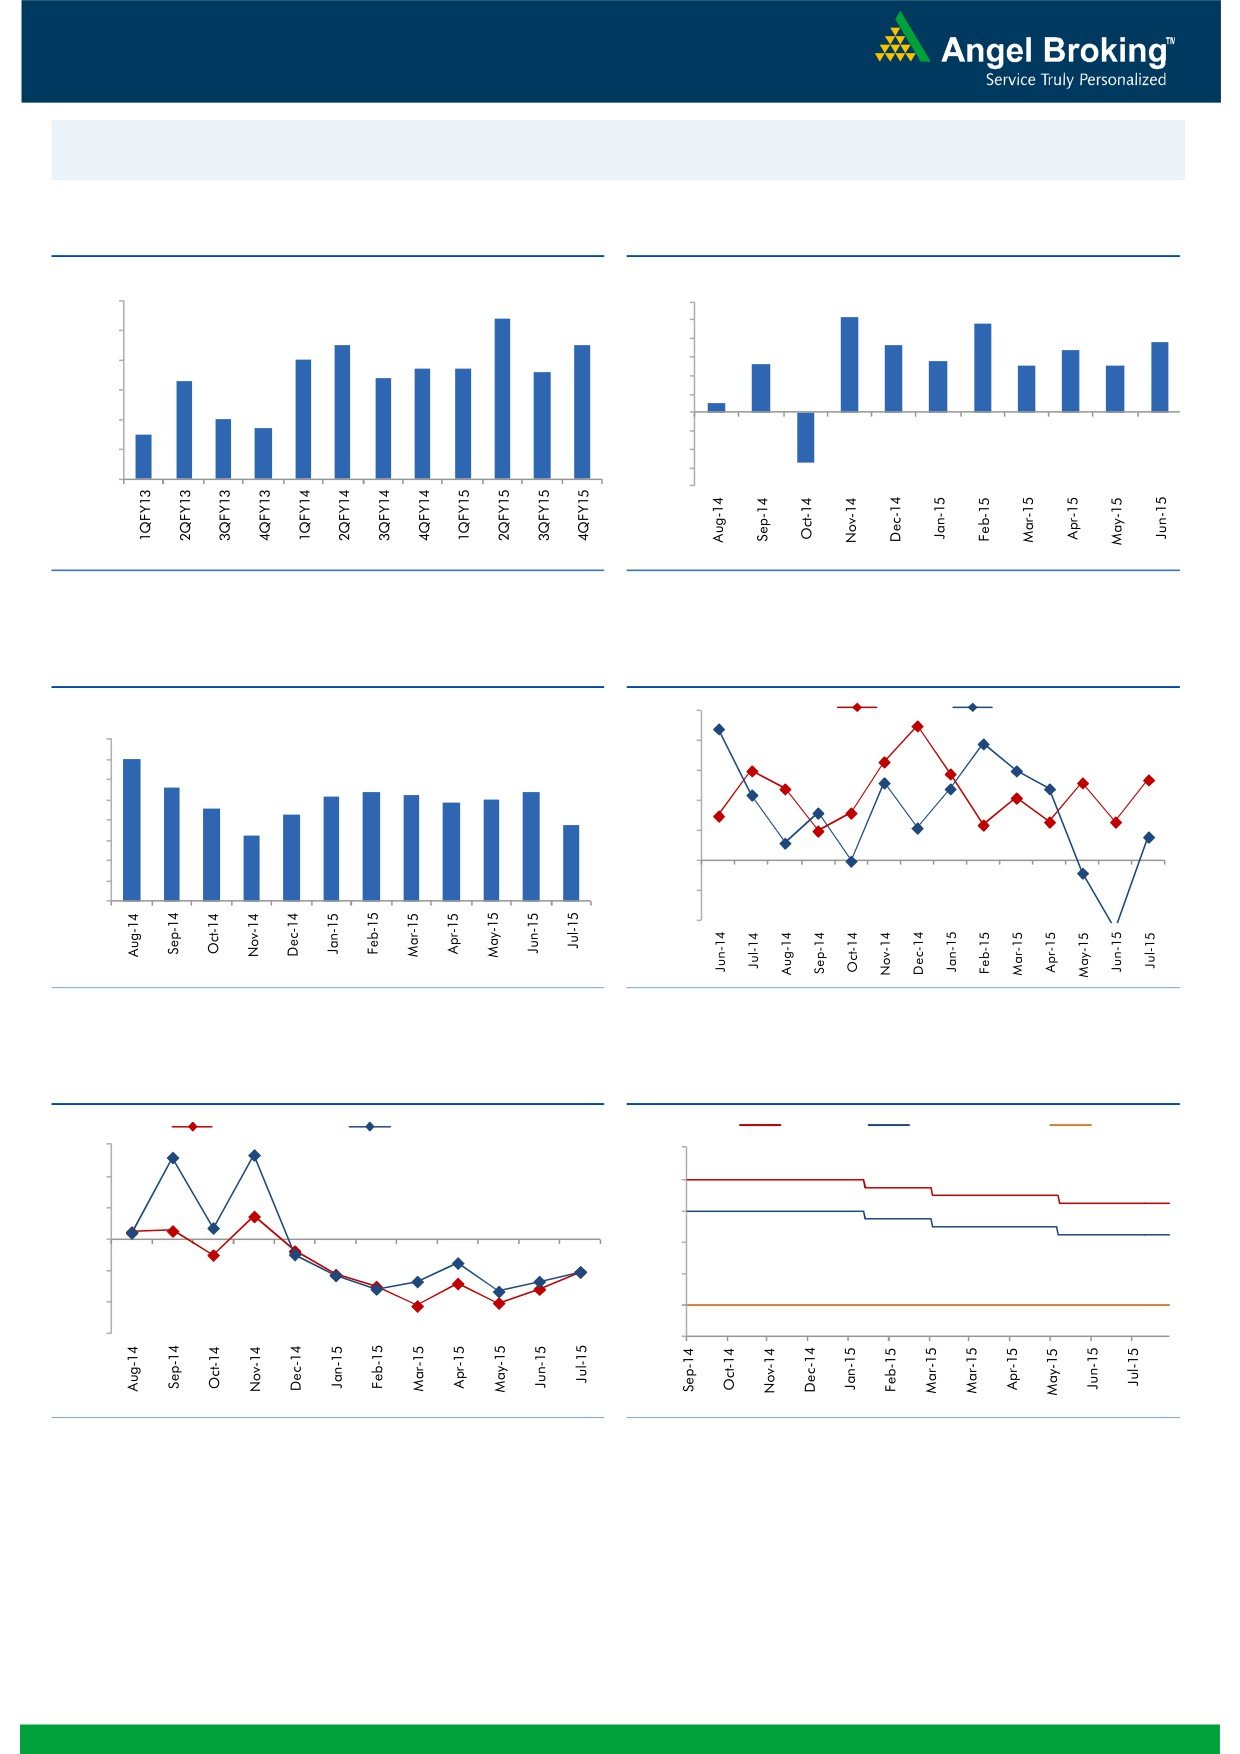
Macro watch
Exhibit 1: Quarterly GDP trends
Exhibit 2: IIP trends
(%)
(%)
9.0
8.4
6.0
5.2
4.8
7.5
7.5
5.0
3.8
8.0
3.6
3.4
7.0
4.0
2.8
6.7
6.7
2.6
2.5
2.5
7.0
6.3
6.4
6.6
3.0
2.0
6.0
0.5
1.0
5.0
4.7
-
5.0
4.5
(1.0)
4.0
(2.0)
(3.0)
3.0
(2.7)
(4.0)
Source: CSO, Angel Research
Source: MOSPI, Angel Research
Exhibit 3: Monthly CPI inflation trends
Exhibit 4: Manufacturing and services PMI
(%)
55.0
Mfg. PMI
Services PMI
8.0
7.0
54.0
7.0
5.6
53.0
6.0
5.2
5.4
5.3
5.4
4.9
5.0
4.6
5.0
4.3
52.0
3.8
4.0
3.3
51.0
3.0
2.0
50.0
1.0
49.0
-
48.0
Source: MOSPI, Angel Research
Source: Market, Angel Research; Note: Level above 50 indicates expansion
Exhibit 5: Exports and imports growth trends
Exhibit 6: Key policy rates
(%)
Exports yoy growth
Imports yoy growth
(%)
Repo rate
Reverse Repo rate
CRR
30.0
9.00
20.0
8.00
10.0
7.00
0.0
6.00
(10.0)
5.00
(20.0)
4.00
(30.0)
3.00
Source: Bloomberg, Angel Research
Source: RBI, Angel Research
Market Outlook
August 26, 2015
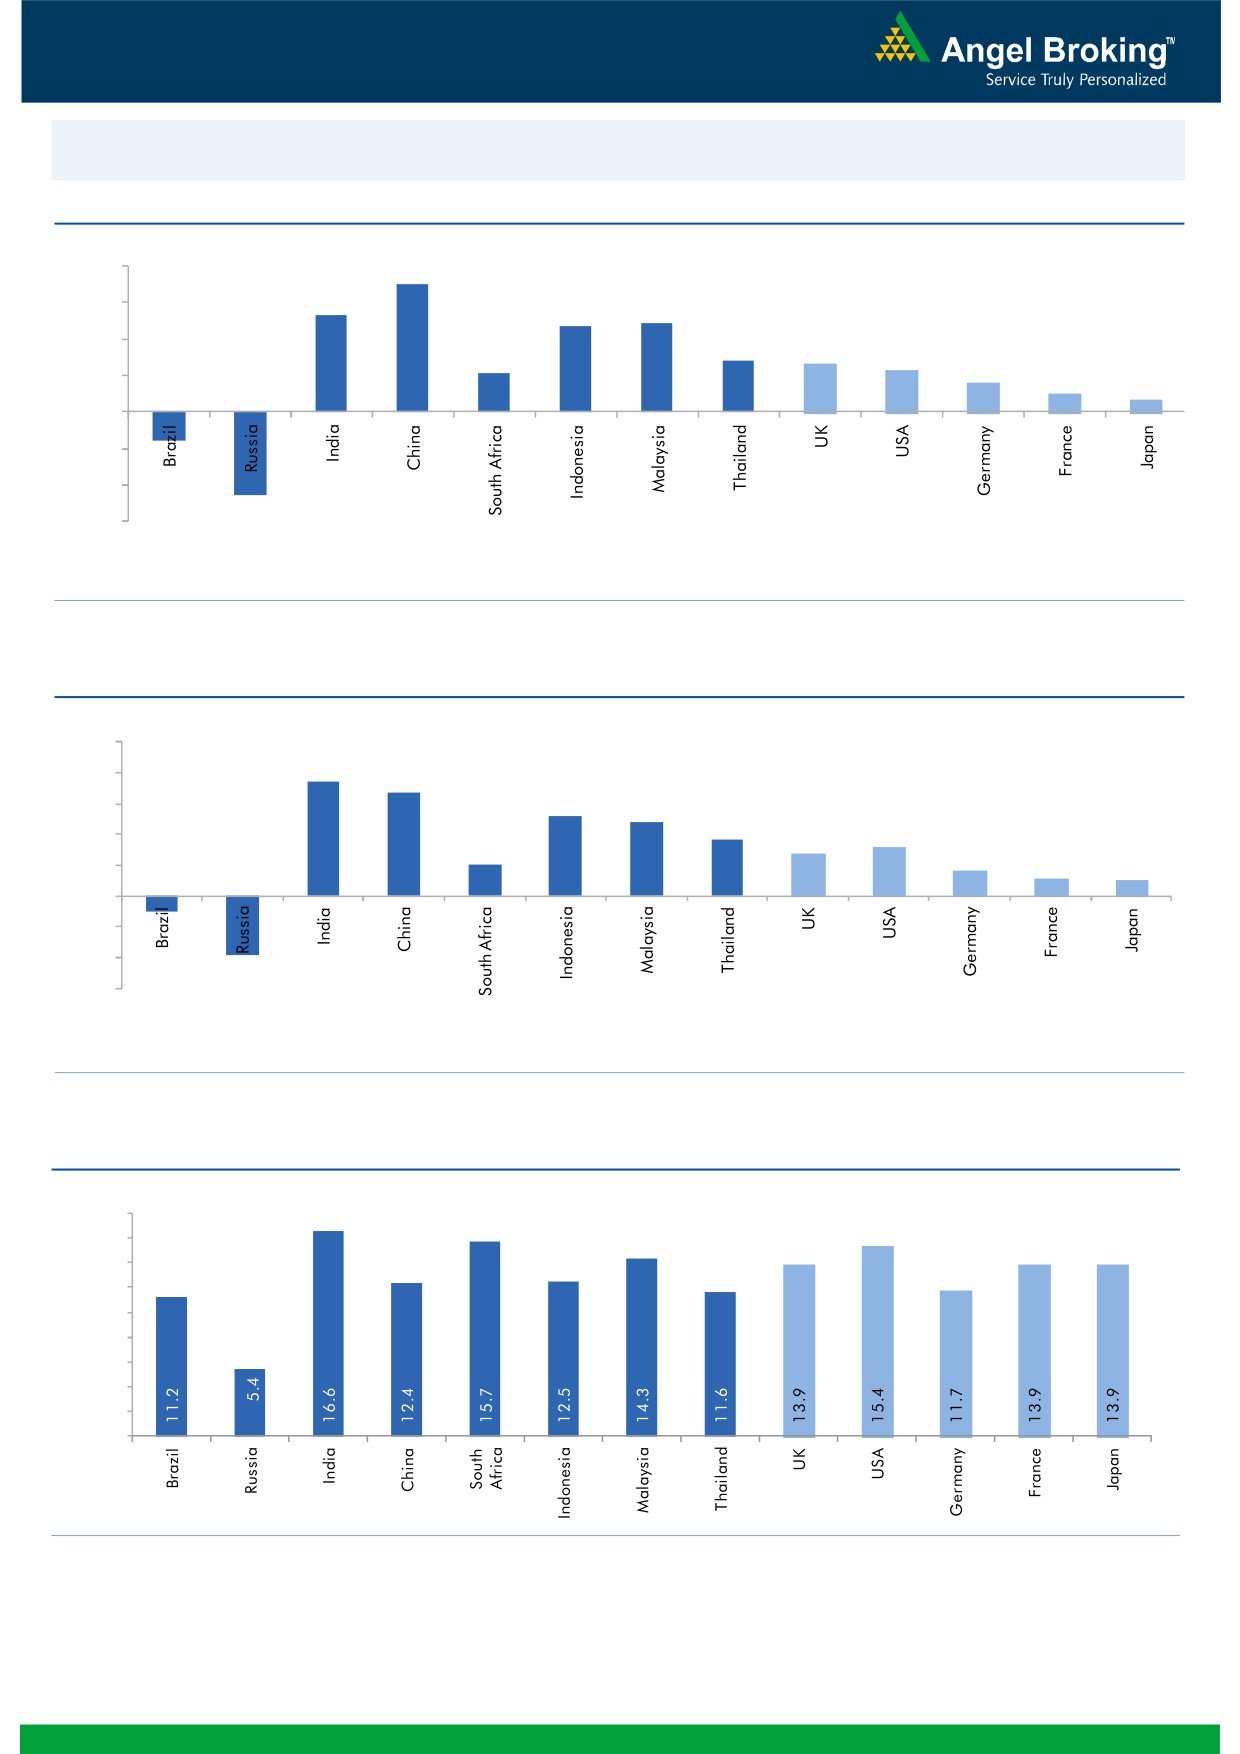
Global watch
Exhibit 1: Latest quarterly GDP Growth (%, yoy) across select developing and developed countries
(%)
8.0
7.0
6.0
5.3
4.9
4.7
4.0
2.8
2.6
2.1
2.3
1.6
2.0
1.0
(1.6)
0.7
(4.6)
-
(2.0)
(4.0)
(6.0)
Source: Bloomberg, Angel Research
Exhibit 2: 2015 GDP Growth projection by IMF (%, yoy) across select developing and developed countries
(%)
10.0
7.5
8.0
6.8
5.2
6.0
4.8
3.7
3.1
4.0
2.7
2.0
1.6
1.2
1.0
2.0
(3.8)
(1.0)
-
(2.0)
(4.0)
(6.0)
Source: IMF, Angel Research
Exhibit 3: One year forward P-E ratio across select developing and developed countries
(x)
18.0
16.0
14.0
12.0
10.0
8.0
6.0
4.0
2.0
-
Source: Bloomberg, Angel Research
Market Outlook
August 26, 2015
Exhibit 4: Relative performance of indices across globe
Returns (%)
Country
Name of index
Closing price
1M
3M
1YR
Brazil
Bovespa
44,545
(9.5)
(18.4)
(24.5)
Russia
Micex
1,658
3.9
0.4
14.6
India
Nifty
7,881
(7.5)
(5.4)
0.1
China
Shanghai Composite
2,965
(20.0)
(39.7)
33.1
South Africa
Top 40
43,439
(6.9)
(9.2)
(5.5)
Mexico
Mexbol
42,011
(5.1)
(6.0)
(7.7)
Indonesia
LQ45
708
(15.7)
(22.7)
(19.6)
Malaysia
KLCI
1,564
(8.7)
(11.1)
(16.8)
Thailand
SET 50
862
(9.6)
(14.8)
(17.1)
USA
Dow Jones
15,666
(10.8)
(13.2)
(8.4)
UK
FTSE
6,081
(7.6)
(13.5)
(10.6)
Japan
Nikkei
17,807
(12.1)
(12.6)
16.8
Germany
DAX
10,128
(10.7)
(14.0)
6.5
France
CAC
4,565
(9.7)
(11.9)
4.2
Source: Bloomberg, Angel Research
Market Outlook
August 26, 2015
Stock Watch
Company Name
Reco
CMP
Target
Mkt Cap
Sales ( Čcr )
OPM(%)
EPS (Č)
PER(x)
P/BV(x)
RoE(%)
EV/Sales(x)
(Č)
Price ( Č)
( Č cr )
FY16E FY17E
FY16E
FY17E
FY16E
FY17E
FY16E
FY17E
FY16E
FY17E
FY16E
FY17E
FY16E
FY17E
Agri / Agri Chemical
Rallis
Neutral
212
-
4,114
2,075
2,394
14.4
14.4
9.5
11.0
22.3
19.2
4.4
3.8
21.1
21.3
2.0
1.7
United Phosphorus
Neutral
500
-
21,413
13,698
15,752
17.6
17.6
32.1
38.5
15.6
13.0
3.1
2.5
21.4
21.3
1.7
1.4
Auto & Auto Ancillary
Ashok Leyland
Accumulate
86
94
24,588
17,850
20,852
10.6
11.1
3.2
4.3
27.0
20.1
4.5
4.1
16.4
20.8
1.3
1.1
Bajaj Auto
Accumulate
2,205
2,454
63,795
23,842
27,264
19.8
19.6
128.4
144.4
17.2
15.3
5.2
4.5
30.5
29.5
2.2
1.9
Eicher Motors
Buy
18,699
22,859
50,753
11,681
15,550
15.3
16.9
358.5
564.3
52.2
33.1
15.7
11.7
29.8
34.9
4.2
3.1
Hero Motocorp
Accumulate
2,478
2,660
49,473
28,500
33,028
13.8
14.1
144.2
166.3
17.2
14.9
6.3
5.4
36.7
36.0
1.6
1.3
L G Balakrishnan & Bros Neutral
435
-
683
1,254
1,394
11.6
11.8
35.9
41.7
12.1
10.5
1.6
1.5
13.5
13.8
0.6
0.6
Mahindra and Mahindra Buy
1,254
1,493
77,876
40,088
45,176
13.8
14.0
59.6
70.4
21.0
17.8
3.5
3.1
16.6
17.2
1.6
1.4
Maruti
Accumulate
4,199
4,735
126,857
58,102
68,587
16.7
16.9
182.0
225.5
23.1
18.6
4.6
3.9
19.9
21.0
2.0
1.6
Minda Industries
Buy
588
652
933
2,567
2,965
7.3
8.0
38.8
54.3
15.2
10.8
2.2
1.8
14.4
16.8
0.4
0.3
Rane Brake Lining
Buy
296
366
234
454
511
11.1
11.4
23.8
28.1
12.4
10.5
1.8
1.6
14.2
15.3
0.6
0.6
Setco Automotive
Neutral
221
-
591
594
741
12.7
13.7
8.4
15.8
26.3
14.0
2.7
2.4
10.4
16.9
1.4
1.2
Tata Motors
Buy
329
432
95,047
267,464
307,211
13.7
13.7
34.6
40.7
9.5
8.1
1.2
1.1
13.2
13.6
0.5
0.5
TVS Motor
Accumulate
224
255
10,632
11,839
13,985
7.0
8.0
10.8
15.9
20.7
14.1
5.3
4.2
25.5
29.7
0.9
0.7
Amara Raja Batteries
Neutral
1,078
-
18,420
5,101
6,224
17.8
17.6
31.1
39.2
34.7
27.5
8.6
6.8
24.8
24.8
3.6
2.9
Exide Industries
Neutral
154
-
13,060
7,363
8,247
13.7
14.5
6.6
7.7
23.3
20.0
2.9
2.7
12.6
13.3
1.5
1.4
Apollo Tyres
Neutral
173
-
8,824
12,576
12,978
16.8
16.1
22.3
19.9
7.8
8.7
1.3
1.2
17.2
13.4
0.8
0.8
Ceat
Accumulate
1,040
1,166
4,206
6,041
6,597
14.3
14.2
101.5
116.6
10.2
8.9
2.0
1.7
20.0
19.1
0.8
0.7
JK Tyres
Buy
106
129
2,412
7,446
7,669
15.2
14.0
19.6
18.4
5.4
5.8
1.4
1.1
25.2
19.5
0.7
0.6
Swaraj Engines
Accumulate
844
912
1,048
593
677
14.5
14.8
51.2
60.8
16.5
13.9
3.8
3.4
23.3
24.8
1.6
1.4
Subros
Neutral
76
-
454
1,268
1,488
11.6
11.9
3.7
6.6
20.5
11.5
1.4
1.3
6.8
11.4
0.7
0.5
Indag Rubber
Neutral
182
-
477
283
329
17.0
17.2
13.0
15.4
14.0
11.8
3.1
2.5
21.8
21.6
1.4
1.2
Capital Goods
ACE
Neutral
38
-
374
660
839
4.7
8.2
1.0
3.9
37.8
9.7
1.2
1.1
3.2
11.3
0.7
0.6
BEML
Neutral
1,254
-
5,223
3,277
4,006
6.0
8.9
29.2
64.3
43.0
19.5
2.4
2.2
5.7
11.7
1.7
1.3
BGR Energy
Neutral
108
-
781
3,615
3,181
9.5
9.4
16.7
12.4
6.5
8.7
0.6
0.6
10.0
7.0
0.6
0.8
BHEL
Neutral
232
-
56,833
33,722
35,272
10.8
11.7
10.5
14.2
22.1
16.4
1.6
1.5
7.0
9.0
1.8
1.7
Blue Star
Accumulate
350
387
3,148
3,649
4,209
5.0
5.9
9.2
14.7
38.3
23.8
6.9
6.5
9.1
17.5
1.0
0.8
Crompton Greaves
Buy
166
204
10,373
13,484
14,687
4.9
6.2
4.5
7.1
36.8
23.3
2.6
2.4
7.2
10.8
0.9
0.8
Inox Wind
Buy
347
505
7,695
4,980
5,943
17.0
17.5
26.6
31.6
13.0
11.0
3.9
2.9
35.0
30.0
1.7
1.4
Market Outlook
August 26, 2015
Stock Watch
Company Name
Reco
CMP
Target
Mkt Cap
Sales ( Čcr )
OPM(%)
EPS (Č)
PER(x)
P/BV(x)
RoE(%)
EV/Sales(x)
(Č)
Price ( Č)
( Č cr )
FY16E
FY17E
FY16E
FY17E
FY16E
FY17E
FY16E
FY17E
FY16E
FY17E
FY16E
FY17E
FY16E
FY17E
Capital Goods
KEC International
Neutral
120
-
3,076
8,791
9,716
6.1
6.8
5.4
8.2
22.2
14.6
2.2
2.0
10.0
14.0
0.6
0.5
Thermax
Neutral
929
-
11,069
6,413
7,525
7.4
8.5
30.5
39.3
30.5
23.6
4.7
4.1
15.0
17.0
1.7
1.4
Cement
ACC
Accumulate
1,364
1,548
25,599
11,856
14,092
14.5
17.8
47.6
76.1
28.6
17.9
2.9
2.7
10.6
15.7
2.0
1.6
Ambuja Cements
Accumulate
208
233
32,342
10,569
12,022
20.7
22.2
8.7
10.7
24.0
19.5
3.0
2.9
13.0
15.2
2.7
2.3
India Cements
Buy
69
112
2,132
4,716
5,133
15.9
16.9
3.7
7.5
18.8
9.3
0.7
0.7
3.8
7.3
0.8
0.6
JK Cement
Buy
602
767
4,211
4,056
4,748
14.5
17.0
22.6
41.1
26.7
14.7
2.4
2.1
9.3
15.3
1.5
1.2
J K Lakshmi Cement
Buy
332
430
3,901
2,947
3,616
16.7
19.9
11.5
27.2
28.8
12.2
2.7
2.4
9.8
20.8
1.7
1.4
Mangalam Cements
Neutral
215
-
574
1,053
1,347
10.5
13.3
8.4
26.0
25.6
8.3
1.1
1.0
4.3
12.5
0.9
0.7
Orient Cement
Accumulate
162
183
3,328
1,854
2,524
21.2
22.2
7.7
11.1
21.1
14.6
3.0
2.6
13.3
15.7
2.5
1.8
Ramco Cements
Neutral
339
-
8,073
4,036
4,545
20.8
21.3
15.1
18.8
22.5
18.0
2.8
2.4
12.9
14.3
2.5
2.2
Shree Cement^
Neutral
10,547
-
36,744
7,150
8,742
26.7
28.6
228.0
345.5
46.3
30.5
6.8
5.7
15.7
20.3
4.9
3.9
UltraTech Cement
Accumulate
2,896
3,282
79,477
27,562
31,548
20.4
22.3
111.9
143.3
25.9
20.2
3.7
3.2
15.2
16.8
3.0
2.5
Construction
ITNL
Neutral
90
-
2,219
7,360
8,825
34.0
35.9
1.0
5.0
90.0
18.0
0.4
0.4
0.3
1.4
3.7
3.6
KNR Constructions
Neutral
562
-
1,467
915
1,479
14.3
13.9
20.3
37.2
27.7
15.1
2.5
2.2
9.6
15.6
1.7
1.1
Larsen & Toubro
Buy
1,626
2,013
151,269
68,920
82,446
10.9
11.5
57.0
73.0
28.5
22.3
2.6
2.4
13.6
15.5
2.4
2.0
Gujarat Pipavav Port
Neutral
194
-
9,393
740
843
53.1
53.6
8.0
10.0
24.3
19.4
3.8
3.0
20.4
19.4
12.2
10.4
MBL Infrastructures
Buy
219
360
909
2,313
2,797
12.2
14.6
19.0
20.0
11.5
11.0
1.2
1.1
11.3
10.6
1.1
1.0
PNC Infratech
Neutral
444
-
2,280
1,798
2,132
13.2
13.5
22.0
30.0
20.2
14.8
1.8
1.6
11.5
11.4
1.4
1.2
Financials
Allahabad Bank
Neutral
83
-
4,740
8,859
9,817
3.0
3.0
23.7
30.1
3.5
2.8
0.4
0.3
10.6
12.3
-
-
Axis Bank
Buy
502
716
119,397
26,522
31,625
3.6
3.6
36.2
45.4
13.9
11.1
2.7
2.4
18.2
19.6
-
-
Bank of Baroda
Neutral
183
-
40,437
18,934
21,374
2.0
2.0
13.2
15.1
13.9
12.1
1.0
0.9
7.1
7.7
-
-
Bank of India
Neutral
141
-
9,362
17,402
20,003
2.0
2.1
40.3
50.7
3.5
2.8
0.4
0.3
9.0
10.4
-
-
Canara Bank
Neutral
288
-
14,827
15,805
17,745
2.0
2.2
64.3
73.5
4.5
3.9
0.5
0.4
10.8
11.3
-
-
Dena Bank
Neutral
42
-
2,340
3,580
4,040
2.1
2.2
8.4
10.9
5.0
3.8
0.4
0.4
6.8
8.4
-
-
Federal Bank
Neutral
63
-
10,726
3,522
4,045
3.2
3.2
12.2
14.1
5.1
4.4
0.6
0.6
12.9
13.4
-
-
HDFC
Neutral
1,146
-
180,590
11,198
13,321
3.5
3.5
45.1
53.7
25.4
21.3
5.2
4.7
27.2
28.2
-
-
HDFC Bank
Buy
1,022
1,255
256,943
38,629
47,500
4.5
4.7
52.6
66.4
19.4
15.4
3.6
3.0
19.6
21.2
-
-
ICICI Bank
Buy
284
370
164,582
36,037
41,647
3.5
3.6
22.9
26.7
12.4
10.6
2.1
1.8
15.7
15.9
-
-
IDBI Bank
Neutral
56
-
9,022
9,806
11,371
1.7
1.9
10.0
16.3
5.7
3.5
0.4
0.4
6.8
10.4
-
-
Market Outlook
August 26, 2015
Stock Watch
Company Name
Reco
CMP
Target
Mkt Cap
Sales ( Čcr )
OPM(%)
EPS (Č)
PER(x)
P/BV(x)
RoE(%)
EV/Sales(x)
(Č)
Price ( Č)
( Č cr )
FY16E FY17E
FY16E
FY17E
FY16E
FY17E
FY16E
FY17E
FY16E
FY17E
FY16E
FY17E
FY16E
FY17E
Financials
Indian Bank
Neutral
130
-
6,261
6,454
7,321
2.5
2.6
26.4
33.3
5.0
3.9
0.4
0.4
8.1
9.6
-
-
LIC Housing Finance
Buy
436
590
21,996
2,934
3,511
2.3
2.3
30.9
36.8
14.1
11.8
2.3
2.0
16.8
17.5
-
-
Oriental Bank
Neutral
134
-
4,015
7,930
8,852
2.5
2.5
51.8
57.1
2.6
2.4
0.3
0.3
9.3
9.5
-
-
Punjab Natl.Bank
Neutral
145
-
26,808
24,160
27,777
2.9
3.0
18.5
24.6
7.8
5.9
0.8
0.6
8.8
10.8
-
-
South Ind.Bank
Neutral
20
-
2,721
1,999
2,249
2.4
2.4
3.5
4.0
5.8
5.0
0.7
0.7
12.6
13.1
-
-
St Bk of India
Buy
253
309
191,728
86,900
100,550
3.1
3.1
22.1
27.7
11.5
9.2
1.4
1.2
12.7
14.3
-
-
Union Bank
Neutral
176
-
11,187
12,995
14,782
2.4
2.4
32.3
40.9
5.4
4.3
0.7
0.5
10.7
12.3
-
-
Vijaya Bank
Neutral
36
-
3,063
3,474
3,932
1.8
1.9
5.9
7.2
6.1
5.0
0.5
0.5
8.1
9.3
-
-
Yes Bank
Buy
680
989
28,445
7,006
8,825
3.1
3.3
61.4
77.1
11.1
8.8
2.1
1.7
20.1
21.3
-
-
FMCG
Asian Paints
Neutral
852
-
81,709
16,553
19,160
16.0
16.2
17.7
21.5
48.2
39.6
12.8
11.5
29.4
31.2
4.8
4.1
Britannia
Neutral
2,986
-
35,825
8,065
9,395
9.6
10.2
47.2
65.5
63.3
45.6
21.0
19.9
38.3
41.2
4.3
3.7
Colgate
Accumulate
1,908
2,022
25,941
4,836
5,490
19.5
19.7
48.5
53.2
39.3
35.9
28.8
25.1
99.8
97.5
5.3
4.6
Dabur India
Neutral
274
-
48,075
9,370
10,265
17.1
17.2
7.3
8.1
37.3
33.8
11.3
9.2
33.7
30.6
5.0
4.6
GlaxoSmith Con*
Neutral
6,151
-
25,870
4,919
5,742
17.2
17.4
168.3
191.2
36.6
32.2
10.4
8.8
28.8
28.9
4.8
4.1
Godrej Consumer
Neutral
1,254
-
42,701
10,168
12,886
16.1
16.1
32.1
38.4
39.1
32.7
7.9
7.3
19.7
21.0
4.3
3.4
HUL
Neutral
867
-
187,603
34,940
38,957
17.5
17.7
20.8
24.7
41.7
35.1
46.4
37.1
110.5
114.2
5.2
4.6
ITC
Buy
321
409
257,431
41,068
45,068
37.8
37.4
13.9
15.9
23.1
20.2
7.7
6.8
34.1
33.8
5.9
5.3
Marico
Neutral
400
-
25,771
6,551
7,766
15.7
16.0
10.4
12.5
38.5
32.0
11.2
9.3
33.2
32.4
3.9
3.3
Nestle*
Accumulate
6,163
6,646
59,421
11,291
12,847
22.2
22.3
158.9
184.6
38.8
33.4
20.3
18.2
55.0
57.3
5.1
4.5
Tata Global
Buy
118
152
7,413
8,635
9,072
9.8
9.9
6.5
7.6
18.1
15.5
1.8
1.7
6.8
7.4
0.8
0.8
IT
HCL Tech^
Buy
915
1,132
128,603
42,038
47,503
23.5
23.5
56.4
62.9
16.2
14.5
3.8
2.9
23.2
19.8
2.7
2.1
Infosys
Buy
1,087
1,306
249,563
60,250
66,999
28.0
28.0
58.3
63.7
18.6
17.1
3.9
3.4
20.9
19.7
3.5
3.0
TCS
Buy
2,567
3,168
502,874
108,420
123,559
28.8
28.7
127.2
143.9
20.2
17.8
8.1
7.5
39.9
41.8
4.2
3.7
Tech Mahindra
Buy
528
646
50,826
25,566
28,890
16.0
17.0
26.3
31.9
20.1
16.6
3.6
3.1
17.9
18.6
1.8
1.5
Wipro
Buy
542
719
133,815
52,414
58,704
23.7
23.8
38.4
42.3
14.1
12.8
2.8
2.5
19.5
18.0
2.1
1.7
Media
D B Corp
Buy
305
356
5,603
2,241
2,495
27.8
27.9
21.8
25.6
14.0
11.9
3.7
3.2
26.7
28.5
2.4
2.2
HT Media
Neutral
84
-
1,949
2,495
2,603
11.2
11.2
7.3
8.6
11.5
9.7
0.9
0.8
7.4
8.1
0.3
0.3
Jagran Prakashan
Buy
133
156
4,341
1,939
2,122
26.0
26.0
8.3
9.2
16.0
14.4
2.7
2.5
17.5
17.1
2.2
2.0
Sun TV Network
Neutral
324
-
12,762
2,779
3,196
70.2
70.5
22.8
27.3
14.2
11.9
3.5
3.2
26.7
28.3
4.3
3.8
Market Outlook
August 26, 2015
Stock Watch
Company Name
Reco
CMP
Target
Mkt Cap
Sales ( Čcr )
OPM(%)
EPS (Č)
PER(x)
P/BV(x)
RoE(%)
EV/Sales(x)
(Č)
Price ( Č)
( Č cr )
FY16E FY17E
FY16E
FY17E
FY16E
FY17E
FY16E
FY17E
FY16E
FY17E
FY16E
FY17E
FY16E
FY17E
Media
Hindustan Media
Buy
216
292
1,582
920
1,031
20.0
20.0
19.2
20.9
11.2
10.3
1.8
1.6
16.4
15.3
1.3
1.1
Ventures
Metals & Mining
Coal India
Accumulate
354
400
223,536
72,015
78,415
21.2
21.5
21.7
25.3
16.3
14.0
5.5
5.4
33.1
39.1
2.3
2.2
Hind. Zinc
Neutral
126
-
53,429
15,546
16,821
47.5
49.0
19.7
20.3
6.4
6.2
1.1
1.0
17.2
16.6
1.2
0.8
Hindalco
Neutral
81
-
16,623
112,328
119,817
7.7
7.9
16.3
20.1
5.0
4.0
0.4
0.3
8.0
8.5
0.6
0.5
JSW Steel
Neutral
892
-
21,559
48,125
53,595
18.8
21.0
46.9
97.5
19.0
9.2
0.9
0.9
4.4
9.5
1.3
1.1
NMDC
Neutral
93
-
37,050
12,544
13,330
59.5
59.7
16.3
16.5
5.7
5.7
1.0
1.0
5.1
9.9
1.7
1.7
SAIL
Neutral
51
-
21,125
56,365
63,383
6.9
8.0
7.1
8.2
7.2
6.3
0.4
0.4
7.0
7.1
0.9
0.9
Vedanta
Neutral
86
-
25,615
81,842
88,430
30.6
32.8
20.2
25.7
4.3
3.4
0.3
0.3
7.5
8.5
0.7
0.5
Tata Steel
Neutral
214
-
20,799
136,805
149,228
11.3
11.9
26.4
36.8
8.1
5.8
0.6
0.6
6.0
8.0
0.7
0.6
Oil & Gas
Cairn India
Neutral
126
-
23,670
12,617
14,513
33.7
40.0
25.5
27.7
5.0
4.6
0.4
0.4
7.4
7.7
0.5
0.4
GAIL
Neutral
281
-
35,651
75,595
85,554
8.6
8.0
31.8
36.1
8.8
7.8
1.0
0.9
10.7
11.4
0.6
0.5
ONGC
Neutral
231
-
197,461
174,773
192,517
22.7
24.8
34.6
38.2
6.7
6.0
1.0
0.9
14.2
14.9
1.2
1.1
Petronet LNG
Buy
178
210
13,358
39,007
40,785
3.8
4.2
9.2
11.0
19.5
16.2
2.2
2.0
11.6
12.7
0.4
0.4
Reliance Industries
Buy
853
1,050
276,182
339,083
384,014
7.8
9.5
75.7
94.5
11.3
9.0
1.1
1.1
10.7
12.2
1.1
1.0
Pharmaceuticals
Alembic Pharma
Neutral
710
-
13,383
2,601
3,115
21.2
20.2
20.8
23.9
34.1
29.7
11.0
8.3
37.2
31.8
5.2
4.3
Aurobindo Pharma
Accumulate
739
824
43,149
14,435
16,600
22.6
22.6
36.1
41.2
20.5
17.9
6.1
4.6
34.5
29.3
3.3
2.8
Aventis*
Neutral
3,964
-
9,128
2,156
2,455
15.1
16.8
109.7
133.9
36.1
29.6
5.0
4.1
18.4
22.5
3.9
3.3
Cadila Healthcare
Neutral
1,826
-
37,386
10,224
11,840
20.0
21.0
71.0
85.6
25.7
21.3
6.9
5.4
30.1
28.5
3.7
3.1
Cipla
Neutral
648
-
52,001
14,051
16,515
20.4
18.7
26.6
28.4
24.3
22.8
4.1
3.5
18.2
16.5
3.7
3.1
Dr Reddy's
Neutral
4,111
-
70,094
17,903
20,842
22.7
22.8
160.5
189.5
25.6
21.7
5.2
4.3
22.2
21.7
3.9
3.3
Dishman Pharma
Buy
199
279
1,609
1,716
1,888
20.2
20.2
16.3
21.6
12.2
9.2
1.2
1.0
9.7
11.7
1.1
0.9
GSK Pharma*
Neutral
3,355
-
28,415
2,870
3,158
20.0
22.1
59.5
68.3
56.4
49.1
16.6
17.1
28.5
34.3
9.4
8.6
Indoco Remedies
Neutral
320
-
2,953
1,088
1,262
18.2
18.2
13.1
15.5
24.5
20.7
4.8
4.0
21.2
21.1
2.8
2.4
Ipca labs
Neutral
790
-
9,973
3,507
4,078
17.6
18.6
25.8
32.0
30.6
24.7
4.0
3.4
13.8
14.9
3.1
2.7
Lupin
Neutral
1,829
-
82,312
14,864
17,244
26.9
26.9
62.1
71.1
29.5
25.7
7.2
5.7
27.4
24.6
5.3
4.4
Sun Pharma
Accumulate
892
950
214,654
28,163
32,610
25.8
30.7
17.4
26.9
51.3
33.2
4.9
4.2
13.0
16.6
7.1
5.9
Power
Tata Power
Neutral
59
-
15,822
38,302
38,404
14.1
13.1
5.1
6.0
11.4
9.8
1.1
1.0
9.2
10.3
1.3
1.3
NTPC
Buy
119
157
98,451
87,064
98,846
23.5
23.5
11.7
13.2
10.2
9.1
1.1
1.1
11.4
12.1
2.2
1.9
Power Grid
Buy
129
170
67,357
20,702
23,361
86.7
86.4
12.1
13.2
10.7
9.8
1.6
1.4
15.6
15.1
8.2
7.6
Market Outlook
August 26, 2015
Stock Watch
Company Name
Reco
CMP
Target
Mkt Cap
Sales ( Čcr )
OPM(%)
EPS (Č)
PER(x)
P/BV(x)
RoE(%)
EV/Sales(x)
(Č)
Price ( Č)
( Č cr )
FY16E FY17E
FY16E
FY17E
FY16E
FY17E
FY16E
FY17E
FY16E
FY17E
FY16E
FY17E
FY16E
FY17E
Telecom
Bharti Airtel
Neutral
349
-
139,389
101,748
109,191
32.1
31.7
12.0
12.5
29.1
27.9
2.0
1.9
6.9
6.7
2.0
1.8
Idea Cellular
Neutral
151
-
54,449
34,282
36,941
32.0
31.5
5.9
6.2
25.6
24.4
2.4
2.1
9.9
9.3
2.2
2.0
zOthers
Abbott India
Neutral
4,698
-
9,982
2,715
3,153
14.5
14.1
134.3
152.2
35.0
30.9
8.7
7.2
27.4
25.6
3.4
2.9
Bajaj Electricals
Buy
230
341
2,315
4,719
5,287
5.2
5.8
8.6
12.7
26.8
18.1
3.1
2.7
11.4
14.8
0.5
0.4
Finolex Cables
Neutral
229
-
3,504
2,728
3,036
10.8
11.0
14.4
16.8
15.9
13.7
2.4
2.1
15.2
15.3
1.0
0.9
Goodyear India*
Buy
555
655
1,281
1,953
1,766
12.4
12.0
67.4
59.6
8.2
9.3
2.1
1.7
27.7
20.2
0.4
0.4
Hitachi
Neutral
1,346
-
3,660
1,806
2,112
9.0
9.2
28.6
29.1
47.1
46.3
11.7
9.4
28.1
22.6
2.1
1.8
Jyothy Laboratories
Neutral
299
-
5,419
1,620
1,847
11.5
11.5
7.3
8.5
41.1
35.3
5.3
4.9
13.3
14.4
3.2
2.7
MRF
Accumulate
40,069
43,575
16,994
20,727
14,841
19.3
18.6
4,905.8
3,351.9
8.2
12.0
2.6
2.1
37.6
19.6
0.8
1.0
Page Industries
Neutral
13,805
-
15,398
1,929
2,450
19.8
20.1
229.9
299.0
60.1
46.2
26.5
18.4
52.1
47.1
8.0
6.3
Relaxo Footwears
Neutral
483
-
5,800
1,767
2,152
12.3
12.5
19.3
25.1
25.1
19.3
6.2
4.7
27.7
27.8
3.3
2.7
Siyaram Silk Mills
Buy
1,021
1,221
957
1,653
1,873
11.7
12.2
99.3
122.1
10.3
8.4
1.9
1.6
19.5
20.2
0.7
0.6
Styrolution ABS India*
Neutral
724
-
1,273
1,271
1,440
8.6
9.2
32.0
41.1
22.6
17.6
2.3
2.1
10.7
12.4
1.0
0.8
Tree House
Buy
375
433
1,586
259
324
56.8
56.8
17.0
21.7
22.0
17.3
2.2
2.0
10.1
11.5
6.0
5.0
TVS Srichakra
Buy
2,567
3,210
1,965
2,127
2,388
15.2
14.9
237.7
267.5
10.8
9.6
4.6
3.3
51.7
39.8
1.0
0.8
HSIL
Buy
258
434
1,864
2,085
2,436
18.5
18.6
21.7
28.9
11.9
8.9
1.2
1.1
10.0
12.1
1.0
0.8
Kirloskar Engines India
Accumulate
276
297
3,986
2,634
3,252
10.1
12.0
10.9
17.4
25.3
15.8
2.8
2.5
11.4
16.8
1.2
0.9
Ltd
M M Forgings
Buy
615
797
742
563
671
22.1
22.9
51.0
66.5
12.1
9.3
2.5
2.0
23.1
24.1
1.5
1.2
Banco Products (India)
Neutral
116
-
828
1,208
1,353
11.0
12.3
10.8
14.5
10.7
8.0
1.2
1.1
11.9
14.5
0.7
0.6
Competent Automobiles Neutral
160
-
98
1,007
1,114
3.1
3.1
23.7
28.2
6.8
5.7
0.9
0.8
13.9
14.6
0.1
0.1
Nilkamal
Buy
857
1,005
1,280
1,948
2,147
10.6
10.3
60.0
67.0
14.3
12.8
2.2
1.9
16.8
16.1
0.7
0.6
Visaka Industries
Accumulate
149
166
236
1,158
1,272
8.6
9.5
23.7
32.7
6.3
4.5
0.6
0.6
10.1
12.5
0.4
0.3
Transport Corporation of
Buy
230
293
1,752
2,830
3,350
8.8
9.0
14.4
18.3
16.0
12.6
2.5
2.2
15.4
17.1
0.7
0.6
India
Elecon Engineering
Buy
70
87
757
1,452
1,596
14.0
14.7
4.4
6.2
15.7
11.2
1.3
1.2
8.6
11.2
0.8
0.7
Surya Roshni
Buy
116
183
507
2,992
3,223
8.3
8.5
14.7
18.3
7.9
6.3
0.7
0.7
9.8
11.0
0.5
0.4
MT Educare
Buy
130
169
516
286
366
18.3
17.7
7.7
9.4
16.8
13.8
3.5
3.1
20.2
21.1
1.7
1.3
Radico Khaitan
Buy
89
112
1,183
1,565
1,687
11.9
12.4
5.4
6.6
16.4
13.5
1.3
1.2
8.0
9.0
1.3
1.2
Garware Wall Ropes
Buy
298
390
652
875
983
10.4
10.6
23.1
27.8
12.9
10.7
1.8
1.6
14.1
14.8
0.7
0.6
Source: Company, Angel Research; Note: *December year end; #September year end; &October year end; Price as on August 25, 2015
Market Outlook
August 26, 2015
Research Team Tel: 022 - 39357800
DISCLAIMER
Angel Broking Private Limited (hereinafter referred to as “Angel”) is a registered Member of National Stock Exchange of India Limited,
Bombay Stock Exchange Limited and MCX Stock Exchange Limited. It is also registered as a Depository Participant with CDSL and
Portfolio Manager with SEBI. It also has registration with AMFI as a Mutual Fund Distributor. Angel Broking Private Limited is a registered
entity with SEBI for Research Analyst in terms of SEBI (Research Analyst) Regulations, 2014 vide registration number INH000000164.
Angel or its associates has not been debarred/ suspended by SEBI or any other regulatory authority for accessing /dealing in securities
Market. Angel or its associates including its relatives/analyst do not hold any financial interest/beneficial ownership of more than 1% in
the company covered by Analyst. Angel or its associates/analyst has not received any compensation / managed or co-managed public
offering of securities of the company covered by Analyst during the past twelve months. Angel/analyst has not served as an officer,
director or employee of company covered by Analyst and has not been engaged in market making activity of the company covered by
Analyst.
This document is solely for the personal information of the recipient, and must not be singularly used as the basis of any investment
decision. Nothing in this document should be construed as investment or financial advice. Each recipient of this document should make
such investigations as they deem necessary to arrive at an independent evaluation of an investment in the securities of the companies
referred to in this document (including the merits and risks involved), and should consult their own advisors to determine the merits and
risks of such an investment.
Reports based on technical and derivative analysis center on studying charts of a stock's price movement, outstanding positions and
trading volume, as opposed to focusing on a company's fundamentals and, as such, may not match with a report on a company's
fundamentals.
The information in this document has been printed on the basis of publicly available information, internal data and other reliable sources
believed to be true, but we do not represent that it is accurate or complete and it should not be relied on as such, as this document is for
general guidance only. Angel Broking Pvt. Limited or any of its affiliates/ group companies shall not be in any way responsible for any
loss or damage that may arise to any person from any inadvertent error in the information contained in this report. Angel Broking Pvt.
Limited has not independently verified all the information contained within this document. Accordingly, we cannot testify, nor make any
representation or warranty, express or implied, to the accuracy, contents or data contained within this document. While Angel Broking
Pvt. Limited endeavors to update on a reasonable basis the information discussed in this material, there may be regulatory, compliance,
or other reasons that prevent us from doing so.
This document is being supplied to you solely for your information, and its contents, information or data may not be reproduced,
redistributed or passed on, directly or indirectly.
Neither Angel Broking Pvt. Limited, nor its directors, employees or affiliates shall be liable for any loss or damage that may arise from or
in connection with the use of this information.
Note: Please refer to the important ‘Stock Holding Disclosure' report on the Angel website (Research Section). Also, please refer to the
latest update on respective stocks for the disclosure status in respect of those stocks. Angel Broking Pvt. Limited and its affiliates may have
investment positions in the stocks recommended in this report.