Market Outlook
July 26, 2016
Market Cues
Domestic Indices
Chg (%)
(Pts)
(Close)
Indian markets are expected to open flat tracking SGX Nifty.
BSE Sensex
1.1
292
28,095
Nifty
1.1
94
8,636
U.S. stocks retreated from record levels to close lower on Monday. This was due to
investors turning cautious ahead of upcoming earnings announcements and central
Mid Cap
1.0
123
12,400
bank meetings. The Federal Reserve is scheduled to have a meeting on Wednesday
Small Cap
1.1
127
12,234
but rates are expected to remain unchanged.
Bankex
1.6
352
21,729
U.K. stocks closed lower on Monday as losses from commodity shares pulled the
benchmark index lower. Stocks were under further pressure after industrial trends
Global Indices
Chg (%)
(Pts)
(Close)
from the Confederation of British Industry showed business optimism at its lowest
Dow Jones
(0.4)
(78)
18,493
level since January 2009.
Nasdaq
(0.0)
(3)
5,098
Equity benchmarks rallied on broad based buying by FII’s, as a result of which
FTSE
(0.3)
(20)
6,710
markets closed at a 52 week high. Banking, realty and oil & gas shares were among
Nikkei
(0.0)
(7)
16,620
the star performers of the day, with the respective sectoral indices on the BSE
Hang Seng
0.1
29
21,993
gaining more than 1 percent each.
Shanghai Com
0.1
3
3,016
News Analysis
Results Preview: Dr Reddy’s Labs
Advances / Declines
BSE
NSE
Results Review: Canara Bank
Advances
1,718
1,078
Detailed analysis on Pg2
Declines
1,005
528
Investor’s Ready Reckoner
Unchanged
203
75
Key Domestic & Global Indicators
Volumes (` Cr)
Stock Watch: Latest investment recommendations on 150+ stocks
Refer Pg7 onwards
BSE
3,867
NSE
21,414
Top Picks
CMP
Target
Upside
Company
Sector
Rating
(`)
(`)
(%)
Net Inflows (` Cr)
Net
Mtd
Ytd
Amara Raja
Auto/Auto Ancillary
Buy
907
1,076
18.7
FII
518
7,123
26,666
HCL Tech
IT
Buy
738
1,000
35.5
MFs
(14)
(25)
9,320
LIC Housing
Financials
Accumulate
518
592
14.1
Bharat Electronics
Capital Goods
Accumulate
1,244
1,414
13.7
Top Gainers
Price (`)
Chg (%)
Navkar Corporation Others
Buy
213
265
24.3
Mrpl
89
10.7
More Top Picks on Pg5
Pnb
130
8.2
Key Upcoming Events
Edelweiss
93
7.4
Previous
Consensus
Date
Region
Event Description
Reading
Expectations
Albk
79
6.8
July 26
US
Consumer Confidence
98.00
95.50
Amtekauto
48
5.6
July 26
US
New home sales
551.00
560.00
July 27
US
FOMC rate decision
0.50
0.50
Top Losers
Price (`)
Chg (%)
July 27
UK
GDP (YoY)
2.00
2.10
6.(
Unitech
8
(3.8)
More Events on Pg6
Drreddy
3,475
(3.6)
Jpinfratec
11
(3.2)
Tataelxsi
1,614
(3.0)
Gdl
267
(2.9)
As on July 25, 2016
Market Outlook
July 26, 2016
Result Preview
Dr Reddy’s Lab’s (CMP: `3,475 / TP: /Upside:)
For 1QFY2017, the company is expected to post a sales of `3,900cr V/s `3,758cr
in 1QFY2016, a yoy growth of 3.8%. Sales growth of company will be under
pressure on back of muted growth in US market. On the profitability front, the
company is expected to post an OPM of 21.4% V/s 26.2% in 1QFY2016. The net
profit to come in at `520cr V/s `626cr in 1QFY2016, a yoy de-growth of 16.9%.
We maintain our neutral rating on the stock.
Y/E
Sales OPM
PAT
EPS ROE P/E P/BV EV/EBITDA EV/Sales
Mar
(` cr)
(%)
(` cr)
(`)
(%)
(x)
(x)
(x)
(x)
FY2017E
17,479
24.6
2,600
152.4
18.7
22.8
3.9
13.6
3.3
FY2018E
20,021
24.2
2,965
173.8
18.2
20.0
4.0
11.9
2.9
Canara Bank’s Asset quality stabilizes during the quarter:
Canara Bank’s 1QFY17 results has been mixed bag, while the bank reported
52% YoY decline in PAT, the asset quality remained more or less table with GNPAs
at 9.71% vs 9.40% QoQ and NNPA at 6.69% vs 6.42%. The bank had taken huge
provisions of `6,331cr during Q4FY16, which resulted in a loss of `3,905cr.
During the quarter however provisions remained `1,492cr, this together with high
other income resulted in the PAT.
Though at the bottom-line level it has turned positive, high other income has
supported the PAT. On the operating front the banks performance continues to be
disappointing. NII declined by 8.3% while PPP declined by 9.2%. On balance sheet
front also it remained disappointing with advanced de growth of 1% and deposits
de growth of 1.5% YoY. While the quarter seems to have brought some relief in
the asset quality, the NNPA % of 6.69% indicates more provisions going ahead
which should which could keep the bottom-line under pressure. We maintain our
neutral rating on the stock.
Economic and Political News
75% of country has received excess or normal rainfall: IMD
India's import cover improved to 10.9 months in March
Telecom Commission to set a minimum 3% spectrum usage charges
Corporate News
SUUTI to reduce its stakes in Axis Bank, L&T, and ITC
IL&FS Eng. wins Nagpur metro rail project for `532.67cr
Nasscom ranks TCS top employer in IT industry
Market Outlook
July 26, 2016
Quarterly Bloomberg Brokers Consensus Estimate
ACC Ltd - July 26, 2016
Particulars (` cr)
2QCY16E
2QCY15
y-o-y (%)
1QCY16
q-o-q (%)
Net sales
3,033
2,961
2.4
2,927
3.6
EBITDA
451
334
35.1
433
4.1
EBITDA margin (%)
14.9
11.3
14.8
Net profit
245
131
86.7
232
5.7
Maruti Suzuki India Ltd Ltd - July 26, 2016
Particulars (` cr)
1QFY17E
1QFY16
y-o-y (%)
4QFY16
q-o-q (%)
Net sales
15,211
13,078
16.3
14,930
1.9
EBITDA
2,215
2,189
1.2
2,350
(5.8)
EBITDA margin (%)
14.6
16.7
15.7
Net profit
1,229
1,193
3.0
1,134
8.4
United Spirits Ltd - July 26, 2016
Particulars (` cr)
1QFY17E
1QFY16
y-o-y (%)
4QFY16
q-o-q (%)
Net sales
2,263
1,988
13.8
2,284
(0.9)
EBITDA
211
202
4.7
91
132.1
EBITDA margin (%)
9.3
10.2
4.0
Net profit
74
20
273.2
(9)
0.0
Zee Entertainment Enterprise Ltd - July 26, 2016
Particulars (` cr)
1QFY17E
1QFY16
y-o-y (%)
4QFY16
q-o-q (%)
Net sales
1,535
1,242
23.5
1,532
0.2
EBITDA
394
311
26.7
414
(4.7)
EBITDA margin (%)
25.7
25.0
27.0
Net profit
276
244
13.2
261
5.9
Dr Reddy’s Laboratories Ltd - July 26, 2016
Particulars (` cr)
1QFY17E
1QFY16
y-o-y (%)
4QFY16
q-o-q (%)
Net sales
3,842
3,758
2.2
3,756
2.3
EBITDA
870
926
(6.0)
713
22.0
EBITDA margin (%)
22.7
24.6
19.0
Net profit
481
626
(23.2)
75
544.5
Ambuja Cement Ltd - July 26, 2016
Particulars (` cr)
2QCY16E
2QCY15
y-o-y (%)
1QCY16
q-o-q (%)
Net sales
2,624
2,493
5.3
2,418
8.5
EBITDA
502
384
30.8
450
11.6
EBITDA margin (%)
19.1
15.4
18.6
Net profit
333
226
47.0
304
9.5
Market Outlook
July 26, 2016
Bharti Infratel Ltd - July 26, 2016
Particulars (` cr)
1QFY17E
1QFY16
y-o-y (%)
4QFY16 q-o-q (%)
Net sales
31632
30157
4.89
31619
0.04
EBITDA
14248
15129
16041
11.18
EBITDA margin (%)
45.04
50.17
18.6
Net profit
6403
5757
6617
Bajaj Finance Ltd - July 26, 2016
Particulars (` cr)
1QFY17E
1QFY16
y-o-y (%)
4QFY16 q-o-q (%)
Net profit
373.1
275.6
35.4
315.0
18.4
Market Outlook
July 26, 2016
Top Picks ★★★★★
Large Cap
Market Cap
CMP
Target
Upside
Company
Rationale
(` Cr)
(`)
(`)
(%)
To outpace battery industry growth due to better technological
Amara Raja Batteries
15,489
907
1,076
18.7
products leading to market share gains in both the automotive
OEM and replacement segments.
Uptick in defense capex by government, coupled with BELs
Bharat Electronics
29,850
1,244
1,414
13.7
strong market positioning, indicate good times ahead for BEL.
HCL Tech
1,04,100
738
1,000
35.5
Stock is trading at attractive valuations & factors all bad news.
Back on the growth trend, expect a long term growth of 14% to
Infosys
2,48,185
1,081
1,374
27.2
be a US$20bn in FY2020.
Continues to grow its retail loan book at healthy pace with
LIC Housing Fin.
26,162
518
592
14.1
improvement in asset quality. Expect LICHF to post a healthy
loan book which is likely to reflect in a strong earnings growth.
Strong market positioning within the domestic AC markets to
Voltas
11,128
336
407
21.0
continue, EMP business set to revive
Source: Company, Angel Research
Mid Cap
Market Cap
CMP
Target
Upside
Company
Rationale
(` Cr)
(`)
(`)
(%)
Among the top 4 players in the consumer durables segment.
Bajaj Electricals
2,428
240
268
11.5
Improved profitability backed by turn around in E&P segment.
Strong order book lends earnings visibility.
Favourable outlook for AC industry to augur well for Cooling
Blue Star
4,462
468
495
5.8
products business. EMPPAC division's profitability to improve
once operating environment turns around.
With a focus on the low and medium income (LMI) consumer
Dewan Housing
6,576
225
270
19.8
segment, the company has increased its presence in tier-II & III
cities where the growth opportunity is immense.
Strong loan growth backed by diversified loan portfolio and
Equitas Holdings
6,265
187
235
25.8
adequate CAR. ROE & ROA likely to remain decent as risk of
dilution remains low. Attractive valuations considering growth.
Expectations of above average monsoon augurs well for
Goodyear India
1,219
528
631
19.4
Goodyear India as it derives ~50% of its turnover from farm
tyre segment.
Commencement of new projects, downtrend in the interest rate
IL&FS Transport
2,642
80
93
15.8
cycle, to lead to stock re-rating
Economic recovery to have favourable impact on advertising &
Jagran Prakashan
5,852
179
205
14.5
circulation revenue growth. Further, the acquisition of a radio business
(Radio City) would also boost the company's revenue growth.
Speedier execution and speedier sales, strong revenue visibility
Mahindra Lifespace
1,877
457
554
21.1
in short-to-long run, attractive valuations
Massive capacity expansion along with rail advantage at ICD
Navkar Corporation
3,040
213
265
24.3
as well CFS augurs well for the company
Earnings boost on back of stable material prices and
Radico Khaitan
1,207
91
125
37.8
favourable pricing environment. Valuation discount to peers
provides additional comfort
Strong brands and distribution network would boost growth
Siyaram Silk Mills
986
1,052
1,347
28.1
going ahead. Stock currently trades at an inexpensive
valuation.
Source: Company, Angel Research
Market Outlook
July 26, 2016
Key Upcoming Events
Result Calendar
Date
Company
July 26, 2016
Maruti, TVS Motor, ACC, IDFC, NIIT, L G Balakrishnan & Bros, Visaka Industries
July 27, 2016
Bajaj Auto, Ambuja Cements, Asian Paints, JSW Steel
July 28, 2016
FAG Bearings, Syndicate Bank, Hexaware, Tree House, GSK Pharma
July 29, 2016
United Phosphorus, KEC International, PVR, Sesa Goa, Alembic Pharma, Indoco Remedies, Narayana Hrudaya
July 30, 2016
Relaxo
August 01, 2016
Tech Mahindra, Banco, Interglobe Aviation, VRL Logistics
August 02, 2016
Indian Bank
August 03, 2016
Ramco Cements, Cadila Healthcare
Source: Bloomberg, Angel Research
Global economic events release calendar
Bloomberg Data
Date
Time
Country Event Description
Unit
Period
Last Reported Estimated
Jul 26, 2016
7:30 PM
US
Consumer Confidence S.A./ 1985=100
Jul
98.00
95.50
7:30 PM
US
New home sales
Thousands
Jun
551.00
560.00
Jul 27, 2016
11:30 PM
US
FOMC rate decision
% Jul 27
0.50
0.50
2:00 PM
UK
GDP (YoY)
% Change 2Q A
2.00
2.10
Jul 28, 2016
2:30 PM Euro Zone
Euro-Zone Consumer Confidence
Value
Jul F
(7.90)
(7.90)
6:00 PM
US
GDP Qoq (Annualised)
% Change 2Q A
1.10
2.60
6:00 PM
US
Initial Jobless claims
Thousands Jul 23
253.00
263.00
Jul 26, 2016
7:30 PM
US
Consumer Confidence S.A./ 1985=100
Jul
98.00
95.50
7:30 PM
US
New home sales
Thousands
Jun
551.00
560.00
Jul 27, 2016
11:30 PM
US
FOMC rate decision
% Jul 27
0.50
0.50
Source: Bloomberg, Angel Research
Market Outlook
July 26, 2016
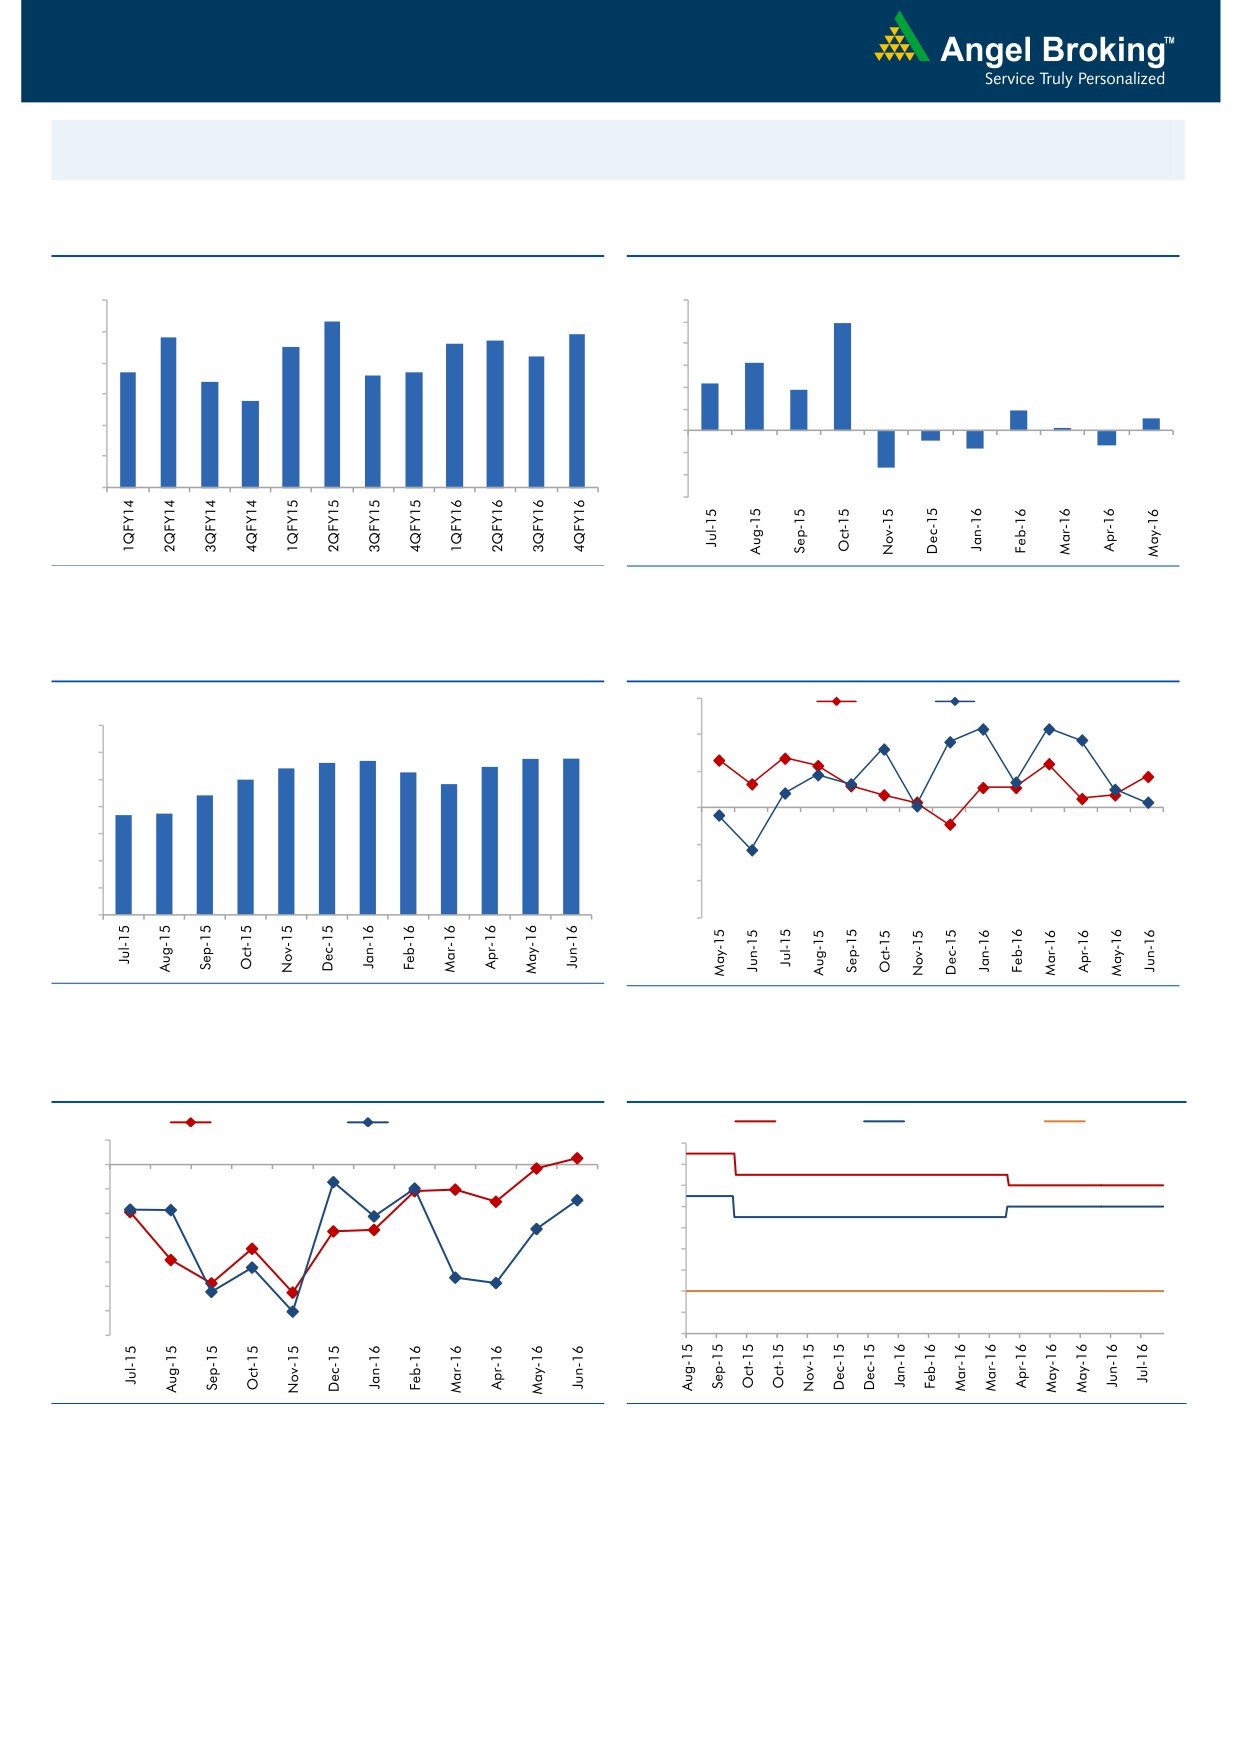
Macro watch
Exhibit 1: Quarterly GDP trends
Exhibit 2: IIP trends
(%)
(%)
9.0
8.3
12.0
9.9
7.8
7.7
7.9
10.0
8.0
7.5
7.6
7.2
8.0
6.3
6.7
6.6
6.7
7.0
6.4
6.0
4.3
3.7
5.8
4.0
6.0
1.9
1.2
2.0
0.3
5.0
-
4.0
(2.0)
(0.9)
(1.3)
(1.6)
(4.0)
3.0
(3.4)
(6.0)
Source: CSO, Angel Research
Source: MOSPI, Angel Research
Exhibit 3: Monthly CPI inflation trends
Exhibit 4: Manufacturing and services PMI
56.0
Mfg. PMI
Services PMI
(%)
7.0
54.0
5.7
5.8
5.8
5.4
5.6
5.5
6.0
5.3
5.0
4.8
52.0
5.0
4.4
3.7
3.7
4.0
50.0
3.0
48.0
2.0
46.0
1.0
-
44.0
Source: MOSPI, Angel Research
Source: Market, Angel Research; Note: Level above 50 indicates expansion
Exhibit 5: Exports and imports growth trends
Exhibit 6: Key policy rates
(%)
Exports yoy growth
Imports yoy growth
(%)
Repo rate
Reverse Repo rate
CRR
5.0
7.50
0.0
7.00
(5.0)
6.50
6.00
(10.0)
5.50
(15.0)
5.00
(20.0)
4.50
(25.0)
4.00
(30.0)
3.50
(35.0)
3.00
Source: Bloomberg, Angel Research
Source: RBI, Angel Research
Market Outlook
July 26, 2016
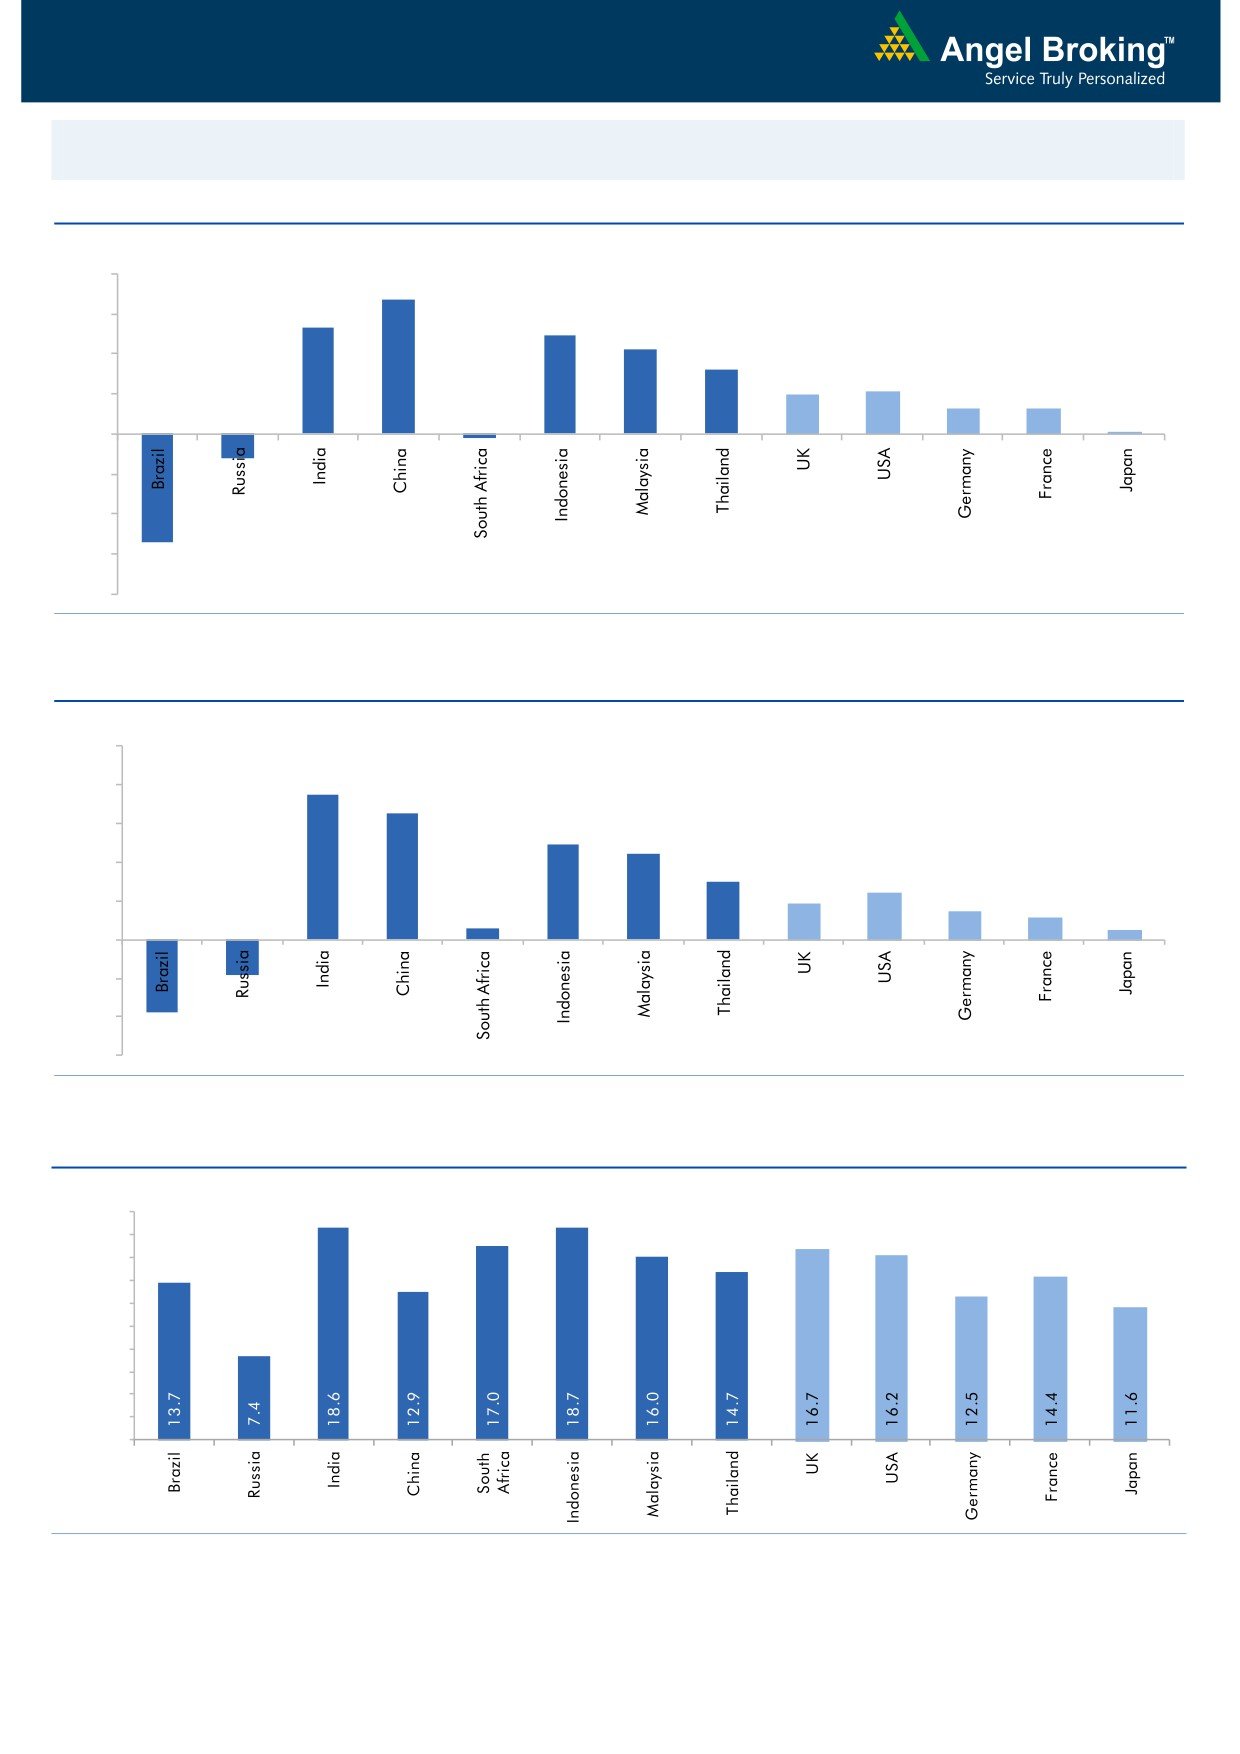
Global watch
Exhibit 1: Latest quarterly GDP Growth (%, yoy) across select developing and developed countries
(%)
8.0
6.7
6.0
5.3
4.9
4.2
4.0
3.2
2.0
2.1
2.0
1.3
1.3
0.1
-
(2.0)
(4.0)
(1.2)
(6.0)
(5.4)
(0.2)
(8.0)
Source: Bloomberg, Angel Research
Exhibit 2: 2016 GDP Growth projection by IMF (%, yoy) across select developing and developed countries
(%)
10.0
7.5
8.0
6.5
6.0
4.9
4.4
4.0
3.0
2.4
1.9
1.5
2.0
1.1
0.6
0.5
(3.8)
(1.8)
-
(2.0)
(4.0)
(6.0)
Source: IMF, Angel Research
Exhibit 3: One year forward P-E ratio across select developing and developed countries
(x)
20.0
18.0
16.0
14.0
12.0
10.0
8.0
6.0
4.0
2.0
-
Source: IMF, Angel Research
Market Outlook
July 26, 2016
Exhibit 4: Relative performance of indices across globe
Returns (%)
Country
Name of index
Closing price
1M
3M
1YR
Brazil
Bovespa
56,873
10.3
9.7
10.2
Russia
Micex
1,932
0.7
(1.4)
19.5
India
Nifty
8,636
5.3
9.9
0.3
China
Shanghai Composite
3,016
5.6
1.9
(21.1)
South Africa
Top 40
46,545
(1.9)
(0.6)
(0.2)
Mexico
Mexbol
47,130
2.1
3.8
7.8
Indonesia
LQ45
900
9.7
7.9
8.2
Malaysia
KLCI
1,668
2.1
(2.4)
(3.4)
Thailand
SET 50
960
6.5
9.0
(2.1)
USA
Dow Jones
18,493
4.0
2.7
6.0
UK
FTSE
6,710
5.9
6.3
2.4
Japan
Nikkei
16,620
3.5
(1.5)
(18.5)
Germany
DAX
10,198
(0.6)
(0.9)
(9.0)
France
CAC
4,388
(1.7)
(3.2)
(14.3)
Source: Bloomberg, Angel Research
Stock Watch
July 26, 2016
Company Name
Reco
CMP
Target
Mkt Cap
Sales ( Čcr )
OPM(%)
EPS (Č)
PER(x)
P/BV(x)
RoE(%)
EV/Sales(x)
(Č)
Price ( Č)
( Č cr )
FY16E FY17E
FY16E
FY17E
FY16E
FY17E
FY16E
FY17E
FY16E
FY17E
FY16E
FY17E
FY16E
FY17E
Agri / Agri Chemical
Rallis
Neutral
218
-
4,246
1,612
1,911
13.3
13.3
7.4
9.5
29.5
23.0
4.7
4.2
16.7
18.4
2.6
2.2
United Phosphorus
Buy
579
684
24,823
13,083
15,176
18.5
18.5
31.5
37.4
18.4
15.5
3.7
3.0
21.4
21.4
2.0
1.7
Auto & Auto Ancillary
Ashok Leyland
Buy
96
111
27,363
17,995
21,544
11.4
11.6
3.4
4.7
28.3
20.5
5.0
4.6
17.7
22.2
1.4
1.1
Bajaj Auto
Neutral
2,700
-
78,129
22,709
25,860
20.9
20.1
129.0
143.6
20.9
18.8
6.4
5.5
30.7
29.4
3.0
2.6
Bharat Forge
Buy
746
875
17,366
7,351
8,318
19.9
19.7
31.2
36.5
23.9
20.4
4.3
3.6
19.3
19.2
2.4
2.1
Eicher Motors
Neutral
19,972
-
54,246
15,556
16,747
15.5
17.3
464.8
597.5
43.0
33.4
15.7
11.5
36.2
34.3
3.4
3.1
Gabriel India
Neutral
104
-
1,496
1,415
1,544
8.7
9.0
4.6
5.4
22.6
19.3
4.1
3.6
18.1
18.9
1.0
0.9
Hero Motocorp
Neutral
3,280
-
65,492
28,244
30,532
15.5
15.9
156.7
168.5
20.9
19.5
8.4
7.1
39.9
36.4
2.1
1.9
Jamna Auto Industries Neutral
176
-
1,405
1,281
1,473
11.2
11.5
7.6
9.2
23.1
19.1
5.8
4.8
25.4
25.2
1.1
1.0
L G Balakrishnan & Bros Neutral
504
-
792
1,254
1,394
11.6
11.8
35.9
41.7
14.1
12.1
1.9
1.7
13.5
13.8
0.7
0.7
Mahindra and Mahindra Neutral
1,460
-
90,695
38,416
42,904
13.7
13.9
54.8
63.4
26.7
23.0
4.1
3.7
15.4
15.8
2.0
1.8
Maruti
Neutral
4,551
-
137,465
57,865
68,104
16.4
16.7
176.3
225.5
25.8
20.2
5.0
4.3
19.4
21.2
2.1
1.7
Minda Industries
Neutral
1,170
-
1,856
2,523
2,890
8.7
9.0
55.0
65.4
21.3
17.9
4.1
3.3
19.3
18.7
0.8
0.7
Motherson Sumi
Neutral
319
-
42,136
39,343
45,100
8.8
9.1
10.1
12.5
31.5
25.5
10.0
7.8
35.3
34.4
1.1
1.0
Rane Brake Lining
Neutral
627
-
496
454
511
11.5
12.0
25.2
31.0
24.9
20.2
3.7
3.4
14.9
16.6
0.9
0.8
Setco Automotive
Neutral
51
-
676
594
741
12.7
13.7
1.7
3.2
29.8
15.8
3.1
2.7
10.4
16.9
1.5
1.2
Tata Motors
Neutral
509
-
146,930
259,686
273,957
13.0
13.4
25.9
29.5
19.7
17.3
2.6
2.3
8.0
9.0
0.7
0.7
TVS Motor
Accumulate
301
330
14,283
11,263
13,122
6.9
8.5
9.2
15.0
32.7
20.0
7.5
5.9
22.7
29.6
1.3
1.1
Amara Raja Batteries
Buy
907
1,076
15,489
4,690
5,429
17.5
17.5
28.5
35.3
31.9
25.7
7.4
6.1
23.1
25.9
3.2
2.7
Exide Industries
Neutral
181
-
15,415
6,950
7,784
14.4
14.8
6.6
7.3
27.5
24.8
3.5
3.2
12.6
12.8
1.9
1.7
Apollo Tyres
Buy
162
183
8,251
12,056
12,714
17.2
16.4
23.0
20.3
7.1
8.0
1.3
1.1
17.7
13.6
0.7
0.7
Ceat
Buy
907
1,119
3,669
6,041
6,597
14.1
13.7
99.5
111.9
9.1
8.1
1.8
1.5
19.6
18.5
0.7
0.6
JK Tyres
Neutral
92
-
2,097
7,446
7,669
15.2
14.0
19.6
18.4
4.7
5.0
1.2
1.0
25.2
19.5
0.7
0.6
Swaraj Engines
Neutral
1,172
-
1,456
552
630
14.2
14.7
44.6
54.1
26.3
21.7
6.1
5.6
23.2
25.6
2.4
2.1
Subros
Neutral
96
-
579
1,293
1,527
11.8
11.9
4.2
6.7
23.0
14.4
1.7
1.6
7.7
11.5
0.7
0.6
Indag Rubber
Neutral
186
-
488
283
329
17.0
17.2
13.0
15.4
14.4
12.1
3.1
2.6
21.8
21.6
1.5
1.2
Capital Goods
ACE
Neutral
48
-
479
660
839
4.7
8.2
1.0
3.9
48.5
12.4
1.5
1.4
3.2
11.3
0.8
0.6
BEML
Buy
983
1,157
4,094
3,277
4,006
6.0
8.9
36.2
64.3
27.2
15.3
1.9
1.7
5.7
11.7
1.3
1.0
Bharat Electronics
Accumulate
1,244
1,414
29,850
7,295
8,137
20.0
16.8
56.5
58.7
22.0
21.2
3.3
2.9
42.1
44.6
3.3
2.8
Stock Watch
July 26, 2016
Company Name
Reco
CMP
Target
Mkt Cap
Sales ( Čcr )
OPM(%)
EPS (Č)
PER(x)
P/BV(x)
RoE(%)
EV/Sales(x)
(Č)
Price ( Č)
( Č cr )
FY16E
FY17E
FY16E
FY17E
FY16E
FY17E
FY16E
FY17E
FY16E
FY17E
FY16E
FY17E
FY16E
FY17E
Capital Goods
Voltas
Buy
336
407
11,128
5,857
6,511
7.5
7.9
11.7
12.9
28.7
26.1
4.7
4.1
17.1
16.7
1.9
1.7
BGR Energy
Neutral
121
-
875
3,615
3,181
9.5
9.4
16.7
12.4
7.3
9.8
0.7
0.7
10.0
7.0
0.7
0.8
BHEL
Neutral
147
-
36,004
33,722
35,272
10.8
11.7
10.5
14.2
14.0
10.4
1.0
1.0
7.0
9.0
1.1
1.1
Blue Star
Accumulate
468
495
4,462
3,770
4,351
5.7
6.4
11.4
17.2
41.0
27.3
6.4
5.9
18.4
23.1
1.1
1.0
Crompton Greaves
Neutral
74
-
4,625
13,484
14,687
4.9
6.2
4.5
7.1
16.4
10.4
1.2
1.1
7.2
10.8
0.5
0.4
Greaves Cotton
Neutral
144
-
3,517
1,655
1,755
16.6
16.8
7.4
7.8
19.5
18.5
3.9
3.7
21.1
20.6
2.0
1.9
Inox Wind
Buy
231
286
5,115
5,605
6,267
15.7
16.4
24.8
30.0
9.3
7.7
2.6
1.9
25.9
24.4
1.0
0.9
KEC International
Neutral
142
-
3,640
8,791
9,716
6.1
6.8
5.4
8.2
26.2
17.3
2.6
2.4
10.0
14.0
0.6
0.6
Thermax
Neutral
909
-
10,827
6,413
7,525
7.4
8.5
30.5
39.3
29.8
23.1
4.6
4.0
15.0
17.0
1.7
1.4
VATech Wabag
Accumulate
591
681
3,220
3,136
3,845
8.9
9.1
26.0
35.9
22.7
16.5
2.8
2.4
13.4
15.9
1.0
0.8
Cement
ACC
Neutral
1,678
-
31,513
13,151
14,757
16.4
18.3
63.9
83.4
26.3
20.1
3.4
3.1
13.3
16.1
2.1
1.8
Ambuja Cements
Neutral
269
-
41,684
11,564
12,556
19.4
20.7
8.9
10.1
30.2
26.6
3.8
3.6
12.8
13.8
3.1
2.9
HeidelbergCement
Neutral
127
-
2,881
1,772
1,926
13.3
15.4
1.0
3.0
127.2
42.4
3.2
3.0
2.6
7.9
2.1
1.8
India Cements
Neutral
117
-
3,600
4,216
4,840
18.0
19.5
4.0
9.9
29.3
11.8
1.2
1.1
4.0
9.5
1.2
0.9
JK Cement
Neutral
704
-
4,924
3,661
4,742
10.1
15.8
7.5
28.5
93.9
24.7
2.8
2.5
7.5
22.9
1.8
1.4
J K Lakshmi Cement
Neutral
422
-
4,970
2,947
3,616
16.7
19.9
11.5
27.2
36.7
15.5
3.5
3.0
9.8
20.8
2.0
1.6
Mangalam Cements
Neutral
304
-
811
1,053
1,347
10.5
13.3
8.4
26.0
36.2
11.7
1.5
1.4
4.3
12.5
1.2
0.9
Orient Cement
Neutral
170
-
3,476
1,854
2,524
21.2
22.2
7.7
11.1
22.0
15.3
3.2
2.7
13.3
15.7
2.7
1.9
Ramco Cements
Neutral
556
-
13,236
4,036
4,545
20.8
21.3
15.1
18.8
36.8
29.6
4.5
4.0
12.9
14.3
3.8
3.3
Shree Cement^
Neutral
16,072
-
55,992
7,150
8,742
26.7
28.6
228.0
345.5
70.5
46.5
10.4
8.7
15.7
20.3
7.4
6.0
UltraTech Cement
Neutral
3,672
-
100,772
24,669
29,265
18.2
20.6
82.0
120.0
44.8
30.6
4.8
4.2
11.3
14.7
4.0
3.4
Construction
ITNL
Accumulate
80
93
2,642
7,360
8,682
34.0
32.2
7.0
8.6
11.5
9.3
0.4
0.4
3.2
2.5
3.7
3.6
KNR Constructions
Accumulate
575
603
1,618
937
1,470
14.3
14.0
44.2
38.6
13.0
14.9
2.6
2.3
15.4
15.4
1.8
1.2
Larsen & Toubro
Accumulate
1,585
1,700
147,765
58,870
65,708
8.3
10.3
42.0
53.0
37.8
29.9
2.6
2.4
8.8
11.2
2.7
2.5
Gujarat Pipavav Port
Neutral
183
-
8,866
629
684
51.0
52.2
6.4
5.9
28.7
31.1
3.8
3.5
15.9
12.7
13.5
12.2
MBL Infrastructures
Buy
139
285
577
2,313
2,797
12.2
14.6
19.0
20.0
7.3
7.0
0.8
0.7
11.3
10.6
1.0
0.9
Nagarjuna Const.
Neutral
82
-
4,584
7,892
8,842
8.8
9.1
3.0
5.3
27.5
15.6
1.4
1.3
5.0
8.5
0.8
0.7
PNC Infratech
Accumulate
556
647
2,855
1,873
2,288
13.2
13.5
24.0
32.0
23.2
17.4
2.3
2.0
12.1
12.3
1.7
1.4
Simplex Infra
Neutral
299
-
1,479
5,955
6,829
10.3
10.5
16.0
31.0
18.7
9.7
1.0
0.9
5.3
9.9
0.8
0.6
Stock Watch
July 26, 2016
Company Name
Reco
CMP
Target
Mkt Cap
Sales ( Čcr )
OPM(%)
EPS (Č)
PER(x)
P/BV(x)
RoE(%)
EV/Sales(x)
(Č)
Price ( Č)
( Č cr )
FY16E
FY17E
FY16E
FY17E
FY16E
FY17E
FY16E
FY17E
FY16E
FY17E
FY16E
FY17E
FY16E
FY17E
Construction
Power Mech Projects
Neutral
560
-
824
1,539
1,801
12.8
12.7
59.0
72.1
9.5
7.8
1.4
1.2
18.6
16.8
0.5
0.5
Sadbhav Engineering
Neutral
300
-
5,145
3,186
3,598
10.2
10.3
8.0
9.0
37.5
33.3
3.5
3.1
9.4
9.9
1.9
1.7
NBCC
Neutral
250
-
14,973
5,838
7,428
6.0
7.9
5.2
8.2
48.0
30.4
1.5
1.2
21.9
28.2
2.3
1.7
MEP Infra
Neutral
46
-
741
1,956
1,876
28.1
30.5
1.3
3.0
35.1
15.2
7.4
5.0
21.2
32.8
1.8
1.8
SIPL
Neutral
100
-
3,515
675
1,042
62.4
64.7
-
-
3.7
4.3
-
-
16.9
11.4
Engineers India
Neutral
230
-
7,733
1,667
1,725
13.5
16.0
9.7
11.4
23.7
20.1
2.8
2.7
11.7
13.4
3.0
3.0
Financials
Allahabad Bank
Neutral
79
-
5,701
8,569
9,392
2.8
2.9
16.3
27.5
4.8
2.9
0.5
0.4
7.6
11.9
-
-
Axis Bank
Neutral
538
-
128,479
26,204
29,738
3.6
3.5
34.5
35.4
15.6
15.2
2.5
2.2
16.8
14.9
-
-
Bank of Baroda
Neutral
156
-
35,887
18,802
21,088
2.0
2.2
(7.4)
13.0
12.0
1.3
1.0
(4.2)
7.3
-
-
Bank of India
Neutral
110
-
10,274
15,972
17,271
1.9
2.0
15.3
33.4
7.2
3.3
0.3
0.3
3.6
7.6
-
-
Canara Bank
Neutral
254
-
13,776
15,441
16,945
2.0
2.1
46.6
70.4
5.5
3.6
0.5
0.4
8.0
11.2
-
-
Dena Bank
Neutral
40
-
2,634
3,440
3,840
2.1
2.3
7.3
10.0
5.5
3.9
0.4
0.3
6.1
7.9
-
-
Dewan Housing Finance Buy
225
270
6,576
1,828
2,225
2.9
3.0
24.9
29.7
9.1
7.6
1.4
1.2
15.1
16.1
-
-
Equitas Holdings
Buy
187
235
6,265
679
1,076
12.4
11.7
6.2
6.7
30.2
27.9
3.8
2.7
13.3
12.5
-
-
Federal Bank
Neutral
66
-
11,340
3,279
3,787
2.8
2.9
3.9
5.5
16.8
11.9
1.4
1.3
8.4
10.8
-
-
HDFC
Neutral
1,380
-
218,173
10,358
11,852
3.3
3.3
41.1
47.0
33.6
29.3
6.4
5.8
24.7
24.9
-
-
HDFC Bank
Neutral
1,247
-
315,594
38,606
47,696
4.4
4.5
48.8
61.4
25.5
20.3
4.3
3.8
18.7
20.0
-
-
ICICI Bank
Neutral
269
-
156,562
34,279
39,262
3.3
3.3
21.0
24.4
12.8
11.0
2.2
1.8
14.4
14.7
-
-
IDBI Bank
Neutral
74
-
15,256
9,625
10,455
1.8
1.8
8.5
14.2
8.7
5.2
0.5
0.5
5.9
9.3
-
-
Indian Bank
Neutral
153
-
7,348
6,160
6,858
2.5
2.5
24.5
29.8
6.3
5.1
0.5
0.4
7.7
8.6
-
-
LIC Housing Finance
Accumulate
518
592
26,162
3,179
3,758
2.6
2.6
32.9
40.6
15.8
12.8
2.9
2.5
19.6
20.7
-
-
Oriental Bank
Neutral
116
-
4,010
7,643
8,373
2.4
2.4
37.2
45.4
3.1
2.6
0.3
0.2
8.2
9.4
-
-
Punjab Natl.Bank
Neutral
130
-
25,556
23,122
26,022
2.8
2.8
7.0
21.6
18.6
6.0
0.9
0.9
3.4
10.0
-
-
South Ind.Bank
Neutral
22
-
2,937
1,965
2,185
2.5
2.5
2.5
3.3
8.7
6.6
0.9
0.8
9.5
11.7
-
-
St Bk of India
Neutral
230
-
178,427
79,958
86,061
2.6
2.6
13.4
20.7
17.2
11.1
1.4
1.3
11.5
12.8
-
-
Union Bank
Neutral
132
-
9,040
12,646
14,129
2.3
2.4
31.0
39.1
4.2
3.4
0.5
0.4
9.8
11.4
-
-
Vijaya Bank
Neutral
43
-
4,275
3,536
3,827
1.9
1.9
5.5
6.7
7.7
6.4
0.6
0.6
7.8
8.8
-
-
Yes Bank
Neutral
1,183
-
49,783
7,190
9,011
3.2
3.3
58.2
69.7
20.3
17.0
3.6
3.1
19.2
19.6
-
-
FMCG
Asian Paints
Neutral
1,069
-
102,524
15,534
17,445
17.7
16.8
18.4
19.6
58.2
54.5
20.6
19.4
34.6
35.6
6.2
5.5
Stock Watch
July 26, 2016
Company Name
Reco
CMP
Target
Mkt Cap
Sales ( Čcr )
OPM(%)
EPS (Č)
PER(x)
P/BV(x)
RoE(%)
EV/Sales(x)
(Č)
Price ( Č)
( Č cr )
FY16E FY17E
FY16E
FY17E
FY16E
FY17E
FY16E
FY17E
FY16E
FY17E
FY16E
FY17E
FY16E
FY17E
FMCG
Britannia
Neutral
2,848
-
34,164
8,481
9,795
14.0
14.1
65.5
78.3
43.5
36.4
20.6
16.9
38.3
41.2
3.9
3.4
Colgate
Neutral
961
-
26,142
4,136
4,632
22.5
23.3
22.2
25.3
43.3
38.0
26.3
23.4
68.6
67.5
6.0
5.3
Dabur India
Neutral
306
-
53,830
9,370
10,265
17.6
17.3
7.3
8.1
41.7
37.8
10.8
9.9
31.7
30.6
5.7
5.2
GlaxoSmith Con*
Neutral
6,551
-
27,552
4,519
5,142
19.6
19.8
164.3
191.2
39.9
34.3
11.0
9.4
30.8
29.9
5.3
4.6
Godrej Consumer
Neutral
1,645
-
56,009
9,003
10,335
18.1
18.7
34.1
41.8
48.2
39.4
10.4
8.9
23.9
24.8
6.2
5.4
HUL
Neutral
907
-
196,254
33,299
35,497
17.1
17.1
18.9
20.0
48.0
45.3
42.1
36.6
87.6
80.8
5.9
5.5
ITC
Neutral
251
-
303,339
36,837
39,726
38.8
38.7
8.2
9.0
30.8
28.0
8.6
7.5
27.8
26.9
7.6
7.1
Marico
Neutral
283
-
36,460
6,151
6,966
17.2
17.3
5.4
6.4
52.3
44.2
16.4
13.0
33.2
32.4
5.7
5.1
Nestle*
Neutral
7,106
-
68,516
9,393
10,507
22.2
22.3
106.8
121.8
66.5
58.3
23.4
21.0
34.8
36.7
6.6
5.9
Tata Global
Neutral
133
-
8,422
8,635
9,072
9.8
9.9
5.8
7.2
23.0
18.5
2.0
2.0
6.8
7.4
1.0
0.9
Procter & Gamble
Buy
6,376
7,369
20,697
2,588
2,939
23.3
23.2
130.2
146.2
49.0
43.6
97.6
93.6
27.6
25.3
7.5
6.5
Hygiene
IT
HCL Tech^
Buy
738
1,000
104,100
37,061
30,781
21.5
20.5
51.4
40.0
14.4
18.5
3.7
2.7
20.1
20.3
2.5
2.6
Infosys
Buy
1,081
1,374
248,185
62,441
70,558
27.5
27.5
59.0
65.3
18.3
16.6
3.7
3.4
22.2
22.4
3.4
2.9
TCS
Buy
2,552
3,004
502,765
108,646
122,770
28.3
28.3
123.7
141.0
20.6
18.1
6.8
6.3
33.1
34.6
4.0
3.4
Tech Mahindra
Buy
508
700
49,356
26,494
30,347
16.3
17.0
32.2
37.5
15.8
13.6
3.4
3.0
21.7
21.8
1.6
1.3
Wipro
Buy
542
680
134,011
50,808
56,189
23.7
23.8
37.3
40.7
14.5
13.3
2.8
2.5
19.2
17.7
2.2
1.8
Media
D B Corp
Neutral
409
-
7,510
2,025
2,187
27.4
27.4
17.4
18.9
23.5
21.7
5.3
4.8
22.9
23.7
3.5
3.2
HT Media
Neutral
80
-
1,863
2,495
2,673
12.9
13.2
6.8
7.2
11.8
11.1
0.9
0.9
7.5
7.8
0.3
0.3
Jagran Prakashan
Accumulate
179
205
5,852
2,107
2,355
33.5
28.0
10.1
10.8
17.8
16.6
4.2
3.6
23.3
21.7
2.9
2.5
Sun TV Network
Neutral
434
-
17,084
2,510
2,763
71.8
71.5
21.9
24.8
19.8
17.5
4.7
4.2
22.8
24.3
5.6
5.1
Hindustan Media
Neutral
274
-
2,011
914
1,016
21.7
21.5
21.9
23.3
12.5
11.8
2.3
1.9
18.0
16.2
1.6
1.4
Ventures
Metals & Mining
Coal India
Buy
333
380
210,272
76,167
84,130
19.9
22.3
22.4
25.8
14.9
12.9
5.4
5.2
35.5
41.0
2.0
1.8
Hind. Zinc
Neutral
196
-
82,859
14,641
14,026
50.4
50.4
17.7
16.0
11.1
12.3
1.7
1.6
16.2
13.2
3.3
3.2
Hindalco
Neutral
135
-
27,867
104,356
111,186
8.7
9.5
6.7
11.1
20.1
12.2
0.7
0.7
3.5
5.9
0.8
0.7
JSW Steel
Neutral
1,627
-
39,337
42,308
45,147
16.4
20.7
(10.3)
49.5
32.9
1.8
1.8
(1.0)
5.6
2.0
1.8
NMDC
Neutral
100
-
39,528
8,237
10,893
46.6
44.5
10.0
11.7
10.0
8.6
1.1
1.0
12.5
13.0
4.4
3.3
SAIL
Neutral
48
-
19,948
45,915
53,954
7.2
10.5
1.5
4.4
32.1
11.0
0.5
0.5
2.3
4.1
1.1
1.0
Vedanta
Neutral
172
-
51,037
71,445
81,910
26.2
26.3
12.9
19.2
13.4
9.0
0.9
0.8
7.2
8.9
1.1
0.9
Tata Steel
Neutral
364
-
35,333
126,760
137,307
8.9
11.3
6.4
23.1
57.2
15.8
1.2
1.1
2.0
7.1
0.9
0.8
Stock Watch
July 26, 2016
Company Name
Reco
CMP
Target
Mkt Cap
Sales ( Čcr )
OPM(%)
EPS (Č)
PER(x)
P/BV(x)
RoE(%)
EV/Sales(x)
(Č)
Price ( Č)
( Č cr )
FY16E FY17E
FY16E
FY17E
FY16E
FY17E
FY16E
FY17E
FY16E
FY17E
FY16E
FY17E
FY16E
FY17E
Oil & Gas
Cairn India
Neutral
199
-
37,244
11,323
12,490
49.4
51.0
20.7
20.7
9.6
9.6
0.6
0.6
6.4
6.1
1.9
1.2
GAIL
Neutral
391
-
49,591
64,856
70,933
9.1
9.6
24.0
28.9
16.3
13.5
1.4
1.3
8.8
9.6
1.0
0.9
ONGC
Neutral
227
-
193,953
154,564
145,998
36.8
37.4
20.8
22.6
10.9
10.0
1.0
1.0
10.1
9.7
1.5
1.6
Petronet LNG
Neutral
297
-
22,275
29,691
31,188
5.8
6.2
12.8
13.4
23.2
22.1
3.5
3.1
15.8
14.8
0.8
0.8
Indian Oil Corp
Neutral
537
-
130,381
359,607
402,760
5.9
6.1
42.5
48.7
12.7
11.0
1.7
1.5
14.1
14.4
0.4
0.4
Reliance Industries
Neutral
1,021
-
330,940
304,775
344,392
12.6
13.4
91.3
102.6
11.2
10.0
1.3
1.1
11.8
12.0
1.0
0.8
Pharmaceuticals
Alembic Pharma
Neutral
588
-
11,090
3,145
3,483
31.9
16.2
38.2
18.7
15.4
31.5
6.9
5.8
57.9
20.1
3.4
3.1
Aurobindo Pharma
Buy
799
880
46,767
13,651
15,702
21.7
21.7
33.9
38.4
23.6
20.8
6.6
5.1
32.5
27.7
3.5
3.1
Aventis*
Accumulate
4,582
4,738
10,553
2,049
2,375
15.4
17.3
115.4
153.5
39.7
29.9
6.5
5.1
19.3
25.8
4.8
4.0
Cadila Healthcare
Accumulate
372
400
38,042
9,469
11,246
21.2
22.0
14.9
17.1
24.9
21.7
7.1
5.6
28.8
26.6
3.9
3.3
Cipla
Neutral
525
-
42,155
13,372
15,378
16.4
17.4
18.8
21.6
27.9
24.3
3.6
3.1
13.3
13.7
3.1
3.0
Dr Reddy's
Neutral
3,475
-
59,260
15,471
17,479
24.6
24.6
138.2
152.4
25.1
22.8
4.6
3.9
19.7
18.7
3.9
3.5
Dishman Pharma
Neutral
143
-
2,306
1,733
1,906
21.5
21.5
10.1
10.0
14.2
14.3
1.7
1.5
10.5
11.2
1.8
1.5
GSK Pharma*
Neutral
3,404
-
28,833
2,741
3,528
16.5
18.9
44.2
60.1
77.0
56.6
17.0
16.9
21.2
29.9
10.3
8.1
Indoco Remedies
Neutral
315
-
2,900
977
1,112
14.9
18.2
9.0
13.2
35.0
23.8
5.0
4.2
15.1
19.2
2.9
2.6
Ipca labs
Buy
495
613
6,248
2,844
3,799
10.6
15.3
10.6
17.3
46.7
28.6
2.7
2.5
5.9
9.1
2.2
1.7
Lupin
Accumulate
1,717
1,809
77,418
13,702
15,912
23.7
26.4
50.5
58.1
34.0
29.6
7.0
5.8
22.9
21.4
6.0
4.8
Sun Pharma
Buy
803
944
193,137
27,744
31,129
26.0
30.0
22.0
28.0
36.5
28.7
5.3
4.4
18.3
18.7
6.5
5.6
Power
Tata Power
Neutral
72
-
19,473
35,923
37,402
22.6
22.8
4.1
5.2
17.8
14.0
1.4
1.3
7.5
9.3
1.5
1.4
NTPC
Neutral
157
-
129,577
87,271
99,297
23.5
23.5
11.8
13.3
13.4
11.8
1.5
1.4
11.5
12.2
2.5
2.2
Power Grid
Neutral
169
-
88,231
20,702
23,361
86.7
86.4
12.1
13.2
14.0
12.8
2.1
1.8
15.6
15.1
9.1
8.4
Real Estate
MLIFE
Buy
457
554
1,877
826
1,011
20.1
21.9
22.7
30.7
20.2
14.9
1.2
1.1
6.0
7.4
4.2
3.2
Telecom
Bharti Airtel
Neutral
370
-
148,024
101,748
109,191
32.1
31.7
12.0
12.5
30.9
29.6
2.1
2.0
6.9
6.7
2.1
1.9
Idea Cellular
Neutral
107
-
38,547
34,282
36,941
32.0
31.5
5.9
6.2
18.1
17.3
1.7
1.5
9.9
9.3
1.7
1.7
zOthers
Abbott India
Neutral
4,744
-
10,080
2,715
3,153
14.5
14.1
134.3
152.2
35.3
31.2
8.8
7.3
27.4
25.6
3.4
2.9
Bajaj Electricals
Accumulate
240
268
2,428
4,612
5,351
5.6
5.7
9.5
12.4
25.4
19.4
3.2
2.8
12.5
14.4
0.5
0.4
Finolex Cables
Neutral
392
-
5,990
2,520
2,883
12.2
12.0
12.7
14.2
30.9
27.6
4.2
3.7
13.6
13.5
2.0
1.7
Goodyear India*
Buy
528
631
1,219
1,750
1,598
11.3
10.4
53.7
49.4
9.8
10.7
2.1
1.8
23.0
18.2
0.5
0.4
Hitachi
Neutral
1,511
-
4,109
1,779
2,081
7.8
8.8
21.8
33.4
69.3
45.2
11.2
9.1
17.4
22.1
2.2
1.8
Stock Watch
July 26, 2016
Company Name
Reco
CMP
Target
Mkt Cap
Sales ( Čcr )
OPM(%)
EPS (Č)
PER(x)
P/BV(x)
RoE(%)
EV/Sales(x)
(Č)
Price ( Č)
( Č cr )
FY16E
FY17E
FY16E
FY17E
FY16E
FY17E
FY16E
FY17E
FY16E
FY17E
FY16E
FY17E
FY16E
FY17E
zOthers
Jyothy Laboratories
Neutral
290
-
5,249
1,620
1,847
11.5
11.5
7.3
8.5
39.8
34.2
5.1
4.8
13.3
14.4
3.1
2.7
MRF
Buy
34,700
45,575
14,717
20,316
14,488
21.4
21.1
5,488.0
3,798.0
6.3
9.1
2.2
1.8
41.1
21.2
0.7
0.9
Page Industries
Neutral
13,610
-
15,180
1,929
2,450
19.8
20.1
229.9
299.0
59.2
45.5
26.1
18.2
52.1
47.1
7.8
6.1
Relaxo Footwears
Neutral
501
-
6,009
1,767
2,152
12.3
12.5
19.3
25.1
26.0
20.0
6.4
4.9
27.7
27.8
3.3
2.7
Siyaram Silk Mills
Buy
1,052
1,347
986
1,619
1,799
11.6
11.6
93.5
104.9
11.3
10.0
1.9
1.7
17.1
16.4
0.9
0.8
Styrolution ABS India* Neutral
634
-
1,115
1,271
1,440
8.6
9.2
32.0
41.1
19.8
15.5
2.0
1.8
10.7
12.4
0.9
0.7
TVS Srichakra
Buy
2,406
2,932
1,842
2,035
2,252
15.9
15.3
248.6
268.1
9.7
9.0
4.2
3.0
43.6
33.9
0.9
0.8
HSIL
Neutral
310
-
2,243
2,123
2,384
16.1
16.5
15.0
18.9
20.6
16.4
1.6
1.5
8.0
9.4
1.4
1.2
Kirloskar Engines India
Neutral
271
-
3,913
2,403
2,554
8.6
9.9
9.2
10.5
29.5
25.8
2.8
2.7
9.7
10.7
1.2
1.1
Ltd
M M Forgings
Buy
425
546
513
511
615
21.7
21.6
43.1
55.8
9.9
7.6
1.8
1.5
19.9
21.2
1.2
0.9
Banco Products (India) Neutral
173
-
1,234
1,208
1,353
11.0
12.3
10.8
14.5
16.0
11.9
1.8
1.6
11.9
14.5
0.9
0.7
Competent Automobiles Neutral
152
-
93
1,040
1,137
3.2
3.1
25.7
28.0
5.9
5.4
0.9
0.8
15.0
14.3
0.1
0.1
Nilkamal
Neutral
1,291
-
1,927
1,871
2,031
10.7
10.5
63.2
69.8
20.4
18.5
3.3
2.9
17.6
16.6
1.0
0.9
Visaka Industries
Neutral
162
-
257
1,020
1,120
8.7
9.1
13.9
20.1
11.6
8.0
0.7
0.7
6.4
8.7
0.5
0.4
Transport Corporation of
Neutral
354
-
2,713
2,830
3,350
8.8
9.0
14.4
18.3
24.7
19.4
3.8
3.3
15.4
17.1
1.1
1.0
India
Elecon Engineering
Neutral
64
-
697
1,359
1,482
10.3
13.7
0.8
3.9
79.7
16.4
1.3
1.3
1.6
7.8
0.9
0.8
Surya Roshni
Buy
167
201
732
2,992
3,223
8.1
8.4
14.7
18.3
11.4
9.1
1.1
1.0
9.7
11.0
0.5
0.5
MT Educare
Neutral
153
-
608
286
366
18.3
17.7
7.7
9.4
19.8
16.3
4.2
3.7
20.2
21.1
2.1
1.6
Radico Khaitan
Buy
91
125
1,207
1,543
1,659
12.6
13.0
5.8
6.3
15.7
14.3
1.3
1.2
8.5
8.6
1.3
1.2
Garware Wall Ropes
Accumulate
437
460
956
828
898
11.2
10.3
28.3
29.0
15.5
15.1
2.6
2.2
16.8
14.9
1.0
0.9
Wonderla Holidays
Neutral
413
-
2,334
206
308
44.0
43.6
9.0
12.9
45.9
32.0
6.3
5.7
13.7
17.8
10.7
7.1
Linc Pen & Plastics
Neutral
280
-
414
344
382
9.1
9.1
12.4
13.1
22.6
21.4
4.1
3.6
18.0
16.7
1.2
1.1
The Byke Hospitality
Neutral
162
-
651
222
287
20.5
20.5
5.6
7.6
28.8
21.5
5.4
4.5
18.9
20.8
3.0
2.3
Interglobe Aviation
Neutral
957
-
34,468
17,022
21,122
20.7
14.5
63.9
53.7
15.0
17.8
22.4
18.4
149.9
103.2
2.1
1.7
Coffee Day Enterprises
Neutral
253
-
5,206
2,692
2,964
17.0
18.6
-
4.7
-
53.3
3.1
2.9
0.2
5.5
2.2
2.1
Ltd
Navneet Education
Neutral
94
-
2,243
998
1,062
24.1
24.0
5.8
6.1
16.4
15.5
3.6
3.2
22.0
20.6
2.4
2.3
Navkar Corporation
Buy
213
265
3,040
347
408
43.2
42.9
6.7
6.8
32.0
31.5
2.3
2.2
7.3
6.9
9.2
8.3
UFO Moviez
Neutral
584
-
1,613
558
619
32.0
33.2
22.5
30.0
26.0
19.5
3.1
2.7
12.0
13.8
2.6
2.2
VRL Logistics
Neutral
363
-
3,312
1,725
1,902
16.5
16.7
12.2
14.6
29.8
24.9
6.2
5.5
20.8
21.9
1.8
1.6
Stock Watch
July 26, 2016
Company Name
Reco
CMP
Target Mkt Cap
Sales ( Čcr )
OPM(%)
EPS (Č)
PER(x)
P/BV(x)
RoE(%)
EV/Sales(x)
(Č)
Price ( Č)
( Č cr )
FY16E FY17E FY16E FY17E FY16E FY17E FY16E FY17E FY16E FY17E FY16E FY17E FY16E FY17E
zOthers
Team Lease Serv.
Neutral
1,067
-
1,825
2,565
3,229
1.3
1.5
15.2
22.8
70.3
46.9
5.6
5.0
8.0
10.7
0.6
0.4
S H Kelkar & Co.
Neutral
241
-
3,488
928
1,036
15.3
15.1
4.9
6.1
48.9
39.5
4.6
4.2
9.4
10.7
3.4
3.0
Quick Heal
Neutral
273
-
1,909
339
408
27.8
27.3
7.1
7.7
38.6
35.2
3.3
3.3
8.5
9.3
4.6
3.9
Narayana Hrudaya
Neutral
291
-
5,947
1,603
1,873
10.9
11.5
1.0
2.6
305.5
110.0
7.4
6.8
2.4
6.1
3.8
3.3
Manpasand Bever.
Neutral
711
-
3,561
540
836
19.9
19.6
10.2
16.9
69.5
42.1
5.6
5.1
8.1
12.0
5.9
3.8
Parag Milk Foods
Neutral
328
-
2,762
1,645
1,919
9.0
9.3
6.7
9.5
48.9
34.8
6.4
5.4
13.1
15.5
1.9
1.6
Source: Company, Angel Research; Note: *December year end; #September year end; &October year end; Price as on July 25, 2016
Market Outlook
July 26, 2016
Research Team Tel: 022 - 39357800
DISCLAIMER
Angel Broking Private Limited (hereinafter referred to as “Angel”) is a registered Member of National Stock Exchange of India Limited,
Bombay Stock Exchange Limited and Metropolitan Stock Exchange Limited. It is also registered as a Depository Participant with CDSL
and Portfolio Manager with SEBI. It also has registration with AMFI as a Mutual Fund Distributor. Angel Broking Private Limited is a
registered entity with SEBI for Research Analyst in terms of SEBI (Research Analyst) Regulations, 2014 vide registration number
INH000000164. Angel or its associates has not been debarred/ suspended by SEBI or any other regulatory authority for accessing
/dealing in securities Market. Angel or its associates/analyst has not received any compensation / managed or co-managed public
offering of securities of the company covered by Analyst during the past twelve months.
This document is solely for the personal information of the recipient, and must not be singularly used as the basis of any investment
decision. Nothing in this document should be construed as investment or financial advice. Each recipient of this document should make
such investigations as they deem necessary to arrive at an independent evaluation of an investment in the securities of the companies
referred to in this document (including the merits and risks involved), and should consult their own advisors to determine the merits and
risks of such an investment.
Reports based on technical and derivative analysis center on studying charts of a stock's price movement, outstanding positions and
trading volume, as opposed to focusing on a company's fundamentals and, as such, may not match with a report on a company's
fundamentals. Investors are advised to refer the Fundamental and Technical Research Reports available on our website to evaluate the
contrary view, if any.
The information in this document has been printed on the basis of publicly available information, internal data and other reliable
sources believed to be true, but we do not represent that it is accurate or complete and it should not be relied on as such, as this
document is for general guidance only. Angel Broking Pvt. Limited or any of its affiliates/ group companies shall not be in any way
responsible for any loss or damage that may arise to any person from any inadvertent error in the information contained in this report.
Angel Broking Pvt. Limited has not independently verified all the information contained within this document. Accordingly, we cannot
testify, nor make any representation or warranty, express or implied, to the accuracy, contents or data contained within this document.
While Angel Broking Pvt. Limited endeavors to update on a reasonable basis the information discussed in this material, there may be
regulatory, compliance, or other reasons that prevent us from doing so.
This document is being supplied to you solely for your information, and its contents, information or data may not be reproduced,
redistributed or passed on, directly or indirectly.
Neither Angel Broking Pvt. Limited, nor its directors, employees or affiliates shall be liable for any loss or damage that may arise from
or in connection with the use of this information.