Market Outlook
May 25, 2016
Market Cues
Domestic Indices
Chg (%)
(Pts)
(Close)
BSE Sensex
0.3
75
25,305
Indian Markets are expected to open in the green tracking global cues and the SGX
Nifty
0.2
18
7,749
Nifty.
Mid Cap
(0.2)
(18)
10,973
U.S markets closed sharply higher led by receding fear of a rate hike and sharp
Small Cap
(0.6)
(71)
10,852
16.6% jump in new home sales in the month of April. This was way ahead of the
expectations of a 2.3% increase in home sales as predicted by economists.
Bankex
0.3
52
18,703
European markets ended with significant gains, following reduced fears of a Brexit,
after the latest polls showed a rise in support for the U.K. to remain a member of the
Global Indices
Chg (%)
(Pts)
(Close)
European Union.
Dow Jones
1.2
213
17,706
Indian markets kept gyrating between positive and negative territory before finally
Nasdaq
2.0
95
4,861
closing in the green. Markets also saw some pressure ahead of the expiry of the
FTSE
1.3
83
6,219
derivative series due on Thursday.
Nikkei
(0.9)
(156)
16,499
News Analysis
Hang Seng
0.1
21
19,830
Result Review - Cipla, Tech Mahindra, Linc Pen & Plastics
Shanghai Com
(0.8)
-22
2,822
Detailed analysis on Pg2
Advances / Declines
BSE
NSE
Investor’s Ready Reckoner
Advances
899
492
Key Domestic & Global Indicators
Declines
1,638
1,075
Stock Watch: Latest investment recommendations on 150+ stocks
Unchanged
169
64
Refer Pg6 onwards
Top Picks
Volumes (` Cr)
CMP
Target
Upside
Company
Sector
Rating
BSE
2,608
(`)
(`)
(%)
Amara Raja
Auto/Auto Ancillary
Buy
894
1,076
20.3
NSE
15,172
HCL Tech
IT
Buy
738
1,000
35.6
LIC Housing
Financials
Buy
435
592
36.1
Net Inflows (` Cr)
Net
Mtd
Ytd
Bharat Electronics
Capital Goods
Buy
1,109
1,414
27.5
FII
(36)
1,083
12,873
Navkar Corporation Others
Buy
187
265
41.9
MFs
15
3,773
6,369
More Top Picks on Pg5
Key Upcoming Events
Top Gainers
Price (`)
Chg (%)
Previous
Consensus
Date
Region
Event Description
Redington
121
11.3
Reading
Expectations
Fsl
42
5.3
May 26 UK
GDP (YoY)
2.1
2.1
May 26 US
Initial Jobless claims
278
275
Neyvelilig
71
4.7
May 27 US
GDP QoQ (Annualised)
0.5
0.9
Hathway
33
4.1
May 30 US
Consumer Confidence
94.2
96.1
Edelweiss
69
4.0
6.(
More Events on Pg6
Top Losers
Price (`)
Chg (%)
Gvkpil
5
(11.5)
Justdial
641
(8.7)
Hindcopper
43
(8.2)
Welcorp
82
(6.8)
Balramchin
104
(5.7)
As on May 24, 2016
Market Outlook
May 25, 2016
Result Review
Cipla (CMP: `495 / TP: / Upside: )
The company posted results much below expectations. For 4QFY2016, Cipla
posted sales of `3207cr V/s `3274cr expected a yoy growth of 7.6%. The sales
growth was as expected driven by the domestic formulations (`1258cr), which
posted a yoy growth of 15.9%, while the exports are expected to post a yoy growth
of 7.4%. Exports of formulations increased 3.2% to `1,744cr during 4QFY2016,
while Exports of APIs flat at `204cr during 4QFY2016. On operating front, the
EBDITA came in at 5.0% V/s 13.3% in 4QFY2015 and against the 13.8%
expected, mainly driven by the dip in gross profit margins, which came in at 55.8%
V/s 61.1% in 4QFY2015. The, reported EBDITA Margins include a lot of one-offs,
adjusting for which the OPM was 15.8%. The net profit thus came in at `81cr V/s
`399cr expected and V/s `260cr in 4QFY2015, a yoy de-growth of 68.9%. We
would review our rating on the stock.
Y/E
Sales OPM
PAT EPS ROE P/E P/BV EV/EBITDA EV/Sales
March
(` cr)
(%)
(` cr)
(`)
(%)
(x)
(x)
(x)
(x)
FY2016E
13,979
20.2
2,064
25.7
17.6
19.3
3.1
14.1
2.8
FY2017E
16,447
18.6
2,208
27.5
16.1
18.0
2.7
12.7
2.4
Tech Mahindra (CMP: `479 / TP: `530 / Upside: 10.6%)
For 4QFY2016, Tech Mahindra, posted sales of
`6884cr V/s
`6701cr in
3QFY2016, a QoQ growth of 2.7%. On US$ terms, the company posted sales of
US$ 1023mn V/s expectations of US$1021mn, a QoQ growth of 0.8%. In terms
of geography, the ROW drove the growth, with ROW (24.7% of sales V/s 23.2% of
sales in 3QFY2016). Europe was 28.5% of sales V/s 28.9% in 3QFY2016, while
USA was 46.8% of sales V/s 47.8% of sales in 3QFY2016. In terms of Industry,
the growth was driven by BFSI (which was 10.6% of sales V/s 9.8% of sales in
3QFY2016). On operating front, the EBDITA came in at 16.9% V/s 16.6% in
3QFY2016, while EBIT came in at 13.7% V/s 14.4% in 3QFY2016. On the
operational front the attrition levels, came in at 21% V/s 20% in 3QFY2016, while
utilization was flat at 77%. Amongst the client additions, the company added 6
clients. The net profit came in at `897cr V/s `759cr in 3QFY2016, a QoQ growth
of 18.1%, this was mainly driven by the other income, which came in at `166cr
V/s `64cr in 3QFY2016. We maintain our accumulate on the stock.
Y/E
Sales OPM
PAT EPS ROE P/E P/BV EV/EBITDA EV/Sales
March
(` cr)
(%)
(` cr)
(`)
(%)
(x)
(x)
(x)
(x)
FY2016E
26,254
16.2
2,771
28.8
19.3
16.6
3.2
9.9
1.6
FY2017E
29,177
17.0
3,224
33.6
19.1
14.3
2.7
8.1
1.4
Linc Pen & Plastics (CMP: `189 / Neutral rating)
For 4QFY2016, Linc Pen & Plastics Ltd (LPPL) outperformed our estimates on top-
line and bottom-line front. The company’s top-line grew by ~13% YoY to ~INR
105cr, mainly due to higher growth in the domestic as well as the exports
segment. On the operating front, the company reported a margin expansion (up
by 268bp YoY to 10.1%), primarily on account of lower raw material costs. The
reported net profit grew by ~65% YoY to INR 6.3cr on account of higher sales
Market Outlook
May 25, 2016
growth and strong operating performance. Going ahead, we expect LPPL to report
a healthy top-line & bottom-line growth owing to strong domestic as well as export
sales (which are a high margin business). Currently we have a NEUTRAL rating on
the stock.
Economic and Political News
IT dept has decided to declare the names of tax defaulters
Odisha to auction seven mines (iron ore, manganese and one bauxite) by
August this year
India signs $100 mn loan agreement with World Bank for Karnataka Urban
Water Supply Modernisation Project.
Corporate News
Monsanto to reject Bayer bid, seek higher price-sources
Cinepolis to invest `400 crore, add 160 screens across India
Tata Power's generation capacity up by close to 5% in FY16
Quarterly Bloomberg Brokers Consensus Estimate
Tata Steel Ltd. Consol - May 25, 2016
Particulars (` cr)
4QFY16E
4QFY15
y-o-y (%)
3QFY16
q-o-q (%)
Net sales
29,782
33,337
(10.7)
27,819
7.1
EBITDA
1,389
1,543
(10.0)
776
79.1
EBITDA margin (%)
4.7
4.6
2.8
Net profit
(994)
(5,674)
0.0
(2,127)
0.0
Larsen & Toubro Ltd. - May 25, 2016
Particulars (` cr)
4QFY16E
4QFY15
y-o-y (%)
3QFY16
q-o-q (%)
Net sales
20,935
18,968
10.4
25,387
(17.5)
EBITDA
2,647
2,490
6.3
2,650
(0.1)
EBITDA margin (%)
12.6
13.1
10.4
Net profit
1,853
2,061
(10.1)
1,035
79.1
Ashok Leyland Ltd. - May 25, 2016
Particulars (` cr)
4QFY16E
4QFY15
y-o-y (%)
3QFY16
q-o-q (%)
Net sales
5,911
4,436
33.3
4029
46.7
EBITDA
756
457
65.4
423
78.7
EBITDA margin (%)
12.8
10.3
10.5
Net profit
425
230
84.6
199
113.6
Market Outlook
May 25, 2016
Bajaj Auto Ltd. - May 25, 2016
Particulars (` cr)
4QFY16E
4QFY15
y-o-y (%)
3QFY16
q-o-q (%)
Net sales
5,240
4,624
13.3
5463
(4.1)
EBITDA
1,100
838
31.3
1171
(6.1)
EBITDA margin (%)
21.0
18.1
21.4
Net profit
803
622
29.1
901
(10.9)
GAIL Ltd. - May 25, 2016
Particulars (` cr)
4QFY16E
4QFY15
y-o-y (%)
3QFY16
q-o-q (%)
Net sales
13,421
14,235
(5.7)
13380
0.3
EBITDA
1,238
643
92.4
1156
7.1
EBITDA margin (%)
9.2
4.5
8.6
Net profit
706
511
38.3
664
6.3
Cummins India Ltd. - May 25, 2016
Particulars (` cr)
4QFY16E
4QFY15
y-o-y (%)
3QFY16
q-o-q (%)
Net sales
1,224
1,114
9.9
1,116
9.7
EBITDA
200
176
13.7
171
17.0
EBITDA margin (%)
16.3
15.8
15.3
Net profit
193
190
1.3
178
8.4
Bosch Ltd. - May 25, 2016
Particulars (` cr)
1QCY16E
1QCY15
y-o-y (%)
4QCY15
q-o-q (%)
Net sales
2,464
2,355
4.7
2,349
4.9
EBITDA
452
432
4.5
467
(3.4)
EBITDA margin (%)
18.3
18.4
19.9
Net profit
299
306
(2.3)
287
4.1
Oil and Natural Gas Corp. Ltd. - May 25, 2016
Particulars (` cr)
1QCY16E
1QCY15
y-o-y (%)
4QCY15
q-o-q (%)
Net sales
15,878
21,303
(25.5)
18,397
(13.7)
EBITDA
6,489
7,619
(14.8)
4,049
60.3
EBITDA margin (%)
40.9
35.8
22
Net profit
2,482
3,935
(36.9)
1,286
93
Market Outlook
May 25, 2016
Top Picks ★★★★★
Large Cap
Market Cap
CMP
Target
Upside
Company
Rationale
(` Cr)
(`)
(`)
(%)
To outpace battery industry growth due to better technological
Amara Raja Batteries
15,278
894
1,076
20.3
products leading to market share gains in both the automotive
OEM and replacement segments.
Uptick in defense capex by government when coupled with
Bharat Electronics
26,614
1,109
1,414
27.5
BELs strong market positioning, indicate that good times are
ahead for BEL.
The stock is trading at attractive valuations and is factoring all
HCL Tech
1,04,036
738
1,000
35.6
the bad news.
Strong visibility for a robust 20% earnings trajectory, coupled
HDFC Bank
2,88,510
1,141
1,262
10.6
with high quality of earnings on account of high quality retail
business and strategic focus on highly rated corporates.
Back on the growth trend, expect a long term growth of 14%
Infosys
2,72,923
1,188
1,374
15.6
to be a US$20bn in FY2020.
LICHF continues to grow its retail loan book at a healthy pace
with improvement in asset quality. We expect the company to
LIC Housing Finance
21,948
435
592
36.1
post a healthy loan book which is likely to reflect in a strong
earnings growth.
Huge bid pipeline of re-development works at Delhi and other
NBCC
11,269
939
1,089
16.0
State Governments and opportunity from Smart City, positions
NBCC to report strong growth, going forward.
Source: Company, Angel Research
Mid Cap
Market Cap
CMP
Target
Upside
Company
Rationale
(` Cr)
(`)
(`)
(%)
Favorable outlook for the AC industry to augur well for
Cooling products business which is out pacing the market
Blue Star
3,863
429
481
12.0
growth. EMPPAC division's profitability to improve once
operating environment turns around.
With a focus on the low and medium income (LMI) consumer
Dewan Housing
5,356
184
270
47.1
segment, the company has increased its presence in tier-II &
III cities where the growth opportunity is immense.
Commencement of new projects, downtrend in the interest
IL&FS Transport
2,245
68
93
36.3
rate cycle, to lead to stock re-rating
Economic recovery to have favourable impact on advertising
& circulation revenue growth. Further, the acquisition of a
Jagran Prakashan
5,642
173
205
18.8
radio business (Radio City) would also boost the company's
revenue growth.
Speedier execution and speedier sales, strong revenue visibilty
Mahindra Lifespace
1,776
433
554
28.0
in short-to-long run, attractive valuations
Massive capacity expansion along with rail advantage at ICD
Navkar Corporation
2,663
187
265
41.9
as well CFS augurs well for the company
Earnings boost on back of stable material prices and
Radico Khaitan
1,119
84
125
48.6
favourable pricing environment. Valuation discount to peers
provides additional comfort
Strong brands and distribution network would boost growth
Siyaram Silk Mills
947
1,010
1,354
34.0
going ahead. Stock currently trades at an inexpensive
valuation.
Source: Company, Angel Research
Market Outlook
May 25, 2016
Key Upcoming Events
Result Calendar
Date
Company
May 25, 2016
Bajaj Auto, Bosch India, Ashok Leyland, Cummins India, Thermax, LMW, Power Fin.Corpn., Hindustan
Media Ventures, Tata Steel, GAIL, Abbott India, GSK Pharma
May 26, 2016
Tata Chemicals, India Cements, Mphasis, HT Media, BPCL, Finolex Cables, Banco, Power Grid Corpn,
UFO Moviez
May 27, 2016
BHEL, Crompton Greaves, St Bk of India, Canara Bank, Rural Elec.Corp., Central Bank, ONGC, IOC,
HPCL, Cravatex, Surya Roshni, Indoco Remedies, Reliance Power, GIPCL, S H Kelkar & Co.
May 28, 2016
Coal India, Hindalco, Divi's Lab., NHPC, Reliance Infra.
May 30, 2016
Tata Motors, M&M, Blue Star, SAIL, Bajaj Electrical, Hitachi, Sun Pharma, Aurobindo Pharma, NTPC,
Unitech, Transport Corporation of India
Source: Bloomberg, Angel Research
Global economic events release calendar
Bloomberg Data
Date
Time
Country Event Description
Unit
Period
Last Reported Estimated
May 26, 2016 2:00 PM UK
GDP (YoY)
% Change
1Q P
2.10
2.10
6:00 PM US
Initial Jobless claims
Thousands
May 21
278.00
275.00
May 27, 2016 6:00 PM US
GDP Qoq (Annualised)
% Change
1Q S
0.50
0.90
May 30, 2016 7:30 PM US
Consumer Confidence
S.A./ 1985=100 May
94.20
96.10
May 31, 2016 2:30 PM Euro Zone Euro-Zone Consumer Confidence Value
May F
-7.00
1:25 PM Germany Unemployment change (000's) Thousands
May
-16.00
Jun 01, 2016
1:25 PM Germany PMI Manufacturing
Value
May F
52.40
2:00 PM UK
PMI Manufacturing
Value
May
49.20
6:30 AM China
PMI Manufacturing
Value
May
50.10
50.00
Jun 02, 2016
5:15 PM Euro Zone ECB announces interest rates
%
Jun 2
0.00
Jun 03, 2016
1:25 PM Germany PMI Services
Value
May F
55.20
6:00 PM US
Change in Nonfarm payrolls
Thousands
May
160.00
165.00
6:00 PM US
Unnemployment rate
%
May
5.00
4.90
Jun 07, 2016
2:30 PM Euro Zone Euro-Zone GDP s.a. (QoQ)
% Change
1Q F
0.50
11:00 AM India
RBI Reverse Repo rate
%
Jun 7
6.00
Source: Bloomberg, Angel Research
Market Outlook
May 25, 2016
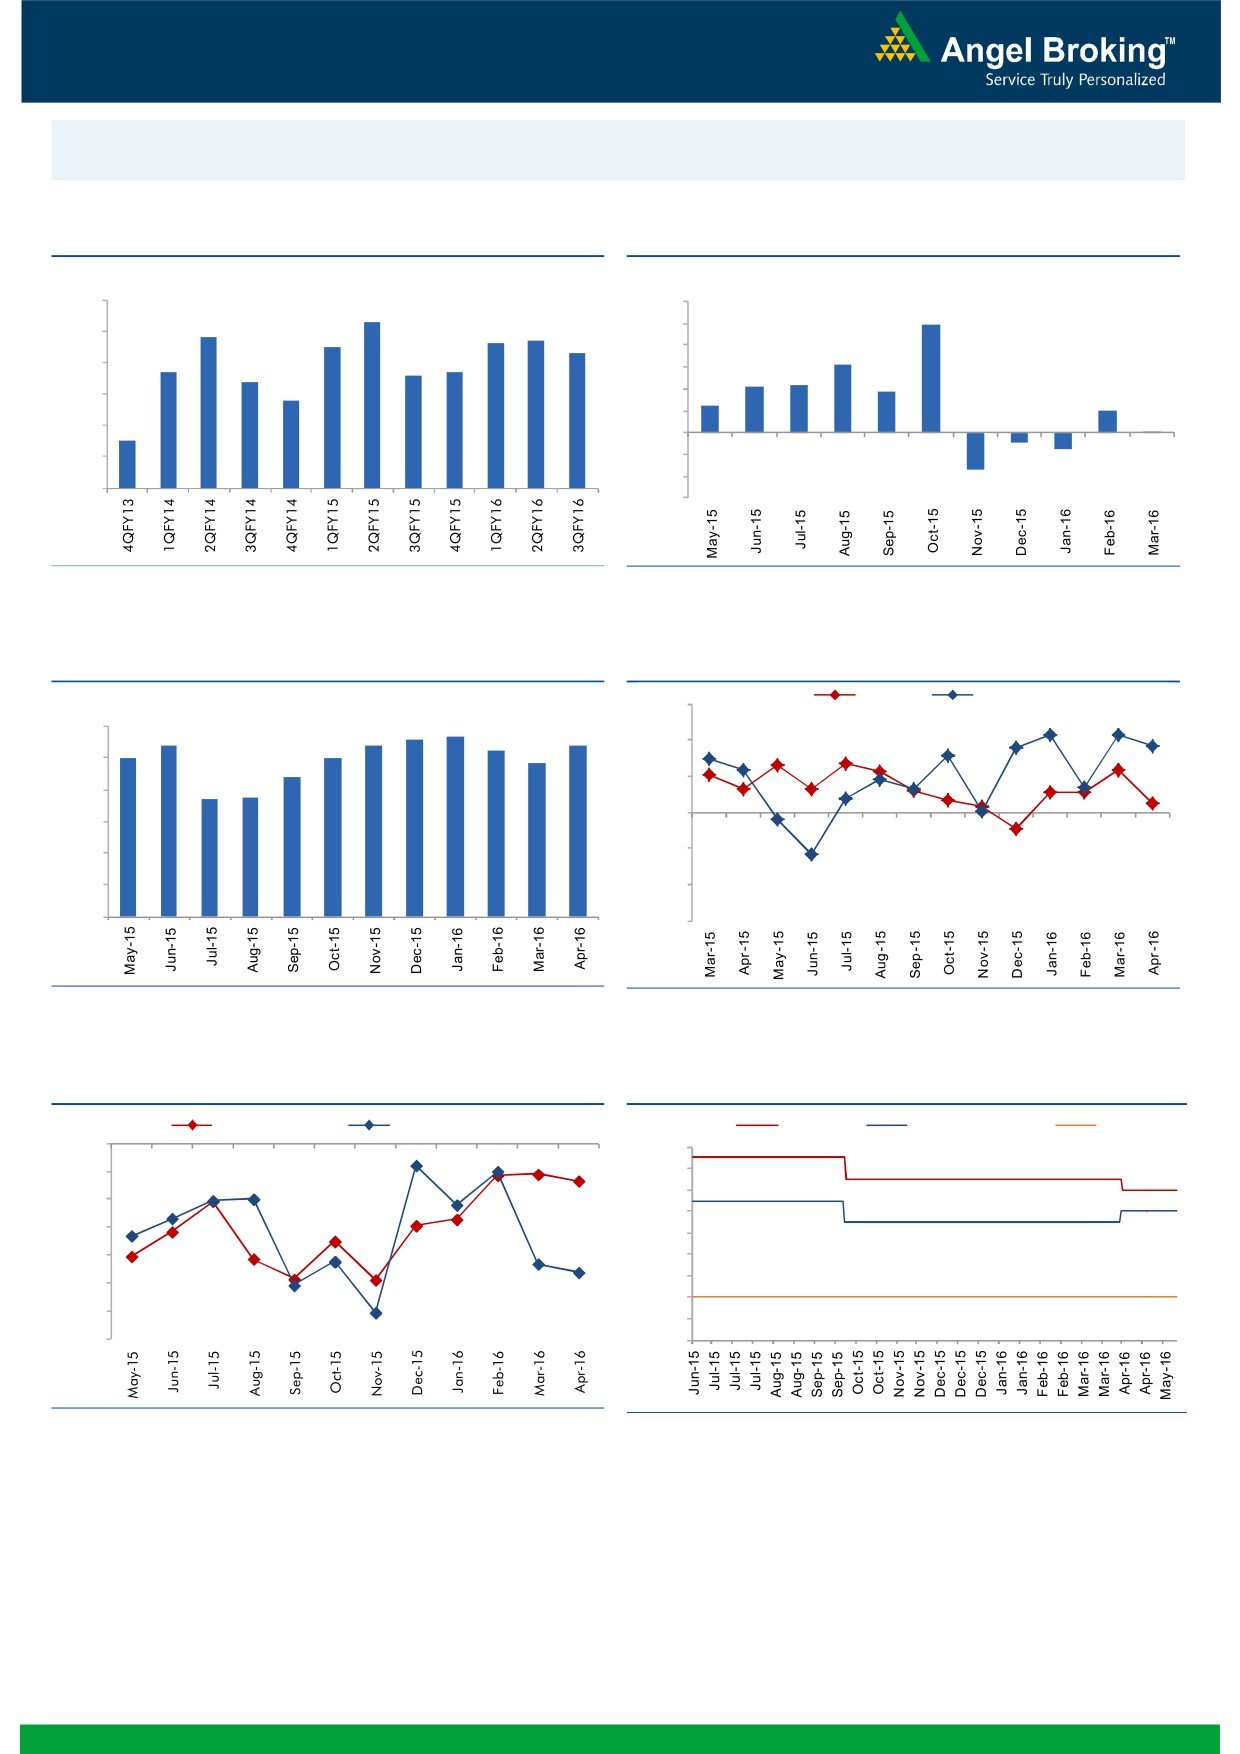
Macro watch
Exhibit 1: Quarterly GDP trends
Exhibit 2: IIP trends
(%)
(%)
9.0
8.3
12.0
9.9
7.8
7.7
8.0
7.5
7.6
10.0
7.3
8.0
6.3
6.7
6.6
6.7
7.0
6.4
6.0
4.2
4.3
3.7
5.8
4.0
2.5
6.0
2.0
2.0
0.1
5.0
4.5
-
4.0
(2.0)
(0.9)
(1.5)
(4.0)
3.0
(3.4)
(6.0)
Source: CSO, Angel Research
Source: MOSPI, Angel Research
Exhibit 3: Monthly CPI inflation trends
Exhibit 4: Manufacturing and services PMI
Mfg. PMI
Services PMI
(%)
56.0
5.6
5.7
6.0
5.4
5.4
5.4
5.3
5.0
5.0
54.0
4.8
5.0
4.4
52.0
3.7
3.7
4.0
50.0
3.0
48.0
2.0
1.0
46.0
-
44.0
Source: MOSPI, Angel Research
Source: Market, Angel Research; Note: Level above 50 indicates expansion
Exhibit 5: Exports and imports growth trends
Exhibit 6: Key policy rates
(%)
Exports yoy growth
Imports yoy growth
(%)
Repo rate
Reverse Repo rate
CRR
0.0
7.50
(5.0)
7.00
6.50
(10.0)
6.00
(15.0)
5.50
(20.0)
5.00
4.50
(25.0)
4.00
(30.0)
3.50
(35.0)
3.00
Source: Bloomberg, Angel Research
Source: RBI, Angel Research
Market Outlook
May 25, 2016
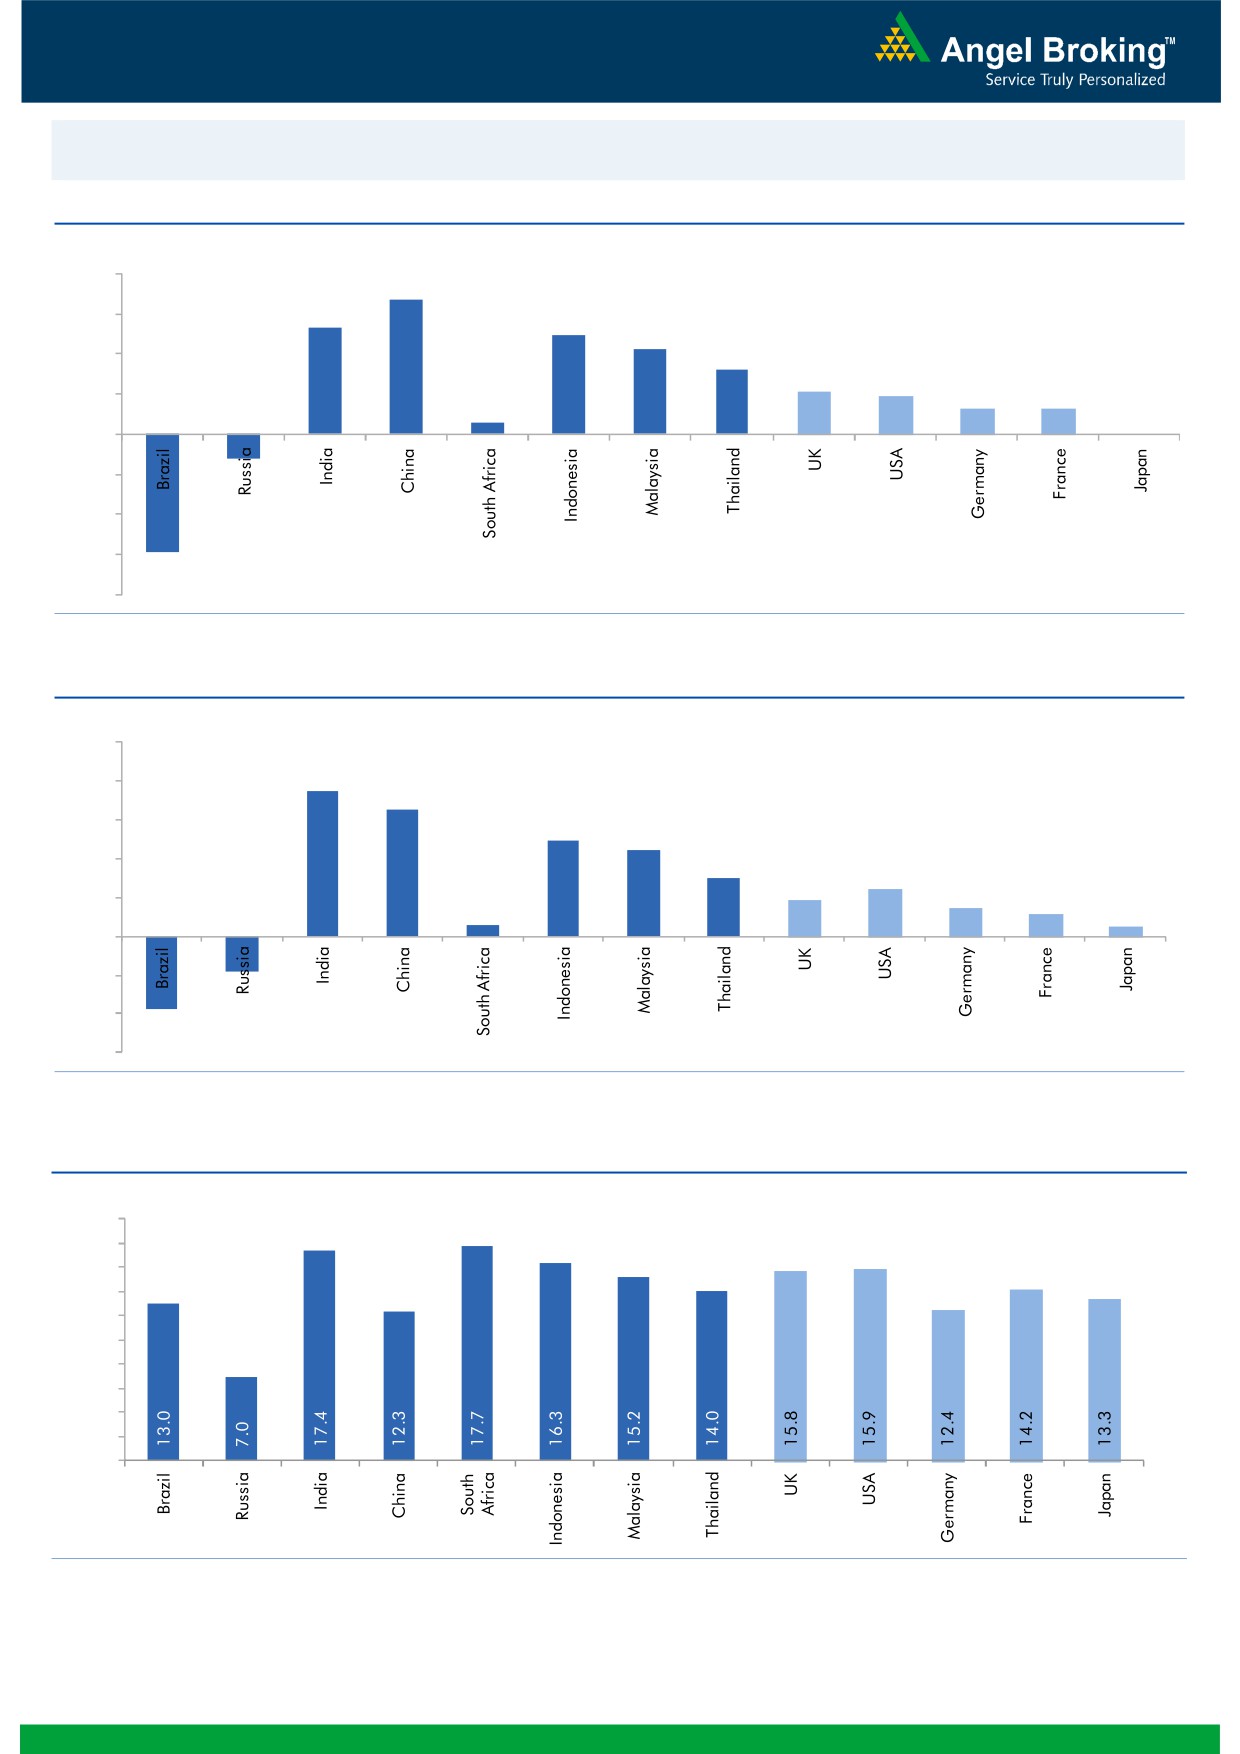
Global watch
Exhibit 1: Latest quarterly GDP Growth (%, yoy) across select developing and developed countries
(%)
8.0
6.7
6.0
5.3
4.9
4.2
4.0
3.2
2.1
1.9
2.0
1.3
1.3
0.6
-
-
(2.0)
(1.2)
(4.0)
(6.0)
(5.9)
(8.0)
Source: Bloomberg, Angel Research
Exhibit 2: 2016 GDP Growth projection by IMF (%, yoy) across select developing and developed countries
(%)
10.0
7.5
8.0
6.5
6.0
4.9
4.4
4.0
3.0
2.4
1.9
1.5
2.0
1.1
0.6
0.5
(3.8)
(1.8)
-
(2.0)
(4.0)
(6.0)
Source: IMF, Angel Research
Exhibit 3: One year forward P-E ratio across select developing and developed countries
(x)
20.0
18.0
16.0
14.0
12.0
10.0
8.0
6.0
4.0
2.0
-
Source: IMF, Angel Research
Market Outlook
May 25, 2016
Exhibit 4: Relative performance of indices across globe
Returns (%)
Country
Name of index
Closing price
1M
3M
1YR
Brazil
Bovespa
49,345
(6.7)
14.1
(12.2)
Russia
Micex
1,884
(2.4)
6.4
13.1
India
Nifty
7,749
(1.9)
9.9
(7.4)
China
Shanghai Composite
2,822
(4.2)
(2.4)
(33.8)
South Africa
Top 40
47,034
(0.5)
5.5
(1.8)
Mexico
Mexbol
45,497
(0.3)
4.9
2.5
Indonesia
LQ45
806
(4.7)
(3.9)
(10.6)
Malaysia
KLCI
1,626
(5.6)
(3.1)
(10.2)
Thailand
SET 50
882
(0.9)
9.7
(11.3)
USA
Dow Jones
17,706
(1.7)
7.8
(2.5)
UK
FTSE
6,219
(2.5)
4.5
(11.7)
Japan
Nikkei
16,499
1.4
4.2
(15.7)
Germany
DAX
10,057
(3.6)
7.1
(13.9)
France
CAC
4,432
(3.0)
3.1
(11.4)
Source: Bloomberg, Angel Research
Market Outlook
May 25, 2016
Research Team Tel: 022 - 39357800
DISCLAIMER
Angel Broking Private Limited (hereinafter referred to as “Angel”) is a registered Member of National Stock Exchange of India Limited,
Bombay Stock Exchange Limited and Metropolitan Stock Exchange of India Limited. It is also registered as a Depository Participant with
CDSL and Portfolio Manager with SEBI. It also has registration with AMFI as a Mutual Fund Distributor. Angel Broking Private Limited is
a registered entity with SEBI for Research Analyst in terms of SEBI (Research Analyst) Regulations, 2014 vide registration number
INH000000164. Angel or its associates has not been debarred/ suspended by SEBI or any other regulatory authority for accessing
/dealing in securities Market. Angel or its associates including its relatives/analyst do not hold any financial interest/beneficial
ownership of more than 1% in the company covered by Analyst. Angel or its associates/analyst has not received any compensation /
managed or co-managed public offering of securities of the company covered by Analyst during the past twelve months. Angel/analyst
has not served as an officer, director or employee of company covered by Analyst and has not been engaged in market making activity
of the company covered by Analyst.
This document is solely for the personal information of the recipient, and must not be singularly used as the basis of any investment
decision. Nothing in this document should be construed as investment or financial advice. Each recipient of this document should
make such investigations as they deem necessary to arrive at an independent evaluation of an investment in the securities of the
companies referred to in this document (including the merits and risks involved), and should consult their own advisors to determine
the merits and risks of such an investment.
Reports based on technical and derivative analysis center on studying charts of a stock's price movement, outstanding positions and
trading volume, as opposed to focusing on a company's fundamentals and, as such, may not match with a report on a company's
fundamentals.
The information in this document has been printed on the basis of publicly available information, internal data and other reliable
sources believed to be true, but we do not represent that it is accurate or complete and it should not be relied on as such, as this
document is for general guidance only. Angel Broking Pvt. Limited or any of its affiliates/ group companies shall not be in any way
responsible for any loss or damage that may arise to any person from any inadvertent error in the information contained in this report.
Angel Broking Pvt. Limited has not independently verified all the information contained within this document. Accordingly, we cannot
testify, nor make any representation or warranty, express or implied, to the accuracy, contents or data contained within this document.
While Angel Broking Pvt. Limited endeavors to update on a reasonable basis the information discussed in this material, there may be
regulatory, compliance, or other reasons that prevent us from doing so.
This document is being supplied to you solely for your information, and its contents, information or data may not be reproduced,
redistributed or passed on, directly or indirectly.
Neither Angel Broking Pvt. Limited, nor its directors, employees or affiliates shall be liable for any loss or damage that may arise from
or in connection with the use of this information.
Note: Please refer to the important ‘Stock Holding Disclosure' report on the Angel website (Research Section). Also, please refer to the
latest update on respective stocks for the disclosure status in respect of those stocks. Angel Broking Pvt. Limited and its affiliates may
have investment positions in the stocks recommended in this report.