Market Outlook
April 25, 2016
Market Cues
Domestic Indices
Chg (%)
(Pts)
(Close)
BSE Sensex
(0.2)
(42)
25,838
Indian markets are expected to open in the red tracking the SGX Nifty and weak
Nifty
(0.2)
(13)
7,899
Asian cues.
Mid Cap
0.1
9
11,019
US markets ended on a mixed note with the Dow and S&P rising half a percent while
Small Cap
0.0
2
11,079
the tech heavy Nasdaq declining half a percent. Traders continued to react to the
latest earnings with the broader markets trading lackluster.
Bankex
0.4
84
19,035
European stocks continued its decline for the second day after a three day rally
earlier in the week ahead of the ECB meet. Auto stocks took a beating after investors
Global Indices
Chg (%)
(Pts)
(Close)
feared that the emission scandal could spread to more car makers.
Dow Jones
0.1
21
18,004
Indian markets ended the week with marginal losses, reflecting the weak global cues
Nasdaq
(0.8)
(40)
4,906
as the ECB's April policy meeting offered no surprises and a slew of disappointing
FTSE
(1.1)
(71)
6,310
earnings from U.S. blue-chip companies pushed investors into a defensive mode
Nikkei
1.2
209
17,572
after recent gains on the back of a rally in commodity prices.
Hang Seng
(0.7)
(155)
21,467
News & Result Analysis
Shanghai Com
0.2
6
2,959
Result Review - Reliance Industries, HDFC Bank
Detailed analysis on Pg2
Advances / Declines
BSE
NSE
Investor’s Ready Reckoner
Advances
1,234
747
Declines
1,333
777
Key Domestic & Global Indicators
Unchanged
158
98
Stock Watch: Latest investment recommendations on 150+ stocks
Refer Pg6 onwards
Volumes (` Cr)
Top Picks
BSE
2,607
CMP
Target
Upside
Company
Sector
Rating
(`)
(`)
(%)
NSE
15,666
Amara Raja
Auto & Auto Ancillary
Buy
927
1,040
12.2
HCL Tech
IT
Buy
845
1,038
22.8
Net Inflows (` Cr)
Net
Mtd
Ytd
LIC Housing
Financials
Buy
461
592
28.4
FII
943
2,225
2,225
Bharat Electronics
Capital Goods
Buy
1,169
1,414
20.9
MFs
292
(306)
(306)
Navkar Corporation Others
Buy
188
265
41.2
More Top Picks on Pg4
Top Gainers
Price (`)
Chg (%)
Key Upcoming Events
J&K Bank
73
17.1
Previous
Consensus
Date
Region
Event Description
RCom
57
5.5
Reading
Expectations
Apr 25 US
New Home sales(thousand)
512
525
Bhushan Steel
43
5.5
Apr 26 US
Consumer Confidence
96.2
95.8
IFCI
26
5.2
Apr 27 US
FOMC Rate Decision
0.50
0.50
Corp Bank
41
4.5
Apr 27 UK
GDP (YoY)
2.10
2.00
6.(6.(
Top Losers
Price (`)
Chg (%)
Cyient
454
(5.8)
Gateway Distriparks
297
(4.7)
Crompton Greaves
58
(3.3)
Alok Ind.
5
(2.9)
JK Lakshmi Cement
349
(2.7)
As on April 22, 2016
Market Outlook
April 25, 2016
Reliance Industries (CMP - 1039, TP - 1150, Rating - Accumulate)
Reliance Industries Ltd’s reported consolidated net profit of `7,398 crore in
4QFY2016, an increase of 16% yoy as margins in the refining and petrochemical
businesses increased. Revenues for the quarter, however, were down 8.9% to
`64,569 crore led by the decline in oil prices. Benchmark crude oil prices declined
about 41% yoy to average $30.4 per barrel in 4Q.
Gross refining margin (GRM) at $10.8 a barrel was marginally higher than
estimates, down sequentially in line with the decline in the benchmark Singapore
GRMs. Strong gasoline and naphtha cracks, robust demand growth and
favourable crude markets helped boost refining margins. Petchem margins
improved sharply to 14% as against 10.6% in 4QFY2015, due to strong product
deltas and low absolute product prices. Petrochemicals EBIT jumped 35% yoy due
to strength in polymer deltas, favourable naphtha cracking economics, rebound in
MEG and PX deltas and higher volumes in the polyester chain.
Overall, Reliance provided a strong set of numbers. The launch of RJio services
remains a key trigger for the stock and we retain our Accumulate rating on the
stock with a target price of `1,150.
HDFC Bank (CMP - 1,092, TP - 1,262, Rating - Buy)
HDFC bank continued its trend of delivering consistent earnings performance
quarter after quarter and registered a net interest income growth of 24.0% yoy for
4QFY2016 which was in line with our expectations. The bank’s loan book grew by
27.1% yoy. and non-interest income for the bank grew at a pace of 11.8% yoy.
While operating expenses grew by 18.9% yoy, pre provision profits were up by
21.5% yoy. On the asset quality front, the bank continued its steady performance
in spite of the challenging macro environment with the Gross and net NPA levels
declining for the bank to 0.94% and 0.28% from 0.97% and 0.29% qoq
respectively. Overall, the bank reported earnings growth of 20.2% yoy. In light of
current macro environment, the current earnings trajectory of 20%+ yoy is strong
which in our view, justifies a premium valuation multiple. We maintain our Buy
rating on the stock with a target of `1,262.
Economic and Political News
Govt to invite bids for developing 8 waterways in a month
DGCA considers easing of import norms for aircraft
Government considering proposal to liquidate some loss-making PSUs
Corporate News
Cairn India cuts capex by a third to $100mn for FY2017
ONGC to drill 17 exploratory wells for shale gas
Reliance buys Iranian oil after 6-year hiatus
Market Outlook
April 25, 2016
Quarterly Bloomberg Brokers Consensus Estimate
Ultratech Cement Ltd - April 25, 2016
Particulars (cr)
4QFY16E 4QFY15 y-o-y (%) 3QFY16 q-o-q (%)
Net sales
6,430
6,135
4.8
5,747
11.9
EBITDA
1,222
1,310
(6.7)
1,122
8.9
EBITDA margin (%)
19.0
21.4
19.5
Net profit
628
615
2.1
509
23.4
Maruti Suzuki India Ltd - April 26, 2016
Particulars (cr)
4QFY16E 4QFY15 y-o-y (%) 3QFY16 q-o-q (%)
Net sales
14,696
13,273
10.7
14,768
(0.5)
EBITDA
2,200
2,164
1.6
2,170
1.4
EBITDA margin (%)
15.0
16.3
14.7
Net profit
1,190
1,284
(7.3)
1,019
16.7
Axis Bank Ltd - April 26, 2016
Particulars (cr)
4QFY16E 4QFY15 y-o-y (%) 3QFY16 q-o-q (%)
PAT
2,341
2,181
7.3
2,175
7.6
Market Outlook
April 25, 2016
Top Picks ★★★★★
Large Cap
Market Cap
CMP
Target
Upside
Company
Rationale
(` Cr)
(`)
(`)
(%)
To outpace battery industry growth due to better technological
Amara Raja Batteries
15,829
927
1,040
12.2
products leading to market share gains in both the automotive
OEM and replacement segments.
Uptick in defense capex by government when coupled with
Bharat Electronics
28,066
1,169
1,414
20.9
BELs strong market positioning, indicate that good times are
ahead for BEL.
The stock is trading at attractive valuations and is factoring all
HCL Tech
1,19,170
845
1,038
22.8
the bad news.
Strong visibility for a robust 20% earnings trajectory, coupled
HDFC Bank
2,76,154
1,092
1,262
15.6
with high quality of earnings on account of high quality retail
business and strategic focus on highly rated corporates.
Back on the growth trend, expect a long term growth of 14%
Infosys
2,79,725
1,214
1,347
11.0
to be a US$20bn in FY2020.
LICHF continues to grow its retail loan book at a healthy pace
with improvement in asset quality. We expect the company to
LIC Housing Finance
23,262
461
592
28.4
post a healthy loan book which is likely to reflect in a strong
earnings growth.
Huge bid pipeline of re-development works at Delhi and other
NBCC
12,043
1,004
1,089
8.5
State Governments and opportunity from Smart City, positions
NBCC to report strong growth, going forward.
Source: Company, Angel Research
Mid Cap
Market Cap
CMP
Target
Upside
Company
Rationale
(` Cr)
(`)
(`)
(%)
Favorable outlook for the AC industry to augur well for
Cooling products business which is out pacing the market
Blue Star
3,854
428
458
6.9
growth. EMPPAC division's profitability to improve once
operating environment turns around.
With a focus on the low and medium income (LMI) consumer
Dewan Housing
6,001
206
270
31.3
segment, the company has increased its presence in tier-II &
III cities where the growth opportunity is immense.
Commencement of new projects, downtrend in the interest
IL&FS Transport
2,633
80
93
16.2
rate cycle, to lead to stock re-rating
Economic recovery to have favourable impact on advertising
& circulation revenue growth. Further, the acquisition of a
Jagran Prakashan
5,544
170
189
11.4
radio business (Radio City) would also boost the company's
revenue growth.
Speedier execution and speedier sales, strong revenue visibilty
Mahindra Lifespace
1,819
443
554
25.0
in short-to-long run, attractive valuations
Massive capacity expansion along with rail advantage at ICD
Navkar Corporation
2,676
188
265
41.2
as well CFS augurs well for the company
Earnings boost on back of stable material prices and
Radico Khaitan
1,228
92
156
69.0
favourable pricing environment. Valuation discount to peers
provides additional comfort
Strong brands and distribution network would boost growth
Siyaram Silk Mills
1,023
1,092
1,354
24.0
going ahead. Stock currently trades at an inexpensive
valuation.
Source: Company, Angel Research
Market Outlook
April 25, 2016
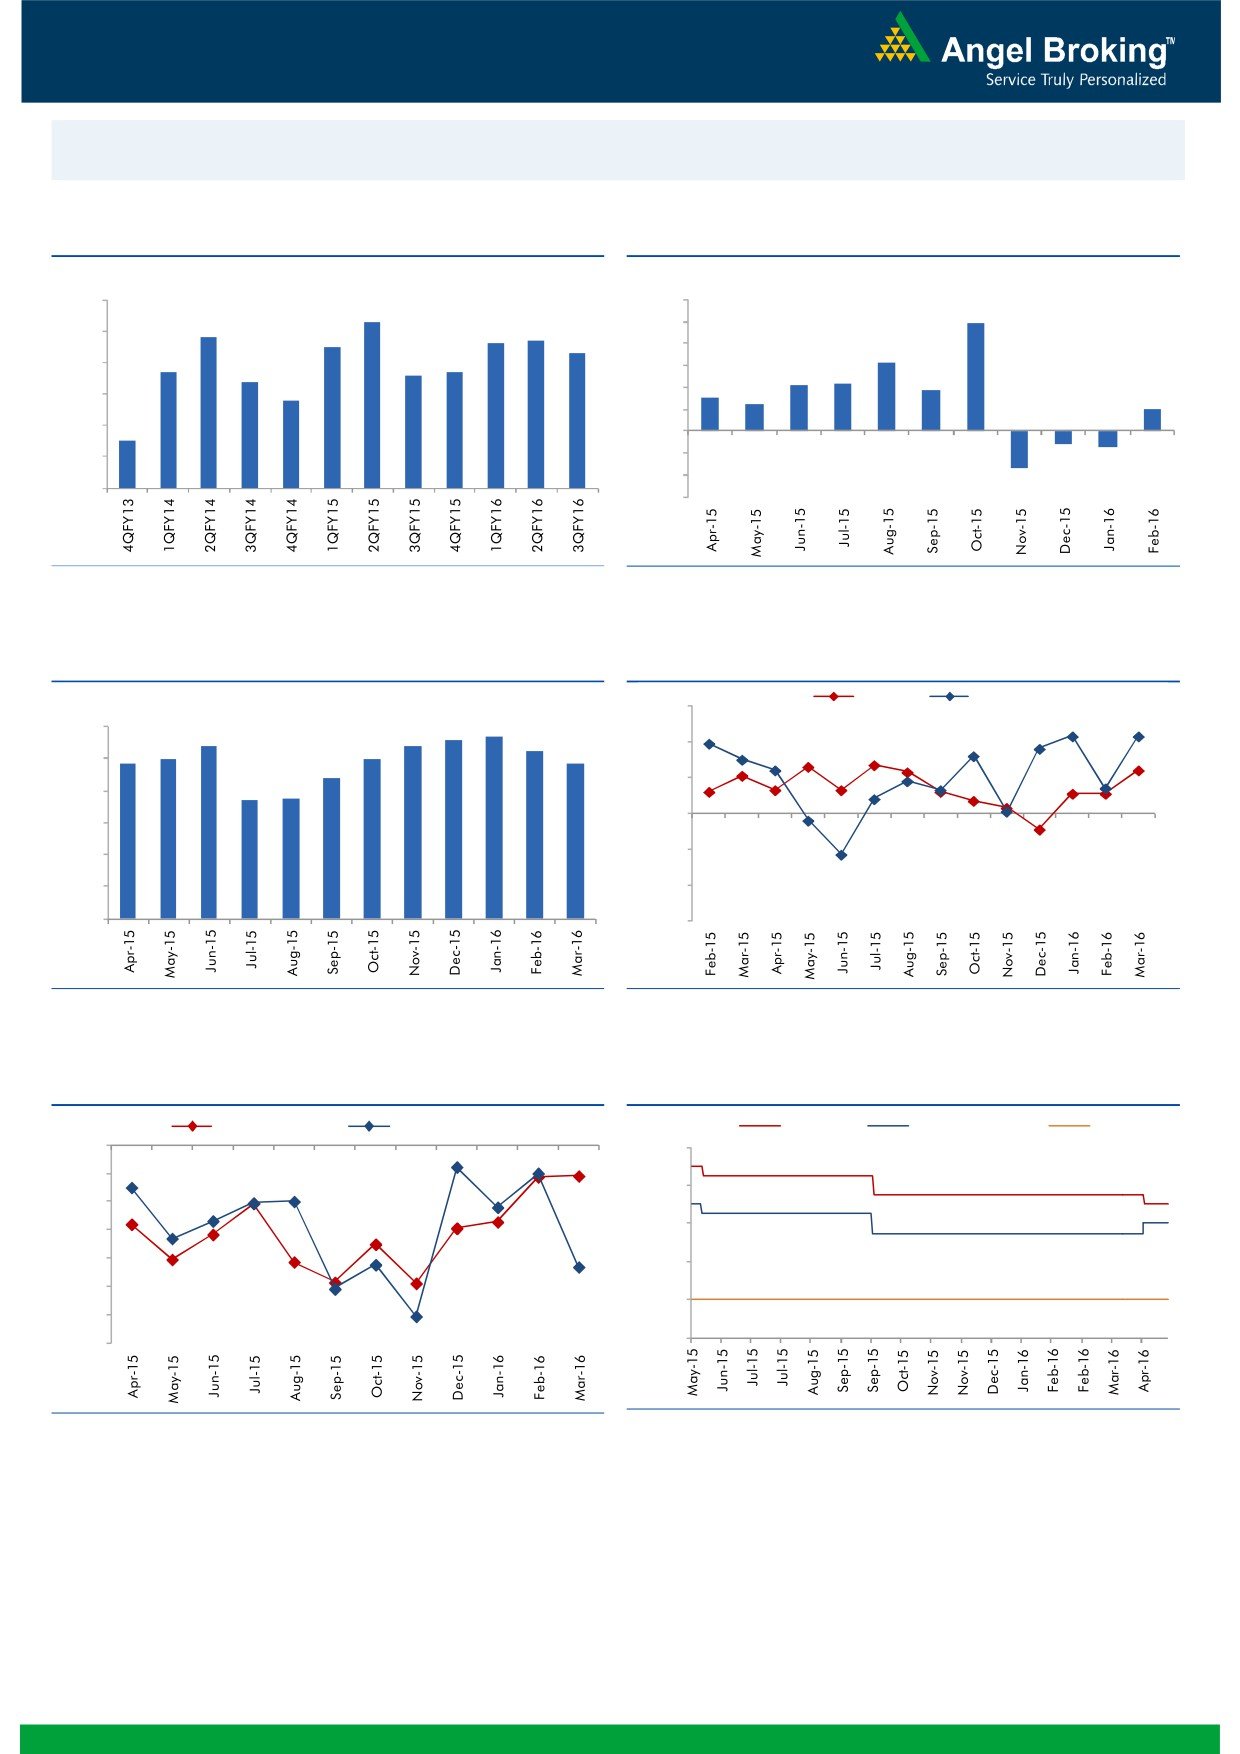
Macro watch
Exhibit 1: Quarterly GDP trends
Exhibit 2: IIP trends
(%)
(%)
9.0
12.0
8.3
9.9
7.8
7.7
10.0
8.0
7.5
7.6
7.3
8.0
6.3
6.7
6.6
6.7
7.0
6.4
6.0
4.2
4.3
3.7
5.8
3.0
4.0
2.5
6.0
2.0
2.0
5.0
4.5
-
4.0
(2.0)
(1.2)
(1.5)
(4.0)
3.0
(3.4)
(6.0)
Source: CSO, Angel Research
Source: MOSPI, Angel Research
Exhibit 3: Monthly CPI inflation trends
Exhibit 4: Manufacturing and services PMI
Mfg. PMI
Services PMI
(%)
56.0
5.6
5.7
6.0
5.4
5.4
5.3
5.0
5.0
54.0
4.9
4.8
5.0
4.4
3.7
3.7
52.0
4.0
50.0
3.0
2.0
48.0
1.0
46.0
-
44.0
Source: MOSPI, Angel Research
Source: Market, Angel Research; Note: Level above 50 indicates expansion
Exhibit 5: Exports and imports growth trends
Exhibit 6: Key policy rates
(%)
Exports yoy growth
Imports yoy growth
(%)
Repo rate
Reverse Repo rate
CRR
0.0
8.00
(5.0)
7.00
(10.0)
6.00
(15.0)
(20.0)
5.00
(25.0)
4.00
(30.0)
3.00
(35.0)
Source: Bloomberg, Angel Research
Source: RBI, Angel Research
Market Outlook
April 25, 2016
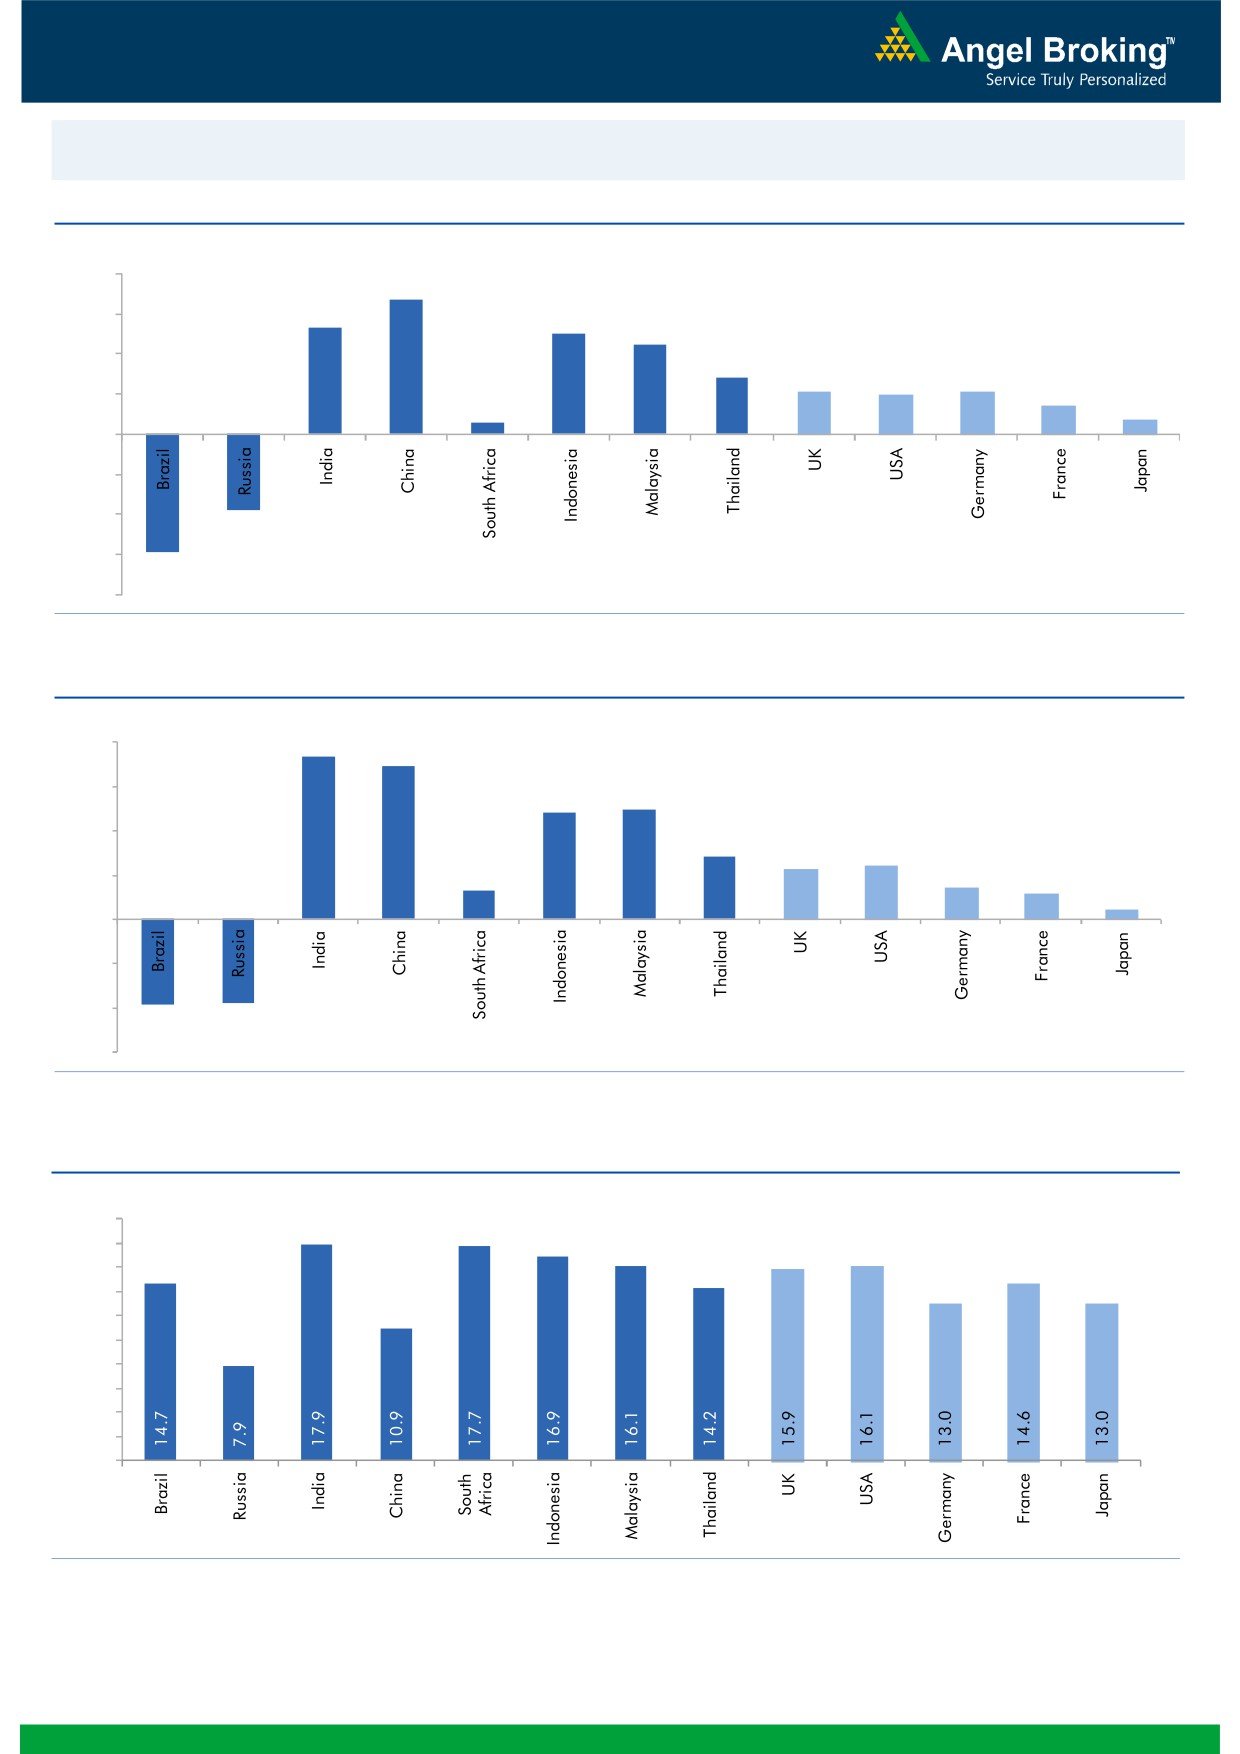
Global watch
Exhibit 1: Latest quarterly GDP Growth (%, yoy) across select developing and developed countries
(%)
8.0
6.7
6.0
5.3
5.0
4.5
4.0
2.8
2.1
2.0
2.1
1.4
2.0
0.6
0.7
-
(2.0)
(4.0)
(3.8)
(6.0)
(5.9)
(8.0)
Source: Bloomberg, Angel Research
Exhibit 2: 2015 GDP Growth projection by IMF (%, yoy) across select developing and developed countries
(%)
8.0
7.3
6.9
6.0
5.0
4.8
4.0
2.8
2.2
2.4
2.0
1.3
1.5
1.1
0.5
-
(2.0)
(4.0)
(3.8)
(3.7)
(6.0)
Source: IMF, Angel Research
Exhibit 3: One year forward P-E ratio across select developing and developed countries
(x)
20.0
18.0
16.0
14.0
12.0
10.0
8.0
6.0
4.0
2.0
-
Source: IMF, Angel Research
Market Outlook
April 25, 2016
Exhibit 4: Relative performance of indices across globe
Returns (%)
Country
Name of index
Closing price
1M
3M
1YR
Brazil
Bovespa
52,908
3.4
39.5
(2.0)
Russia
Micex
1,967
4.6
17.3
17.3
India
Nifty
7,899
5.3
4.8
(9.3)
China
Shanghai Composite
2,959
(2.0)
1.2
(29.7)
South Africa
Top 40
46,505
(2.7)
11.8
(3.1)
Mexico
Mexbol
45,613
0.3
11.8
0.4
Indonesia
LQ45
853
0.9
10.9
(10.1)
Malaysia
KLCI
1,718
(0.4)
5.4
(7.0)
Thailand
SET 50
898
1.3
16.4
(12.3)
USA
Dow Jones
18,004
2.4
13.4
(0.4)
UK
FTSE
6,310
2.0
9.3
(11.2)
Japan
Nikkei
17,572
3.4
9.7
(11.7)
Germany
DAX
10,373
4.3
8.3
(13.8)
France
CAC
4,570
3.2
8.6
(9.4)
Source: Bloomberg, Angel Research
Market Outlook
April 25, 2016
Research Team Tel: 022 - 39357800
DISCLAIMER
Angel Broking Private Limited (hereinafter referred to as “Angel”) is a registered Member of National Stock Exchange of India Limited,
Bombay Stock Exchange Limited and Metropolitan Stock Exchange of India Limited. It is also registered as a Depository Participant with
CDSL and Portfolio Manager with SEBI. It also has registration with AMFI as a Mutual Fund Distributor. Angel Broking Private Limited is
a registered entity with SEBI for Research Analyst in terms of SEBI (Research Analyst) Regulations, 2014 vide registration number
INH000000164. Angel or its associates has not been debarred/ suspended by SEBI or any other regulatory authority for accessing
/dealing in securities Market. Angel or its associates including its relatives/analyst do not hold any financial interest/beneficial
ownership of more than 1% in the company covered by Analyst. Angel or its associates/analyst has not received any compensation /
managed or co-managed public offering of securities of the company covered by Analyst during the past twelve months. Angel/analyst
has not served as an officer, director or employee of company covered by Analyst and has not been engaged in market making activity
of the company covered by Analyst.
This document is solely for the personal information of the recipient, and must not be singularly used as the basis of any investment
decision. Nothing in this document should be construed as investment or financial advice. Each recipient of this document should
make such investigations as they deem necessary to arrive at an independent evaluation of an investment in the securities of the
companies referred to in this document (including the merits and risks involved), and should consult their own advisors to determine
the merits and risks of such an investment.
Reports based on technical and derivative analysis center on studying charts of a stock's price movement, outstanding positions and
trading volume, as opposed to focusing on a company's fundamentals and, as such, may not match with a report on a company's
fundamentals.
The information in this document has been printed on the basis of publicly available information, internal data and other reliable
sources believed to be true, but we do not represent that it is accurate or complete and it should not be relied on as such, as this
document is for general guidance only. Angel Broking Pvt. Limited or any of its affiliates/ group companies shall not be in any way
responsible for any loss or damage that may arise to any person from any inadvertent error in the information contained in this report.
Angel Broking Pvt. Limited has not independently verified all the information contained within this document. Accordingly, we cannot
testify, nor make any representation or warranty, express or implied, to the accuracy, contents or data contained within this document.
While Angel Broking Pvt. Limited endeavors to update on a reasonable basis the information discussed in this material, there may be
regulatory, compliance, or other reasons that prevent us from doing so.
This document is being supplied to you solely for your information, and its contents, information or data may not be reproduced,
redistributed or passed on, directly or indirectly.
Neither Angel Broking Pvt. Limited, nor its directors, employees or affiliates shall be liable for any loss or damage that may arise from
or in connection with the use of this information.
Note: Please refer to the important ‘Stock Holding Disclosure' report on the Angel website (Research Section). Also, please refer to the
latest update on respective stocks for the disclosure status in respect of those stocks. Angel Broking Pvt. Limited and its affiliates may
have investment positions in the stocks recommended in this report.