Market Outlook
November 24, 2015
Market Cues
Domestic Indices
Chg (%)
(Pts)
(Close)
Indian markets are expected to open negatively tracking the SGX Nifty and global
BSE Sensex
(0.2)
(49)
25,819
cues.
Nifty
(0.1)
(7)
7,849
U.S. stocks closed mildly in the red as investors eyed fluctuations in oil prices and
Mid Cap
0.4
39
10,898
looked ahead to take cues from economic data (US would release its quarterly GDP
Small Cap
0.5
52
11,420
growth data today).
Bankex
0.1
20
19,491
The European markets fell as sliding metal and oil prices hurt heavyweight mining
and energy companies stocks.
Global Indices
Chg (%)
(Pts)
(Close)
Indian markets closed with marginal losses in the first trading session of the week.
Dow Jones
(0.2)
(31)
17,793
The session was volatile as the markets opened in the green and reversed initial
Nasdaq
(0.1)
(2)
5,102
gains to hit intraday low in the mid afternoon. Decline in index major ITC and metal
and mining stocks (Tata Steel, SAIL and JSW Steel) dragged the indices.
FTSE
(0.5)
(29)
6,305
Nikkei
0.1
20
19,880
News & Result Analysis
Hang Seng
(0.4)
(89)
22,666
Nestle India resumes manufacturing of Maggi noodles at Pantnagar
Shanghai Com
(0.6)
20
3,610
Indian infrastructure firms seek to diversify debt with masala bonds
Detailed analysis on Pg2
Advances / Declines
BSE
NSE
Investor’s Ready Reckoner
Advances
1,484
766
Key Domestic & Global Indicators
Declines
1,180
632
Stock Watch: Latest investment recommendations on 150+ stocks
Unchanged
178
61
Refer P4 onwards
Top Picks
Volumes (` Cr)
CMP
Target
Upside
Company
Sector
Rating
BSE
2,774
(`)
(`)
(%)
NSE
14,462
Axis Bank
Financials
Buy
463
630
36.1
HCL Tech
IT
Buy
863
1,132
31.1
ICICI Bank
Financials
Buy
265
357
34.5
Net Inflows (` Cr)
Net
Mtd
Ytd
Ashok Leyland
Automobiles
Buy
96
111
15.6
FII
(96)
(4,446)
(19,266)
Larsen & Toubro
Construction
Buy
1,369
1,646
20.2
MFs
745
4,053
54,400
More Top Picks on Pg4
Top Gainers
Price (`)
Chg (%)
Key Upcoming Events
Previous
Consensus
Vakrangee
166
9.0
Date
Region
Event Description
Reading
Expectations
RTN power
10
8.2
Nov 24
US
GDP (QoQ) (Q3)
1.5%
2.0%
Petronet
233
6.0
Nov 27
UK
GDP (QoQ) (Q3)
0.5%
-
Prestige
201
5.8
Dec 1
India
RBI Repo Rate
6.75%
-
Kec
163
5.5
Top Losers
Price (`)
Chg (%)
Jindalstel
83
(4.9)
Unitdspr
3,426
(4.6)
Max
556
(4.0)
Hindalco
74
(3.8)
Kpit
161
(3.8)
As on November 23, 2015
Market Outlook
November 24, 2015
Nestle India resumes manufacturing of Maggi noodles at
Pantnagar
Nestle India has resumed the manufacturing of magi noodles at the Pantnagar
factory in Uttarakhand, making this the fourth factory currently manufacturing the
product after Nanjungud in Karnataka, Moga in Punjab and Bicholim in Goa. In a
filing to the BSE, Suresh Narayanan, CMD, Nestle India, said, “As we welcome
back Maggi noodles we have reached out to more than 600 towns and cities,
covered around two lakh outlets and sold over 4.5 crore packs.”
The ban order imposed by the Uttarakhand government was only up to September
30 and the Bombay High Court has said aside the order passed by the FSSAI. The
company has fully complied with the directions of HC before commencing
manufacture and sales, the statement said.
Nestle is yet to commence production in Tahliwal (Himachal Pradesh) and is
engaging with the authorities and other stakeholders for the necessary clearances
it added. The company said that its suppliers, vendors, distributors, retailers,
among others are in the process of re-activating the systems and processes. The
company is also awaiting clearances in some States to sell Maggi, for which it is
engaging with the authorities. We currently have Accumulate rating on the stock.
Indian infrastructure firms seek to diversify debt with masala
bonds
Some of India's most indebted infrastructure and steel groups are considering so-
called masala bonds to diversify their funding options as local banks tighten
lending. The government last month clarified how income from the rupee-
denominated offshore bonds would be taxed, removing one uncertainty for firms
at a time when India's banks - usually the first port of call for corporates - are
reluctant to lend to sectors facing weak demand and heavy debt.
The global rupee bonds would be used to refinance costly loans or raise capital for
new projects with little currency risk. Indian companies had previously issued
bonds abroad, but these were in dollars and other currency. Issuers have not
flocked to offshore rupee bonds, largely because of the unclear tax rules. And no
privately-owned Indian firm has yet tested the market's appetite.
NTPC Ltd, the country's largest state-run power company, will start marketing road
shows on Monday. As per market sources, GMR Infrastructure - a road, power and
airport group whose net debt rose to $6.3 billion at end-September - could be one
of the first to launch a masala bond to raise cash for airports. JSW Group, which
owns JSW Steel Ltd and power producer JSW Energy Ltd, is also exploring a
masala bond for capital raising.
Masala bond issuance could hit $6 billion in the year to March 2016, or near a
fifth of external commercial borrowings from domestic companies, analysts have
estimated. Indian companies have raised 2.1 trillion rupees ($31.7 billion) via
rupee bonds in the local market so far this year, up from 1.9 trillion rupees in the
same period last year, according to Thomson Reuters data.
Market Outlook
November 24, 2015
Economic and Political News
Ratings to face stress if reforms stray; GST crucial: S&P
PSBs to coordinate with DFS, Revenue department: Jaitley
India to cut stake in state-run companies when markets improve: Jaitley
Corporate News
Portea Medical acquires MedybizPharma
Strides Shasun suspends production at Cuddalore unit block
Titan Co joins hands with HP to launch smart watches
Market Outlook
November 24, 2015
Top Picks ★★★★★
Large Cap
Market Cap
CMP
Target
Upside
Company
Rationale
(` Cr)
(`)
(`)
(%)
To outpace battery industry growth due to better technological
Amara Raja Batteries
14,891
872
1,040
19.3
products leading to market share gains in both the automotive
OEM and replacement segments.
Earnings to grow strongly given the MHCV cyclical upturn.
Ashok Leyland
27,335
96
111
15.6
Focus on exports and LCV's provides additional growth
avenue.
Healthy pace of branch expansion, backed by distribution
Axis Bank
110,023
463
630
36.1
network, will be the driving force for the bank’s retail business
and overall earnings.
The stock is trading at attractive valuations and is factoring all
HCL Tech
121,412
863
1,132
31.1
the bad news.
Strong visibility for a robust 20% earnings trajectory, coupled
HDFC Bank
268,276
1,065
1,262
18.5
with high quality of earnings on account of high quality retail
business and strategic focus on highly rated corporates.
Due to its robust franchise and capital adequacy position, the
bank is well positioned to grow by at least a few percentage
ICICI Bank
153,962
265
357
34.5
points higher than the average industry growth rate from a
structural point of view.
Back on the growth trend, expect a long term growth of 14%
Infosys
241,983
1,054
1,306
24.0
to be a US$20bn in FY2020.
Well positioned to benefit from such expected gradual
recovery in the overall domestic capex cycle, given its presence
Larsen & Toubro
127,398
1,369
1,646
20.2
across various infrastructure segments, its execution
capabilities, and its strong balance sheet.
LICHF continues to grow its retail loan book at a healthy pace
with improvement in asset quality. We expect the company to
LIC Housing Finance
23,500
466
571
22.6
post a healthy loan book which is likely to reflect in a strong
earnings growth.
Source: Company, Angel Research
Mid Cap
Market Cap
CMP
Target
Upside
Company
Rationale
(` Cr)
(`)
(`)
(%)
Government thrust on Renewable sector and strong order
Inox Wind
8,142
367
505
37.6
book would drive future growth.
Change in business focus towards high-margin chronic and
Ipca labs
9,842
780
900
15.4
lifestyle segments and increasing penetration in Europe and
US
Economic recovery to have favourable impact on advertising &
circulation revenue growth. Further, the acquisition of a radio
Jagran Prakashan
4,681
143
169
18.0
business (Radio City) would also boost the company's revenue
growth.
Strong brand & quality teaching with innovative technologies
MT Educare
529
133
169
27.2
& higher government educational spending to boost growth
Earnings boost on back of stable material prices and
Radico Khaitan
1,714
129
156
21.1
favourable pricing environment. Valuation discount to peers
provides additional comfort
Strong brands and distribution network would boost growth
Siyaram Silk Mills
886
945
1,145
21.2
going ahead. Stock currently trades at an inexpensive
valuation.
Structural shift in the Lighting industry towards LED lighting will
Surya Roshni
573
131
183
40.0
drive growth.
Source: Company, Angel Research
Market Outlook
November 24, 2015
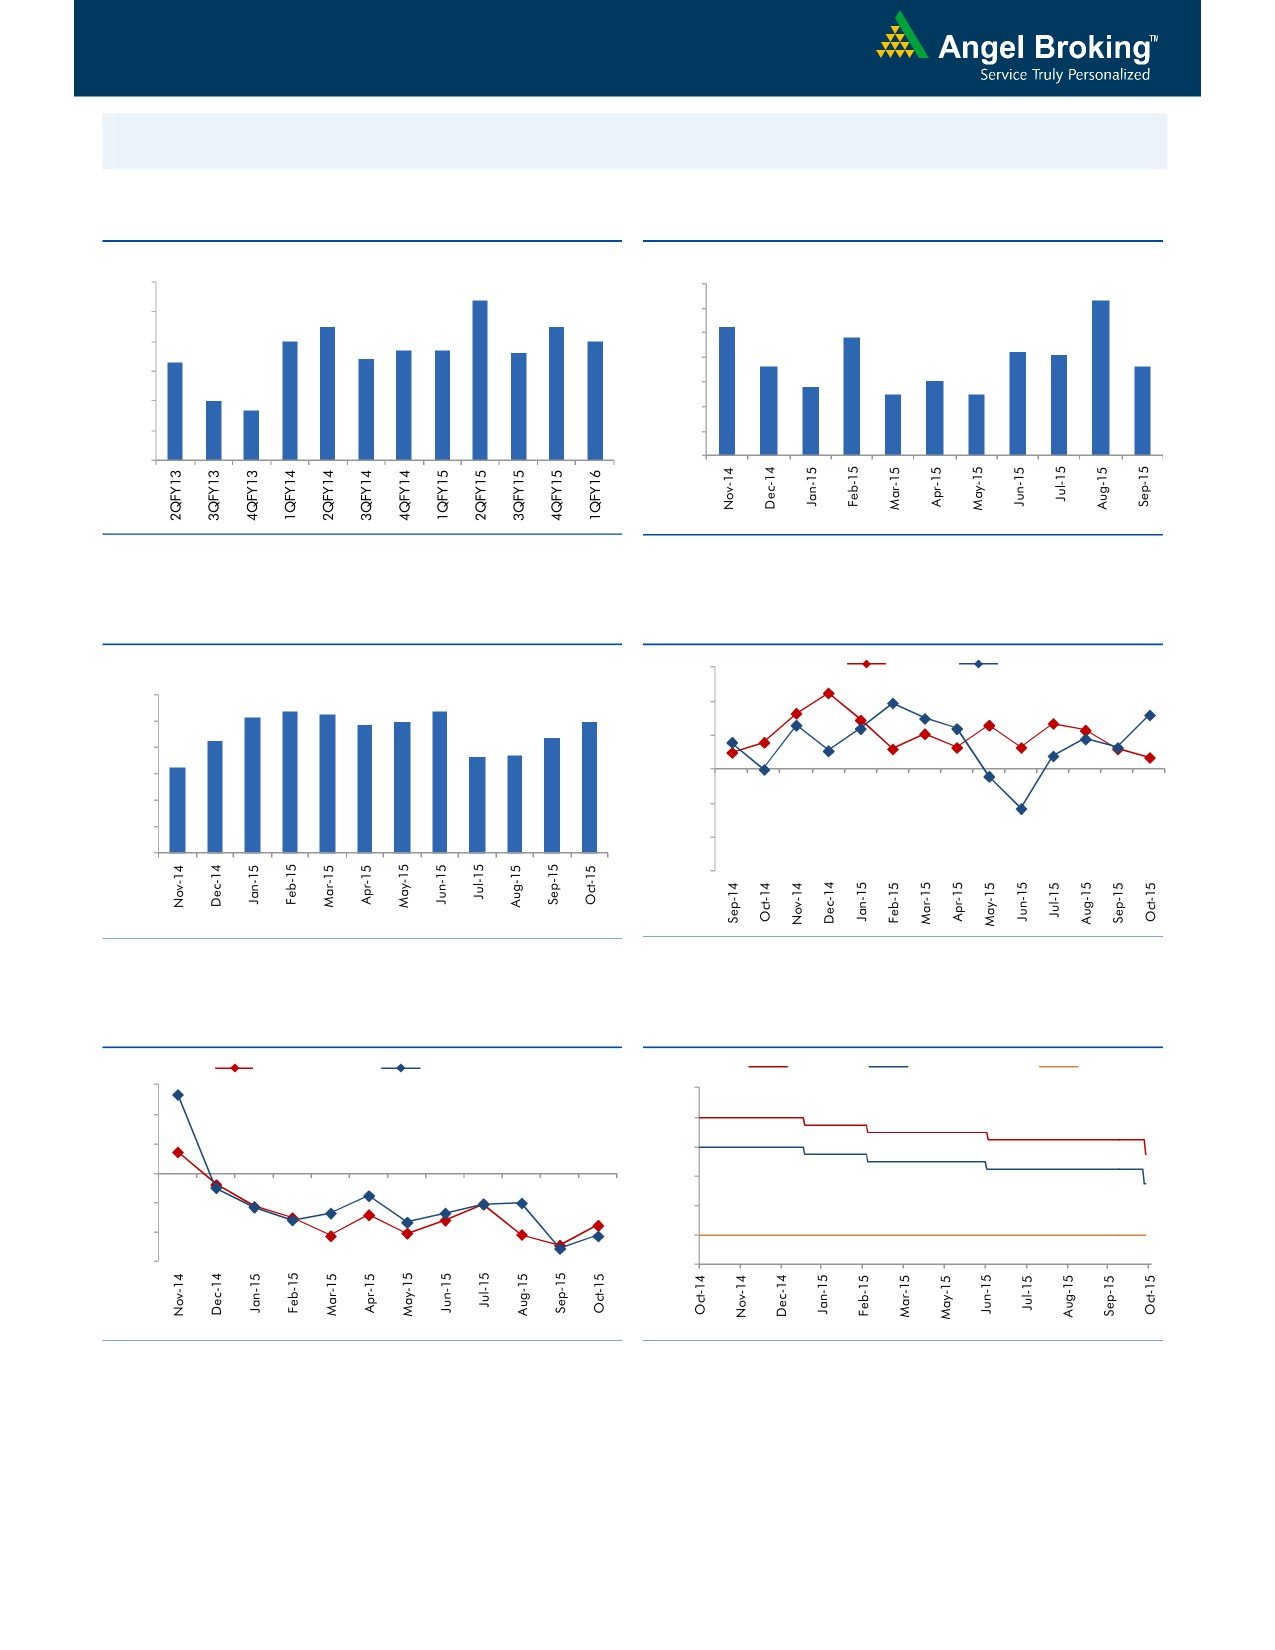
Macro watch
Exhibit 1: Quarterly GDP trends
Exhibit 2: IIP trends
(%)
(%)
9.0
8.4
7.0
6.3
8.0
7.5
7.5
6.0
5.2
7.0
7.0
4.8
6.7
6.7
5.0
4.2
7.0
6.4
6.6
4.1
6.3
3.6
3.6
4.0
6.0
2.8
3.0
2.5
2.5
5.0
3.0
4.7
5.0
2.0
4.0
1.0
3.0
-
Source: CSO, Angel Research
Source: MOSPI, Angel Research
Exhibit 3: Monthly CPI inflation trends
Exhibit 4: Manufacturing and services PMI
(%)
56.0
Mfg. PMI
Services PMI
6.0
5.2
5.4
5.3
5.4
4.9
5.0
5.0
54.0
5.0
4.3
4.4
3.7
3.7
52.0
4.0
3.3
50.0
3.0
2.0
48.0
1.0
46.0
-
44.0
Source: MOSPI, Angel Research
Source: Market, Angel Research; Note: Level above 50 indicates expansion
Exhibit 5: Exports and imports growth trends
Exhibit 6: Key policy rates
(%)
Exports yoy growth
Imports yoy growth
(%)
Repo rate
Reverse Repo rate
CRR
30.0
9.00
20.0
8.00
10.0
7.00
0.0
6.00
(10.0)
5.00
(20.0)
4.00
(30.0)
3.00
Source: Bloomberg, Angel Research
Source: RBI, Angel Research
Market Outlook
November 24, 2015
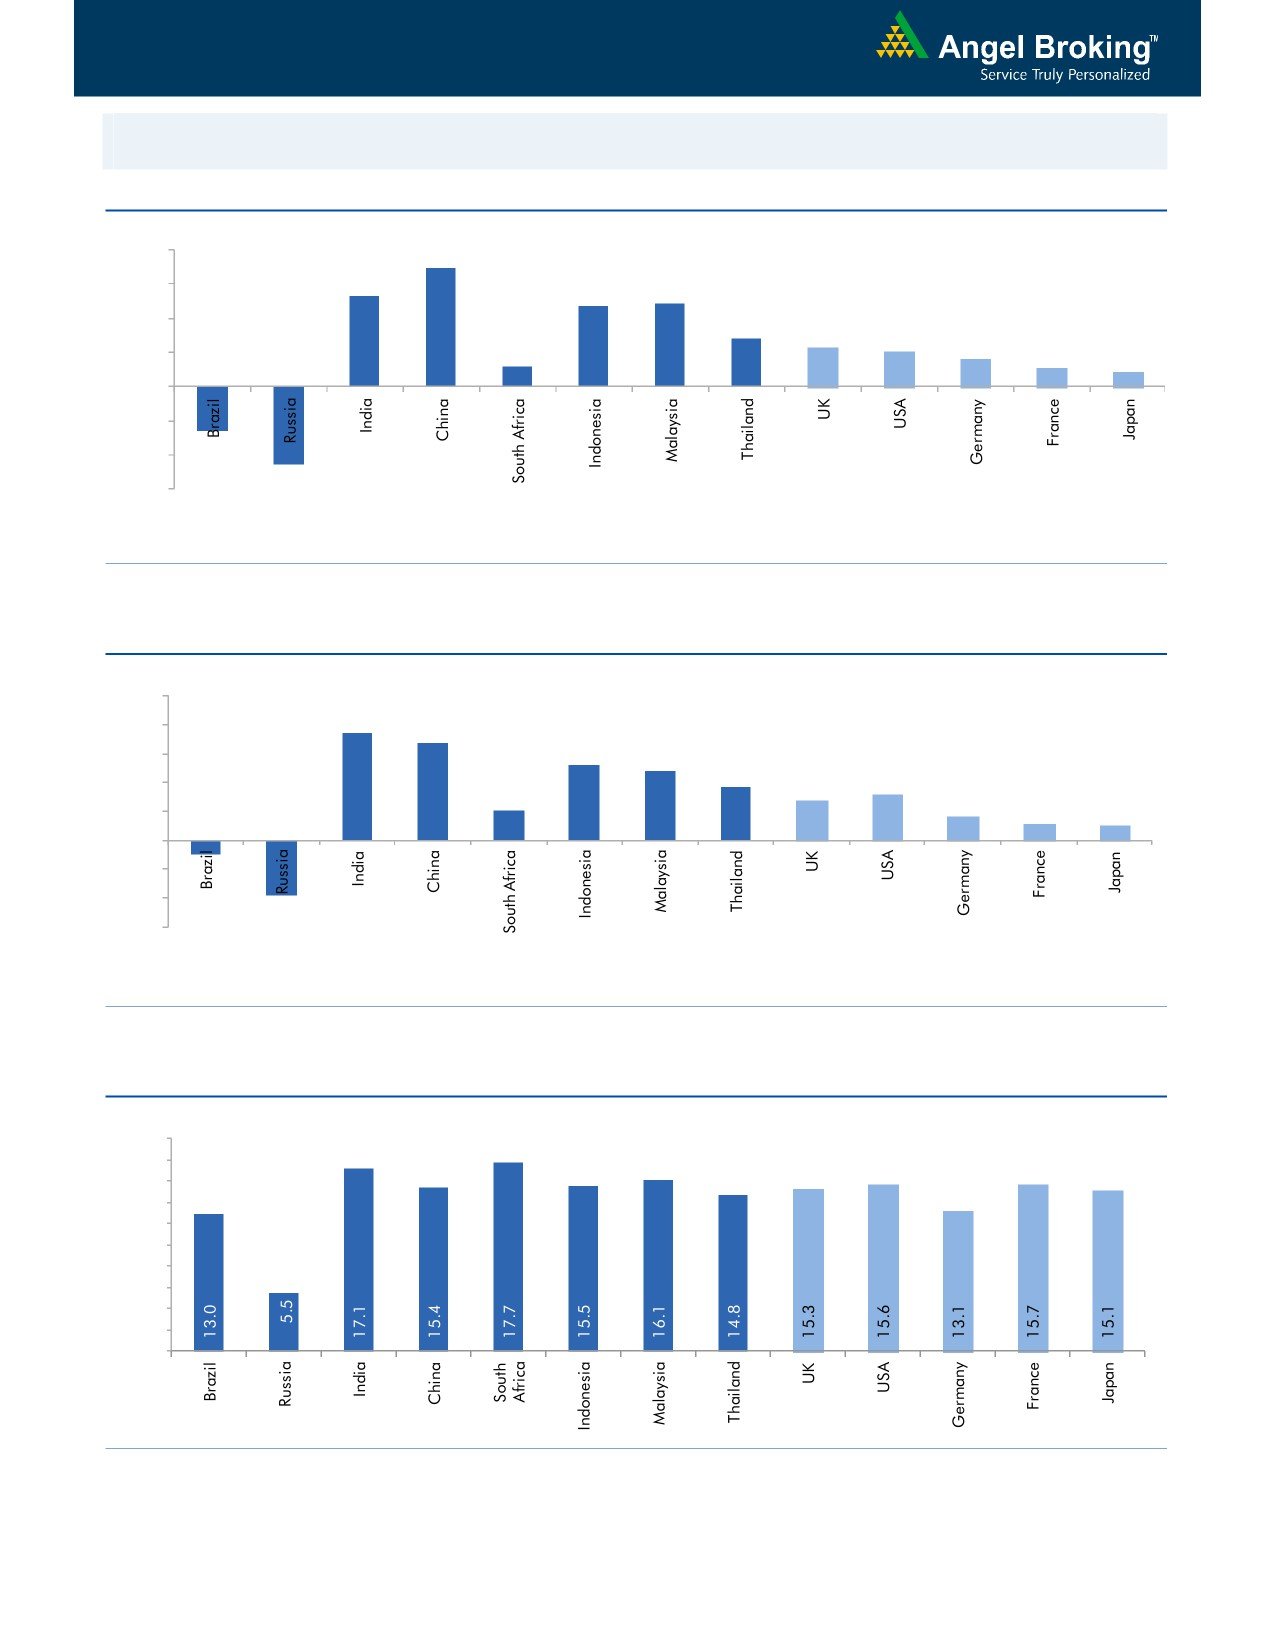
Global watch
Exhibit 1: Latest quarterly GDP Growth (%, yoy) across select developing and developed countries
(%)
8.0
6.9
6.0
5.3
4.9
4.7
4.0
2.8
2.3
2.0
1.6
2.0
1.2
1.1
0.8
(2.6)
-
(2.0)
(4.0)
(4.6)
(6.0)
Source: Bloomberg, Angel Research
Exhibit 2: 2015 GDP Growth projection by IMF (%, yoy) across select developing and developed countries
(%)
10.0
7.5
8.0
6.8
5.2
6.0
4.8
3.7
3.1
4.0
2.7
2.0
1.6
2.0
1.2
1.0
-
(2.0)
(4.0)
(1.0)
(3.8)
(6.0)
Source: IMF, Angel Research
Exhibit 3: One year forward P-E ratio across select developing and developed countries
(x)
20.0
18.0
16.0
14.0
12.0
10.0
8.0
6.0
4.0
2.0
-
Source: IMF, Angel Research
Market Outlook
November 24, 2015
Exhibit 4: Relative performance of indices across globe
Country
Name of index
Closing price
1M
1YR
Brazil
Bovespa
48,150
1.2
(14.2)
Russia
Micex
1,868
8.3
21.4
India
Nifty
7,849
(5.4)
(7.4)
China
Shanghai Composite
3,589
5.2
41.7
South Africa
Top 40
46,921
(3.9)
4.1
Mexico
Mexbol
44,779
(0.5)
0.4
Indonesia
LQ45
781
(3.0)
(12.0)
Malaysia
KLCI
1,682
(1.7)
(8.3)
Thailand
SET 50
895
(2.1)
(15.8)
USA
Dow Jones
17,793
0.8
(0.1)
UK
FTSE
6,305
(2.2)
(6.3)
Japan
Nikkei
19,845
5.4
14.3
Germany
DAX
11,092
2.8
16.0
France
CAC
4,889
(0.7)
11.9
Source: Bloomberg, Angel Research
Stock Watch
November 24, 2015
Company Name
Reco
CMP
Target
Mkt Cap
Sales ( Čcr )
OPM(%)
EPS (Č)
PER(x)
P/BV(x)
RoE(%)
EV/Sales(x)
(Č)
Price ( Č)
( Č cr )
FY16E FY17E
FY16E
FY17E
FY16E
FY17E
FY16E
FY17E
FY16E
FY17E
FY16E
FY17E
FY16E
FY17E
Agri / Agri Chemical
Rallis
Neutral
188
-
3,654
2,075
2,394
14.4
14.4
9.5
11.0
19.8
17.1
3.9
3.4
21.1
21.3
1.8
1.5
United Phosphorus
Buy
442
510
18,942
13,698
15,752
17.6
17.6
32.1
38.5
13.8
11.5
2.7
2.2
21.4
21.3
1.5
1.2
Auto & Auto Ancillary
Ashok Leyland
Buy
96
111
27,335
18,763
22,357
11.1
11.2
3.6
4.8
26.7
20.0
4.9
4.5
18.7
22.6
1.4
1.2
Bajaj Auto
Accumulate
2,523
2,672
73,013
24,115
27,600
21.3
21.0
136.8
157.2
18.4
16.1
5.9
5.1
32.2
31.5
2.6
2.2
Bharat Forge
Accumulate
885
1,016
20,603
8,013
9,250
20.0
20.3
35.2
43.1
25.1
20.5
5.0
4.1
21.6
21.8
2.7
2.3
Eicher Motors
Accumulate
16,757
19,036
45,483
15,379
16,498
15.6
16.6
473.2
574.8
35.4
29.2
13.1
9.7
36.7
33.2
2.9
2.6
Hero Motocorp
Neutral
2,637
-
52,663
28,561
31,559
14.7
14.7
151.1
163.2
17.5
16.2
6.8
5.8
38.7
35.6
1.7
1.5
Jamna Auto Industries Accumulate
234
258
4,677
1,292
1,486
9.3
9.8
12.0
15.0
19.5
15.6
4.1
3.4
20.7
21.8
3.7
3.2
L G Balakrishnan & Bros Neutral
488
-
766
1,254
1,394
11.6
11.8
35.9
41.7
13.6
11.7
1.8
1.6
13.5
13.8
0.7
0.6
Mahindra and Mahindra Accumulate
1,323
1,410
82,146
38,513
43,579
13.6
13.7
56.1
65.1
23.6
20.3
3.7
3.3
15.7
16.2
1.8
1.5
Maruti
Neutral
4,737
-
143,100
57,865
68,104
16.4
16.7
176.3
225.5
26.9
21.0
5.2
4.4
19.4
21.2
2.3
1.9
Minda Industries
Neutral
853
-
1,353
2,567
2,965
8.0
8.3
46.1
57.8
18.5
14.8
3.1
2.6
16.7
17.3
0.6
0.5
Motherson Sumi
Accumulate
286
313
37,770
39,343
45,100
8.8
9.1
10.1
12.5
28.3
22.8
9.0
7.0
35.3
34.4
1.0
0.9
Rane Brake Lining
Accumulate
338
366
268
454
511
11.1
11.4
23.8
28.1
14.2
12.0
2.0
1.8
14.2
15.3
0.7
0.7
Setco Automotive
Neutral
213
-
568
594
741
12.7
13.7
8.4
15.8
25.3
13.5
2.6
2.3
10.4
16.9
1.4
1.2
Tata Motors
Neutral
402
-
116,022
255,254
301,772
12.9
13.4
23.7
37.3
17.0
10.8
2.1
1.7
7.4
12.1
0.6
0.6
TVS Motor
Accumulate
294
313
13,979
11,845
14,040
7.2
9.0
10.4
17.4
28.3
16.9
7.1
5.4
25.1
32.0
1.2
1.0
Amara Raja Batteries
Buy
872
1,040
14,891
4,892
5,871
17.4
17.6
28.8
37.1
30.3
23.5
7.1
5.7
23.4
24.1
3.0
2.4
Exide Industries
Accumulate
149
162
12,652
6,950
7,784
14.4
14.8
6.6
7.3
22.6
20.4
2.9
2.6
12.6
12.8
1.5
1.4
Apollo Tyres
Accumulate
161
171
8,213
12,146
12,689
16.8
16.0
21.2
19.0
7.6
8.5
1.3
1.1
16.5
13.0
0.8
0.8
Ceat
Accumulate
1,054
1,119
4,263
6,041
6,597
14.1
13.7
99.5
111.9
10.6
9.4
2.1
1.7
19.6
18.5
0.9
0.7
JK Tyres
Neutral
98
-
2,215
7,446
7,669
15.2
14.0
19.6
18.4
5.0
5.3
1.3
1.0
25.2
19.5
0.7
0.6
Swaraj Engines
Neutral
924
-
1,148
552
630
14.2
14.7
44.6
54.1
20.7
17.1
4.8
4.4
23.2
25.6
1.9
1.6
Subros
Neutral
90
-
538
1,268
1,488
11.6
11.9
3.7
6.6
24.2
13.6
1.6
1.5
6.8
11.4
0.7
0.6
Indag Rubber
Neutral
199
-
522
283
329
17.0
17.2
13.0
15.4
15.3
12.9
3.3
2.8
21.8
21.6
1.6
1.3
Capital Goods
ACE
Neutral
45
-
441
660
839
4.7
8.2
1.0
3.9
44.6
11.4
1.4
1.2
3.2
11.3
0.8
0.6
BEML
Neutral
1,051
-
4,379
3,277
4,006
6.0
8.9
29.2
64.3
36.0
16.4
2.0
1.8
5.7
11.7
1.4
1.1
BGR Energy
Neutral
111
-
801
3,615
3,181
9.5
9.4
16.7
12.4
6.7
9.0
0.6
0.6
10.0
7.0
0.6
0.8
BHEL
Neutral
175
-
42,894
33,722
35,272
10.8
11.7
10.5
14.2
16.7
12.3
1.2
1.2
7.0
9.0
1.4
1.3
Stock Watch
November 24, 2015
Company Name
Reco
CMP
Target
Mkt Cap
Sales ( Čcr )
OPM(%)
EPS (Č)
PER(x)
P/BV(x)
RoE(%)
EV/Sales(x)
(Č)
Price ( Č)
( Č cr )
FY16E
FY17E
FY16E
FY17E
FY16E
FY17E
FY16E
FY17E
FY16E
FY17E
FY16E
FY17E
FY16E
FY17E
Capital Goods
Blue Star
Accumulate
358
382
3,217
3,624
4,157
5.3
6.0
9.6
14.5
37.1
24.7
6.8
5.8
18.6
25.4
1.0
0.9
Crompton Greaves
Accumulate
191
204
11,961
13,484
14,687
4.9
6.2
4.5
7.1
42.4
26.9
3.0
2.8
7.2
10.8
1.0
0.9
Inox Wind
Buy
367
505
8,142
4,980
5,943
17.0
17.5
26.6
31.6
13.8
11.6
4.1
3.0
35.0
30.0
1.8
1.4
KEC International
Neutral
163
-
4,182
8,791
9,716
6.1
6.8
5.4
8.2
30.1
19.8
3.0
2.8
10.0
14.0
0.7
0.6
Thermax
Neutral
862
-
10,266
6,413
7,525
7.4
8.5
30.5
39.3
28.3
21.9
4.4
3.8
15.0
17.0
1.6
1.3
Cement
ACC
Buy
1,344
1,630
25,224
13,151
14,757
16.4
18.3
63.9
83.4
21.0
16.1
2.7
2.5
13.3
16.1
1.8
1.5
Ambuja Cements
Buy
201
233
31,232
11,564
12,556
19.4
20.7
8.9
10.1
22.6
19.9
2.8
2.7
12.8
13.8
2.3
2.1
India Cements
Buy
81
112
2,482
4,216
4,840
18.0
19.5
4.0
9.9
20.2
8.2
0.8
0.8
4.0
9.5
0.9
0.7
JK Cement
Accumulate
650
744
4,547
3,661
4,742
10.1
15.8
18.0
61.0
36.1
10.7
2.6
2.3
7.5
22.9
1.7
1.3
J K Lakshmi Cement
Buy
344
430
4,052
2,947
3,616
16.7
19.9
11.5
27.2
29.9
12.7
2.8
2.5
9.8
20.8
1.8
1.4
Mangalam Cements
Neutral
192
-
512
1,053
1,347
10.5
13.3
8.4
26.0
22.8
7.4
1.0
0.9
4.3
12.5
0.9
0.6
Orient Cement
Accumulate
164
183
3,358
1,854
2,524
21.2
22.2
7.7
11.1
21.3
14.8
3.1
2.6
13.3
15.7
2.6
1.8
Ramco Cements
Neutral
375
-
8,917
4,036
4,545
20.8
21.3
15.1
18.8
24.8
19.9
3.0
2.7
12.9
14.3
2.7
2.3
Shree Cement^
Neutral
10,917
-
38,032
7,150
8,742
26.7
28.6
228.0
345.5
47.9
31.6
7.1
5.9
15.7
20.3
5.1
4.1
UltraTech Cement
Buy
2,800
3,282
76,839
25,021
30,023
19.1
21.6
89.0
132.0
31.5
21.2
3.6
3.2
12.2
15.9
3.1
2.6
Construction
ITNL
Neutral
90
-
2,967
7,360
8,825
34.0
35.9
1.0
5.0
90.2
18.0
0.4
0.4
0.3
1.4
3.8
3.7
KNR Constructions
Accumulate
619
673
1,740
937
1,470
14.3
14.0
33.5
38.6
18.5
16.0
2.8
2.4
15.4
15.4
1.9
1.3
Larsen & Toubro
Buy
1,369
1,646
127,398
64,148
73,241
11.5
11.7
62.0
66.0
22.1
20.7
2.3
2.1
13.4
14.0
2.2
1.9
Gujarat Pipavav Port
Neutral
167
-
8,069
629
684
51.0
52.2
6.4
5.9
26.1
28.3
3.4
3.2
15.9
12.7
12.5
11.3
MBL Infrastructures
Buy
218
285
904
2,313
2,797
12.2
14.6
19.0
20.0
11.5
10.9
1.2
1.1
11.3
10.6
1.1
1.0
Nagarjuna Const.
Neutral
78
-
4,350
7,892
8,842
8.3
9.1
2.4
5.3
32.6
14.8
1.3
1.2
4.2
8.6
0.8
0.7
PNC Infratech
Neutral
539
-
2,764
1,798
2,132
13.2
13.5
22.0
30.0
24.5
18.0
2.2
2.0
11.5
11.4
1.6
1.4
Simplex Infra
Neutral
334
-
1,654
6,241
7,008
10.4
10.7
20.0
36.0
16.7
9.3
1.4
1.2
6.8
11.1
0.8
0.7
Power Mech Projects
Neutral
608
-
3,652
1,539
1,801
12.8
12.7
59.0
72.1
10.3
8.4
2.5
2.2
18.6
16.8
2.4
2.0
Sadbhav Engineering
Neutral
315
-
2,210
3,481
4,219
10.7
10.8
8.0
12.0
39.4
26.3
1.3
1.2
10.3
13.5
0.9
0.8
National Buildings
Construction
Buy
938
1,089
7,510
7,382
9,506
7.7
8.6
39.8
54.4
23.6
17.2
3.8
3.5
26.7
29.1
0.8
0.6
Corporation
Sadbhav Infrastructure
Neutral
315
-
2,210
3,481
4,219
10.7
10.8
8.0
12.0
39.4
26.3
1.3
1.2
10.3
13.5
0.9
0.8
Project
Financials
Allahabad Bank
Neutral
74
-
4,438
8,332
9,259
2.8
2.8
21.0
25.6
3.5
2.9
0.4
0.3
9.8
10.9
-
-
Axis Bank
Buy
463
630
110,023
26,473
31,527
3.5
3.6
35.7
43.5
13.0
10.6
2.5
2.2
17.9
18.9
-
-
Stock Watch
November 24, 2015
Company Name
Reco
CMP
Target
Mkt Cap
Sales ( Čcr )
OPM(%)
EPS (Č)
PER(x)
P/BV(x)
RoE(%)
EV/Sales(x)
(Č)
Price ( Č)
( Č cr )
FY16E
FY17E
FY16E
FY17E
FY16E
FY17E
FY16E
FY17E
FY16E
FY17E
FY16E
FY17E
FY16E
FY17E
Financials
Bank of Baroda
Neutral
170
-
39,125
19,105
21,474
2.0
2.0
19.1
24.8
8.9
6.9
0.9
0.8
10.2
12.1
-
-
Bank of India
Neutral
128
-
10,164
15,972
17,271
1.9
2.0
15.3
33.4
8.4
3.9
0.4
0.3
3.6
7.6
-
-
Canara Bank
Neutral
268
-
14,571
15,251
16,725
2.0
2.0
59.3
68.6
4.5
3.9
0.5
0.4
10.1
10.7
-
-
Dena Bank
Neutral
42
-
2,354
3,440
3,840
2.1
2.3
7.3
10.0
5.8
4.2
0.4
0.4
6.1
7.9
-
-
Federal Bank
Neutral
57
-
9,775
3,477
3,999
3.0
3.0
5.0
6.2
11.4
9.1
1.1
1.0
10.6
11.9
-
-
HDFC
Neutral
1,194
-
188,343
10,358
11,852
3.3
3.3
41.1
47.0
29.1
25.4
5.5
5.0
24.7
24.9
-
-
HDFC Bank
Buy
1,065
1,262
268,276
38,309
47,302
4.3
4.3
49.3
61.1
21.6
17.5
3.7
3.2
18.5
19.7
-
-
ICICI Bank
Buy
265
357
153,962
35,168
40,517
3.4
3.4
21.4
25.2
12.4
10.5
2.1
1.8
14.7
15.2
-
-
IDBI Bank
Neutral
84
-
13,417
9,625
10,455
1.8
1.8
8.5
14.2
9.8
5.9
0.6
0.6
5.9
9.3
-
-
Indian Bank
Neutral
126
-
6,054
6,160
6,858
2.5
2.5
24.5
29.8
5.2
4.2
0.4
0.4
7.7
8.6
-
-
LIC Housing Finance
Buy
466
571
23,500
3,101
3,745
2.5
2.5
33.0
40.2
14.1
11.6
2.6
2.2
19.7
20.5
-
-
Oriental Bank
Neutral
148
-
4,429
7,643
8,373
2.4
2.4
37.2
45.4
4.0
3.3
0.4
0.3
8.2
9.4
-
-
Punjab Natl.Bank
Neutral
139
-
27,333
23,638
26,557
2.8
2.8
17.9
27.2
7.8
5.1
0.8
0.6
8.5
12.0
-
-
South Ind.Bank
Neutral
20
-
2,707
1,965
2,185
2.5
2.5
2.5
3.3
8.1
6.1
0.8
0.7
9.5
11.7
-
-
St Bk of India
Buy
243
283
188,558
82,520
93,299
2.7
2.8
20.0
24.5
12.1
9.9
1.3
1.2
11.5
12.8
-
-
Union Bank
Neutral
161
-
11,037
12,646
14,129
2.3
2.4
31.0
39.1
5.2
4.1
0.6
0.5
9.8
11.4
-
-
Vijaya Bank
Neutral
34
-
2,925
3,536
3,827
1.9
1.9
5.5
6.7
6.2
5.1
0.5
0.5
7.8
8.8
-
-
Yes Bank
Buy
740
914
30,987
7,228
9,043
3.2
3.3
57.7
69.4
12.8
10.7
2.3
1.9
19.1
19.6
-
-
FMCG
Asian Paints
Neutral
851
-
81,604
16,553
19,160
16.0
16.2
17.7
21.5
48.1
39.6
12.8
11.5
29.4
31.2
4.8
4.1
Britannia
Neutral
2,980
-
35,753
8,065
9,395
9.6
10.2
47.2
65.5
63.1
45.5
21.0
19.8
38.3
41.2
4.3
3.7
Colgate
Neutral
959
-
26,085
4,836
5,490
19.5
19.7
48.5
53.2
19.8
18.0
14.5
12.6
99.8
97.5
5.3
4.7
Dabur India
Neutral
275
-
48,260
9,370
10,265
17.1
17.2
7.3
8.1
37.5
33.9
11.3
9.2
33.7
30.6
5.1
4.6
GlaxoSmith Con*
Neutral
5,906
-
24,836
4,919
5,742
17.2
17.4
168.3
191.2
35.1
30.9
10.0
8.5
28.8
28.9
4.6
3.9
Godrej Consumer
Neutral
1,232
-
41,942
10,168
12,886
16.1
16.1
32.1
38.4
38.4
32.1
7.8
7.2
19.7
21.0
4.2
3.3
HUL
Neutral
792
-
171,433
34,940
38,957
17.5
17.7
20.8
24.7
38.1
32.1
42.4
33.9
110.5
114.2
4.7
4.2
ITC
Buy
337
409
270,814
41,068
45,068
37.8
37.4
13.9
15.9
24.2
21.2
8.1
7.2
34.1
33.8
6.2
5.6
Marico
Neutral
429
-
27,681
6,551
7,766
15.7
16.0
10.4
12.5
41.3
34.3
12.0
10.0
33.2
32.4
4.2
3.5
Nestle*
Accumulate
6,142
6,646
59,216
11,291
12,847
22.2
22.3
158.9
184.6
38.7
33.3
20.2
18.2
55.0
57.3
5.1
4.4
Tata Global
Accumulate
133
144
8,375
8,635
9,072
9.8
9.9
6.5
7.6
20.4
17.5
2.0
2.0
6.8
7.4
0.9
0.9
Stock Watch
November 24, 2015
Company Name
Reco
CMP
Target
Mkt Cap
Sales ( Čcr )
OPM(%)
EPS (Č)
PER(x)
P/BV(x)
RoE(%)
EV/Sales(x)
(Č)
Price ( Č)
( Č cr )
FY16E FY17E
FY16E
FY17E
FY16E
FY17E
FY16E
FY17E
FY16E
FY17E
FY16E
FY17E
FY16E
FY17E
IT
HCL Tech^
Buy
863
1,132
121,412
42,038
47,503
23.2
23.5
55.8
62.9
15.5
13.7
3.6
2.7
23.0
19.8
2.5
2.0
Infosys
Buy
1,054
1,306
241,983
60,250
66,999
28.0
28.0
58.3
63.7
18.1
16.5
3.8
3.3
20.9
19.7
3.3
2.8
TCS
Buy
2,392
3,165
471,267
111,274
126,852
28.4
28.7
125.4
143.9
19.1
16.6
7.5
7.0
39.9
42.2
3.8
3.3
Tech Mahindra
Buy
538
646
51,723
25,566
28,890
16.0
17.0
26.3
31.9
20.4
16.9
3.7
3.1
17.9
18.6
1.8
1.5
Wipro
Buy
570
719
140,858
52,414
58,704
23.7
23.8
38.4
42.3
14.9
13.5
2.9
2.6
19.5
18.0
2.3
1.9
Media
D B Corp
Accumulate
325
356
5,964
2,241
2,495
27.8
27.9
21.8
25.6
14.9
12.7
3.9
3.4
26.7
28.5
2.6
2.3
HT Media
Neutral
78
-
1,824
2,495
2,603
11.2
11.2
7.3
8.6
10.7
9.1
0.9
0.8
7.4
8.1
0.2
0.2
Jagran Prakashan
Buy
143
169
4,681
2,170
2,355
27.0
27.6
12.8
10.3
11.2
13.9
3.1
2.9
21.8
19.4
1.9
1.6
Sun TV Network
Neutral
385
-
15,153
2,779
3,196
70.2
70.5
22.8
27.3
16.9
14.1
4.2
3.8
26.7
28.3
5.2
4.5
Hindustan Media
Neutral
283
-
2,080
920
1,031
20.0
20.0
19.2
20.9
14.8
13.6
2.4
2.1
16.4
15.3
1.8
1.6
Ventures
Metals & Mining
Coal India
Accumulate
333
380
210,082
76,167
84,130
19.9
22.3
22.4
25.8
14.8
12.9
5.4
5.2
35.5
41.0
2.1
1.9
Hind. Zinc
Buy
142
175
60,126
14,641
14,026
50.4
50.4
17.7
16.0
8.1
8.9
1.2
1.1
16.2
13.2
1.7
1.6
Hindalco
Neutral
74
-
15,353
104,356
111,186
8.7
9.5
6.7
11.1
11.1
6.7
0.4
0.4
3.5
5.9
0.7
0.6
JSW Steel
Neutral
890
-
21,516
42,308
45,147
16.4
20.7
(10.3)
49.5
18.0
1.0
1.0
(1.0)
5.6
1.6
1.5
NMDC
Neutral
93
-
36,693
8,237
10,893
46.6
44.5
10.0
11.7
9.3
7.9
1.0
0.9
12.5
13.0
4.2
3.2
SAIL
Neutral
44
-
18,172
45,915
53,954
7.2
10.5
1.5
4.4
29.2
10.1
0.4
0.4
2.3
4.1
1.0
0.9
Vedanta
Neutral
90
-
26,816
71,445
81,910
26.2
26.3
12.9
19.2
7.0
4.7
0.5
0.4
7.2
8.9
0.8
0.6
Tata Steel
Neutral
224
-
21,794
126,760
137,307
8.9
11.3
6.4
23.1
35.3
9.7
0.7
0.7
2.0
7.1
0.8
0.7
Oil & Gas
Cairn India
Neutral
138
-
25,835
11,323
12,490
49.4
51.0
20.7
20.7
6.7
6.7
0.4
0.4
6.4
6.1
1.4
0.7
GAIL
Neutral
358
-
45,469
64,856
70,933
9.1
9.6
24.0
28.9
15.0
12.4
1.3
1.2
8.8
9.6
0.9
0.8
ONGC
Neutral
232
-
198,231
154,564
167,321
36.8
37.4
28.6
32.5
8.1
7.1
1.0
1.0
12.7
13.5
1.5
1.4
Petronet LNG
Neutral
233
-
17,501
29,691
31,188
5.8
6.2
12.8
13.4
18.3
17.4
2.7
2.4
15.8
14.8
0.7
0.6
Indian Oil Corp
Accumulate
412
455
100,020
359,607
402,760
5.9
6.1
42.5
48.7
9.7
8.5
1.3
1.2
14.1
14.4
0.4
0.3
Reliance Industries
Accumulate
952
1,050
308,331
304,775
344,392
12.6
13.4
91.3
102.6
10.4
9.3
1.2
1.1
11.8
12.0
0.9
0.8
Pharmaceuticals
Alembic Pharma
Neutral
680
-
12,820
2,658
3,112
24.1
20.2
24.6
23.9
27.6
28.5
9.9
7.6
42.5
30.2
4.8
4.1
Aurobindo Pharma
Neutral
847
-
49,473
14,923
17,162
23.0
23.0
38.2
43.6
22.2
19.4
6.8
5.1
36.0
30.2
3.7
3.1
Aventis*
Neutral
4,527
-
10,425
2,082
2,371
17.4
20.8
118.2
151.5
38.3
29.9
5.6
4.5
19.9
25.5
4.7
3.9
Cadila Healthcare
Neutral
424
-
43,402
10,224
11,840
21.0
22.0
14.6
17.6
29.0
24.1
8.0
6.2
30.8
29.0
4.3
3.6
Cipla
Neutral
640
-
51,435
14,211
16,611
20.6
19.0
27.0
28.9
23.7
22.2
4.0
3.5
18.4
16.8
3.6
3.0
Stock Watch
November 24, 2015
Company Name
Reco
CMP
Target
Mkt Cap
Sales ( Čcr )
OPM(%)
EPS (Č)
PER(x)
P/BV(x)
RoE(%)
EV/Sales(x)
(Č)
Price ( Č)
( Č cr )
FY16E FY17E
FY16E
FY17E
FY16E
FY17E
FY16E
FY17E
FY16E
FY17E
FY16E
FY17E
FY16E
FY17E
Pharmaceuticals
Dr Reddy's
Buy
3,401
3,933
57,992
16,838
19,575
25.0
23.1
167.5
178.8
20.3
19.0
4.3
3.6
23.1
20.4
3.4
2.9
Dishman Pharma
Neutral
328
-
2,644
1,733
1,906
21.5
21.5
17.0
19.9
19.3
16.5
1.9
1.8
10.5
11.2
2.0
1.7
GSK Pharma*
Neutral
3,218
-
27,259
2,870
3,158
20.0
22.1
59.5
68.3
54.1
47.1
16.0
16.4
28.5
34.3
9.0
8.2
Indoco Remedies
Neutral
307
-
2,828
1,033
1,199
15.9
18.2
9.4
13.6
32.7
22.6
4.8
4.1
15.7
19.7
2.8
2.4
Ipca labs
Buy
780
900
9,842
3,363
3,909
12.9
18.6
13.4
28.0
58.2
27.9
7.6
6.1
7.4
14.0
3.2
2.8
Lupin
Neutral
1,840
-
82,827
13,092
16,561
25.0
27.0
50.4
68.3
36.5
26.9
7.5
6.0
22.8
24.7
6.0
4.7
Sun Pharma
Buy
719
950
172,951
28,163
32,610
25.8
30.7
17.4
26.9
41.3
26.7
3.9
3.4
13.0
16.6
5.6
4.6
Power
Tata Power
Neutral
67
-
18,107
35,923
37,402
22.6
22.8
4.1
5.2
16.5
13.0
1.3
1.2
7.5
9.3
1.5
1.3
NTPC
Buy
133
157
109,582
87,064
98,846
23.5
23.5
11.7
13.2
11.4
10.1
1.3
1.2
11.4
12.1
2.3
2.0
Power Grid
Buy
131
170
68,743
20,702
23,361
86.7
86.4
12.1
13.2
10.9
10.0
1.6
1.4
15.6
15.1
8.2
7.7
Telecom
Bharti Airtel
Neutral
339
-
135,372
101,748
109,191
32.1
31.7
12.0
12.5
28.2
27.1
1.9
1.8
6.9
6.7
2.0
1.8
Idea Cellular
Neutral
139
-
50,197
34,282
36,941
32.0
31.5
5.9
6.2
23.6
22.5
2.2
2.0
9.9
9.3
2.0
1.9
zOthers
Abbott India
Neutral
5,220
-
11,091
2,715
3,153
14.5
14.1
134.3
152.2
38.9
34.3
9.7
8.0
27.4
25.6
3.8
3.2
Bajaj Electricals
Buy
225
341
2,265
4,719
5,287
5.2
5.8
8.6
12.7
26.2
17.7
3.0
2.6
11.4
14.8
0.5
0.4
Finolex Cables
Neutral
266
-
4,066
2,520
2,883
12.2
12.0
12.7
14.2
21.0
18.7
2.9
2.5
13.6
13.5
1.4
1.1
Goodyear India*
Accumulate
561
622
1,295
1,888
1,680
12.1
11.9
62.2
56.6
9.0
9.9
2.1
1.8
25.9
19.7
0.5
0.5
Hitachi
Neutral
1,357
-
3,690
1,779
2,081
7.8
8.8
21.8
33.4
62.2
40.6
10.1
8.1
17.4
22.1
2.1
1.8
Jyothy Laboratories
Neutral
302
-
5,467
1,620
1,847
11.5
11.5
7.3
8.5
41.4
35.6
5.4
5.0
13.3
14.4
3.2
2.8
MRF
Buy
39,194
45,575
16,623
20,316
14,488
21.4
21.1
5,488.0
3,798.0
7.1
10.3
2.4
2.0
41.1
21.2
0.8
1.0
Page Industries
Neutral
12,850
-
14,333
1,929
2,450
19.8
20.1
229.9
299.0
55.9
43.0
24.7
17.1
52.1
47.1
7.5
5.9
Relaxo Footwears
Neutral
500
-
5,996
1,767
2,152
12.3
12.5
19.3
25.1
26.0
19.9
6.4
4.9
27.7
27.8
3.4
2.8
Siyaram Silk Mills
Buy
945
1,145
886
1,636
1,815
11.5
11.5
89.9
104.1
10.5
9.1
1.7
1.5
17.9
17.8
0.7
0.6
Styrolution ABS India*
Neutral
729
-
1,282
1,271
1,440
8.6
9.2
32.0
41.1
22.8
17.8
2.3
2.1
10.7
12.4
1.0
0.8
Tree House
Buy
220
314
929
256
315
57.2
57.5
16.5
21.0
13.3
10.5
1.3
1.2
9.6
10.9
3.7
3.2
TVS Srichakra
Buy
2,756
3,240
2,110
2,101
2,338
15.7
15.0
248.6
270.0
11.1
10.2
4.8
3.5
43.6
34.0
1.0
0.9
HSIL
Neutral
299
-
2,163
2,123
2,384
16.1
16.5
15.0
18.9
19.9
15.9
1.5
1.4
8.0
9.4
1.4
1.2
Kirloskar Engines India
Neutral
276
-
3,991
2,471
2,826
8.8
10.4
9.1
13.3
30.2
20.7
2.9
2.7
9.7
13.4
1.3
1.1
Ltd
M M Forgings
Buy
491
614
592
511
615
21.7
21.6
43.1
55.8
11.4
8.8
2.1
1.7
19.9
21.2
1.4
1.0
Banco Products (India)
Neutral
129
-
919
1,208
1,353
11.0
12.3
10.8
14.5
11.9
8.9
1.4
1.2
11.9
14.5
0.7
0.6
Stock Watch
November 24, 2015
Company Name
Reco
CMP
Target Mkt Cap
Sales ( Čcr )
OPM(%)
EPS (Č)
PER(x)
P/BV(x)
RoE(%)
EV/Sales(x)
(Č)
Price ( Č)
( Č cr )
FY16E FY17E FY16E FY17E FY16E FY17E FY16E FY17E FY16E FY17E FY16E FY17E FY16E FY17E
zOthers
Competent Automobiles Neutral
139
-
85
1,040
1,137
3.2
3.1
25.7
28.0
5.4
5.0
0.8
0.7
15.0
14.3
0.1
0.1
Nilkamal
Neutral
995
-
1,485
1,910
2,083
10.5
10.3
63.3
69.2
15.7
14.4
2.6
2.2
17.6
16.5
0.8
0.7
Visaka Industries
Buy
118
144
187
1,086
1,197
9.9
10.3
21.5
28.8
5.5
4.1
0.5
0.5
9.6
11.6
0.4
0.3
Transport Corporation of
Neutral
301
-
2,291
2,830
3,350
8.8
9.0
14.4
18.3
21.0
16.5
3.2
2.8
15.4
17.1
0.9
0.8
India
Elecon Engineering
Neutral
86
-
941
1,369
1,533
13.7
14.9
3.3
6.1
26.0
14.3
1.7
1.6
6.6
11.4
1.0
0.9
Surya Roshni
Buy
131
183
573
2,992
3,223
8.1
8.4
14.7
18.3
8.9
7.1
0.8
0.8
9.7
11.0
0.5
0.4
MT Educare
Buy
133
169
529
286
366
18.3
17.7
7.7
9.4
17.2
14.2
3.6
3.2
20.2
21.1
1.8
1.3
Radico Khaitan
Buy
129
156
1,714
1,565
1,687
12.2
13.0
5.7
7.1
22.6
18.2
1.9
1.7
8.3
9.6
1.6
1.4
Garware Wall Ropes
Buy
349
423
765
861
967
10.9
10.9
24.0
28.2
14.6
12.4
2.1
1.8
14.6
14.9
0.9
0.8
Wonderla Holidays
Neutral
385
-
2,176
206
308
44.0
43.6
9.0
12.9
42.8
29.9
5.8
5.3
13.7
17.8
10.5
7.0
Linc Pen & Plastics
Accumulate
170
185
251
340
371
8.3
8.9
10.8
13.2
15.7
12.9
2.5
2.2
16.0
17.1
0.8
0.7
The Byke Hospitality
Accumulate
165
181
662
222
287
20.5
20.5
5.6
7.6
29.3
21.9
5.5
4.5
18.9
20.8
3.0
2.3
Interglobe Aviation
Neutral
1,047
-
37,733
17,022
21,122
20.7
14.5
63.9
53.7
16.4
19.5
24.6
20.1
149.9
103.2
2.2
1.8
Coffee Day Enterprises
Neutral
264
-
5,439
2,692
2,964
17.0
18.6
0.1
4.7
2,209.1
55.7
3.2
3.1
0.2
5.5
2.4
2.2
Ltd
Navneet Education
Accumulate
85
97
428
998
1,062
24.1
24.0
5.8
6.1
14.9
14.0
3.3
2.9
22.0
20.6
0.5
0.5
Source: Company, Angel Research; Note: *December year end; #September year end; &October year end; Price as on November 23, 2015
Market Outlook
November 24, 2015
Research Team Tel: 022 - 39357800
DISCLAIMER
Angel Broking Private Limited (hereinafter referred to as “Angel”) is a registered Member of National Stock Exchange of India Limited,
Bombay Stock Exchange Limited and Metropolitian Stock Exchange of India Limited. It is also registered as a Depository Participant with
CDSL and Portfolio Manager with SEBI. It also has registration with AMFI as a Mutual Fund Distributor. Angel Broking Private Limited is a
registered entity with SEBI for Research Analyst in terms of SEBI (Research Analyst) Regulations, 2014 vide registration number
INH000000164. Angel or its associates has not been debarred/ suspended by SEBI or any other regulatory authority for accessing
/dealing in securities Market. Angel or its associates including its relatives/analyst do not hold any financial interest/beneficial ownership
of more than 1% in the company covered by Analyst. Angel or its associates/analyst has not received any compensation / managed or co
-managed public offering of securities of the company covered by Analyst during the past twelve months. Angel/analyst has not served as
an officer, director or employee of company covered by Analyst and has not been engaged in market making activity of the company
covered by Analyst.
This document is solely for the personal information of the recipient, and must not be singularly used as the basis of any investment
decision. Nothing in this document should be construed as investment or financial advice. Each recipient of this document should make
such investigations as they deem necessary to arrive at an independent evaluation of an investment in the securities of the companies
referred to in this document (including the merits and risks involved), and should consult their own advisors to determine the merits and
risks of such an investment.
Reports based on technical and derivative analysis center on studying charts of a stock's price movement, outstanding positions and
trading volume, as opposed to focusing on a company's fundamentals and, as such, may not match with a report on a company's
fundamentals.
The information in this document has been printed on the basis of publicly available information, internal data and other reliable sources
believed to be true, but we do not represent that it is accurate or complete and it should not be relied on as such, as this document is for
general guidance only. Angel Broking Pvt. Limited or any of its affiliates/ group companies shall not be in any way responsible for any
loss or damage that may arise to any person from any inadvertent error in the information contained in this report. Angel Broking Pvt.
Limited has not independently verified all the information contained within this document. Accordingly, we cannot testify, nor make any
representation or warranty, express or implied, to the accuracy, contents or data contained within this document. While Angel Broking
Pvt. Limited endeavors to update on a reasonable basis the information discussed in this material, there may be regulatory, compliance,
or other reasons that prevent us from doing so.
This document is being supplied to you solely for your information, and its contents, information or data may not be reproduced,
redistributed or passed on, directly or indirectly.
Neither Angel Broking Pvt. Limited, nor its directors, employees or affiliates shall be liable for any loss or damage that may arise from or
in connection with the use of this information.
Note: Please refer to the important ‘Stock Holding Disclosure' report on the Angel website (Research Section). Also, please refer to the
latest update on respective stocks for the disclosure status in respect of those stocks. Angel Broking Pvt. Limited and its affiliates may have
investment positions in the stocks recommended in this report.