Market Outlook
August 24, 2015
Dealer’s Diary
Domestic Indices
Chg (%)
(Pts)
(Close)
BSE Sensex
(0.9)
(242)
27,366
Indian markets are expected to open negatively given the weak global cues.
Nifty
(0.9)
(73)
8,300
The continued sell-off in US markets reflects the recent downward momentum for
MID CAP
(0.9)
(101)
11,217
the markets, which came amid overarching concerns about developing economies
and the outlook for U.S. interest rates.
SMALL CAP
(0.6)
(70)
11,610
BSE HC
0.0
3
18,440
European markets ended Friday's session solidly in negative territory, capping
BSE PSU
(1.0)
(71)
7,159
the weakest trading week so far in 2015. Investor concerns over upcoming snap
BANKEX
(1.3)
(269)
20,688
elections in Greece and the continued sell-off in the Chinese stock market
dampened sentiment.
AUTO
(2.1)
(396)
18,795
METAL
(0.9)
(69)
7,400
Indian markets ended in the red led by decline in the Real Estate, Auto and Capital
OIL & GAS
(1.0)
(90)
9,149
Goods stocks.
BSE IT
0.4
42
11,628
News & Result Analysis
Global Indices
Chg (%)
(Pts)
(Close)
GPPL: CMA CGM business loss to impact near-term Container volumes
Dow Jones
(3.1)
(531)
16,460
Refer detailed news analysis on the following page
NASDAQ
(3.5)
(171)
4,706
FTSE
(2.8)
(180)
6,188
Markets Today
The trend deciding level for the day is 27,313 / 8,282 levels. If NIFTY trades above
Nikkei
(3.0)
(598)
19,436
this level during the first half-an-hour of trade then we may witness a further rally up
Hang Sang
(1.5)
(348)
22,410
to 27,495 - 27,625 / 8,340 - 8,380 levels. However, if NIFTY trades below
Straits Times
(1.3)
(39)
2,971
27,313 / 8,282 levels for the first half-an-hour of trade then it may correct towards
Shanghai Com
(4.3)
(157)
3,508
27,184 - 27,002 / 8,243 - 8,185 levels.
Indices
S2
S1
PIVOT
R1
R2
Indian ADR
Chg (%)
(Pts)
(Close)
SENSEX
27,002
27,184
27,313
27,495
27,625
INFY
(1.5)
(0.3)
$17.1
NIFTY
8,185
8,243
8,282
8,340
8,380
WIT
(0.7)
(0.1)
$11.9
IBN
(3.1)
(0.3)
$9.1
Net Inflows (August 20, 2015)
HDB
(0.4)
(0.3)
$59.9
` cr
Purch
Sales
Net
MTD
YTD
FII
4,703
5,661
(959)
(1,718)
139,252
Advances / Declines
BSE
NSE
MFs
1,166
930
236
1,445
59,393
Advances
969
472
Declines
1,861
1,046
FII Derivatives (August 21, 2015)
Unchanged
88
65
` cr
Purch
Sales
Net
Open Interest
Index Futures
3,048
5,465
(2,417)
14,284
Volumes (` cr)
Stock Futures
4,602
5,041
(439)
52,848
BSE
3,463
NSE
19,545
Gainers / Losers
Gainer
Loser
Company
Price (`)
chg (%)
Company
Price (`)
chg (%)
VIDEOIND
137
14.9
CENTRALBK
81
(7.6)
SREINFRA
49
7.5
SUNASIAN
442
(6.5)
JUBILANT
369
5.0
GODREJPROP
309
(5.4)
DELTACORP
79
4.5
BALRAMCHIN
46
(5.1)
ESCORTS
167
4.3
DLF
114
(5.1)
Market Outlook
August 24, 2015
Gujarat Pipavav Port Ltd. (GPPL): CMA CGM business loss to
impact near-term Container business volumes
In a major development, Gujarat Pipavav Port (GPPL), from September-2015
onwards, is likely to lose ~70,000 TEUs of container business volumes as one of
their key clients, CMA-CGM is shifting its 1-line to Mundra port.
Our view: Post this development, there exists potential for CMA-CGM moving the
remaining 2-lines from GPPL to Mundra port, once the JV of CMA CGM and
Adani Port become operational (expected to commence operations in next 18-24
months). At this moment we are not extending the withdrawal of 1-line of business
to the remaining 2-lines.
This development comes at an inopportune time, when the company and the
nearby peers are pursuing capex amidst a weak demand environment.
Based on the past track record, we sense it has taken 3-4 quarters for the
company to recover any loss of business. Considering the same, we have reduced
our container volumes growth assumption for FY2016-17E. Also, we have
considered potential business loss from remaining 2 lines once Adani CMA-CGM
JV commences. Accordingly, we have also tapered our long-term Container
volume growth assumptions and scaled down our FY2016-2017E estimates.
Earnings Revision
FY2016E
FY2017E
Particulars (` cr)
Old
New
% chg.
Old New
% chg.
Net Sales
740
721
(2.5)
843
784
(7.0)
EBITDA
393
383
(2.5)
452
420
(7.1)
EBITDA Margins (%)
53.1
53.1
53.6
53.6
PAT
407
397
(2.5)
471
439
(6.7)
PAT Margins (%)
55.0
55.0
55.9
56.1
Source: Angel Research
On revising down our FY2016-17E estimates, we arrived at revised sum-of-the-
parts based valuation price target of `203/share. Given the lack of any positive
triggers in the near-term and limited upside, we maintain our NEUTRAL rating on
the stock.
Economic and Political News
Govt taking multiple steps to bring down PSU banks' NPA: Jaitley
Govt panel sees no case in imposing MAT on FIIs
India's GDP can double in 3 years: Suresh Prabhu
Corporate News
Govt to sell 10% stake in IOC to raise `9,500cr on Monday
NTPC to buy MP Power plant
Blue Star's `150cr plant in south in advanced stage
Market Outlook
August 24, 2015
Top Picks
Large Cap
Market
CMP
Target
Upside
Company
Sector
Rating
Cap (` Cr)
(`)
(`)
(%)
Axis Bank
Financials
1,24,826
Buy
525
716
36.3
ICICI Bank
Financials
1,71,897
Buy
296
370
25.0
Inox Wind
Capital Goods
8,569
Buy
386
505
30.8
LIC Housing Fin. Financials
23,308
Buy
462
590
27.7
Power Grid
Power
69,711
Buy
133
170
27.6
TCS
IT
5,23,979
Buy
2,675
3,168
18.4
Yes Bank
Financials
28,928
Buy
692
989
43.0
Infosys
IT
2,64,286 Accumulate
1,151
1,306
13.5
Tech Mahindra IT
54,155 Accumulate
563
646
14.7
Source: Angel Research, Bloomberg
Mid Cap
Market
CMP Target
Upside
Company
Sector
Cap (`
Rating
(`)
(`)
(%)
Cr)
Bajaj Electricals
Others
2,524
Buy
250
341
36.2
Garware Wall Ropes
Others
711
Buy
325
390
19.9
Hindustan Media VenturesMedia
1,662
Buy
226
292
28.9
JK Tyre
Auto & Auto Ancillary
2,666
Buy
118
147
25.1
MBL Infrastructures
Construction
1,038
Buy
250
360
43.8
Minda Industries
Auto & Auto Ancillary
933
Buy
588
652
10.8
MT Educare
Others
578
Buy
145
169
16.4
Radico Khaitan
Others
1,240
Buy
93
112
20.2
Surya Roshni
Others
596
Buy
136
183
34.6
Source: Angel Research, Bloomberg
Market Outlook
August 24, 2015
Global economic events release calendar
Date
Time
Country Event Description
Unit
Period
Bloomberg Data
Last Reported Estimated
August 25, 2015
11:30AM
Germany GDP nsa (YoY)
% Change
2Q F
1.60
1.60
7:30PM
US
New home sales
Thousands
Jul
482.00
510.00
7:30PM
US
Consumer Confidence
S.A./ 1985=100
Aug
90.91
93.40
August 27, 2015
6:00PM
US
Initial Jobless claims
Thousands
Aug 22
277.00
275.00
6:00PM
US
GDP Qoq (Annualised)
% Change
2Q S
2.30
3.20
August 28, 2015
2:30PM
Euro Zone Euro-Zone Consumer Confidence
Value
Aug F
(6.80)
--
2:00PM
UK
GDP (YoY)
% Change
2Q P
2.60
2.60
September 1, 2015
1:25PM
Germany PMI Manufacturing
Value
Aug F
53.20
--
1:25PM
Germany Unemployment change (000's)
Thousands
Aug
9.00
--
6:30AM
China
PMI Manufacturing
Value
Aug
50.00
49.70
2:00PM
UK
PMI Manufacturing
Value
Aug
51.90
--
September 3, 2015
1:25PM
Germany PMI Services
Value
Aug F
53.60
--
5:15PM
Euro Zone ECB announces interest rates
%
Sep 3
0.05
--
September 4, 2015
2:30PM
Euro Zone Euro-Zone GDP s.a. (QoQ)
% Change
2Q P
0.30
--
6:00PM
US
Change in Nonfarm payrolls
Thousands
Aug
215.00
195.00
6:00PM
US
Unnemployment rate
%
Aug
5.30
5.30
September 8, 2015
China
Exports YoY%
% Change
Aug
(8.30)
--
September 9, 2015
7:00AM
China
Consumer Price Index (YoY)
% Change
Aug
1.60
--
2:00PM
UK
Industrial Production (YoY)
% Change
Jul
1.50
--
September 10, 2015
India
Imports YoY%
% Change
Aug
(10.28)
--
India
Exports YoY%
% Change
Aug
(10.30)
--
4:30PM
UK
BOE Announces rates
% Ratio
Sep 10
0.50
0.50
September 11, 2015
5:30PM
India
Industrial Production YoY
% Change
Jul
3.80
--
September 12, 2015
11:00AM
China
Industrial Production (YoY)
% Change
Aug
6.00
--
Source: Bloomberg, Angel Research
Market Outlook
August 24, 2015
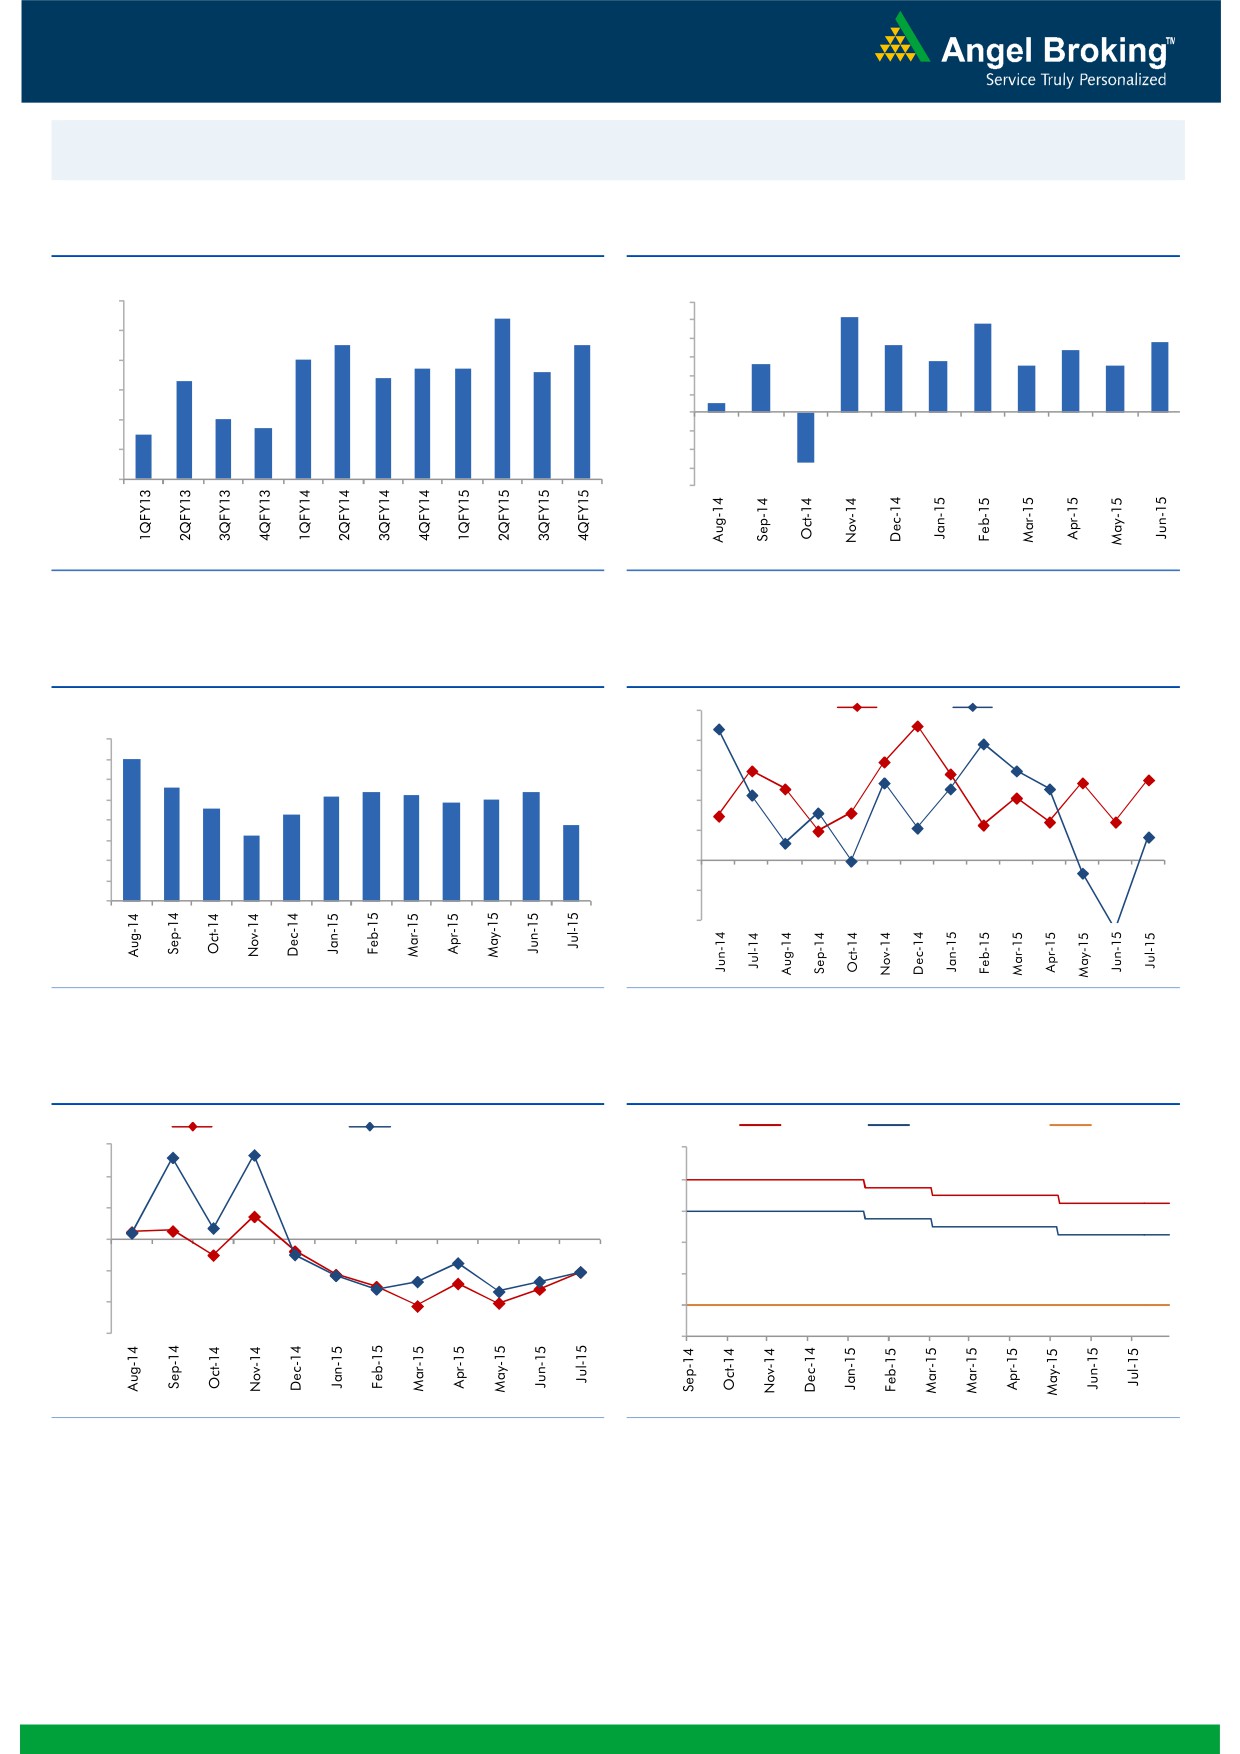
Macro watch
Exhibit 1: Quarterly GDP trends
Exhibit 2: IIP trends
(%)
(%)
9.0
8.4
6.0
5.2
4.8
7.5
7.5
5.0
3.8
8.0
3.6
3.4
7.0
4.0
2.8
6.7
6.7
2.6
2.5
2.5
7.0
6.3
6.4
6.6
3.0
2.0
6.0
0.5
1.0
5.0
4.7
-
5.0
4.5
(1.0)
4.0
(2.0)
(3.0)
3.0
(2.7)
(4.0)
Source: CSO, Angel Research
Source: MOSPI, Angel Research
Exhibit 3: Monthly CPI inflation trends
Exhibit 4: Manufacturing and services PMI
(%)
55.0
Mfg. PMI
Services PMI
8.0
7.0
54.0
7.0
5.6
53.0
6.0
5.2
5.4
5.3
5.4
4.9
5.0
4.6
5.0
4.3
52.0
3.8
4.0
3.3
51.0
3.0
2.0
50.0
1.0
49.0
-
48.0
Source: MOSPI, Angel Research
Source: Market, Angel Research; Note: Level above 50 indicates expansion
Exhibit 5: Exports and imports growth trends
Exhibit 6: Key policy rates
(%)
Exports yoy growth
Imports yoy growth
(%)
Repo rate
Reverse Repo rate
CRR
30.0
9.00
20.0
8.00
10.0
7.00
0.0
6.00
(10.0)
5.00
(20.0)
4.00
(30.0)
3.00
Source: Bloomberg, Angel Research
Source: RBI, Angel Research
Market Outlook
August 24, 2015
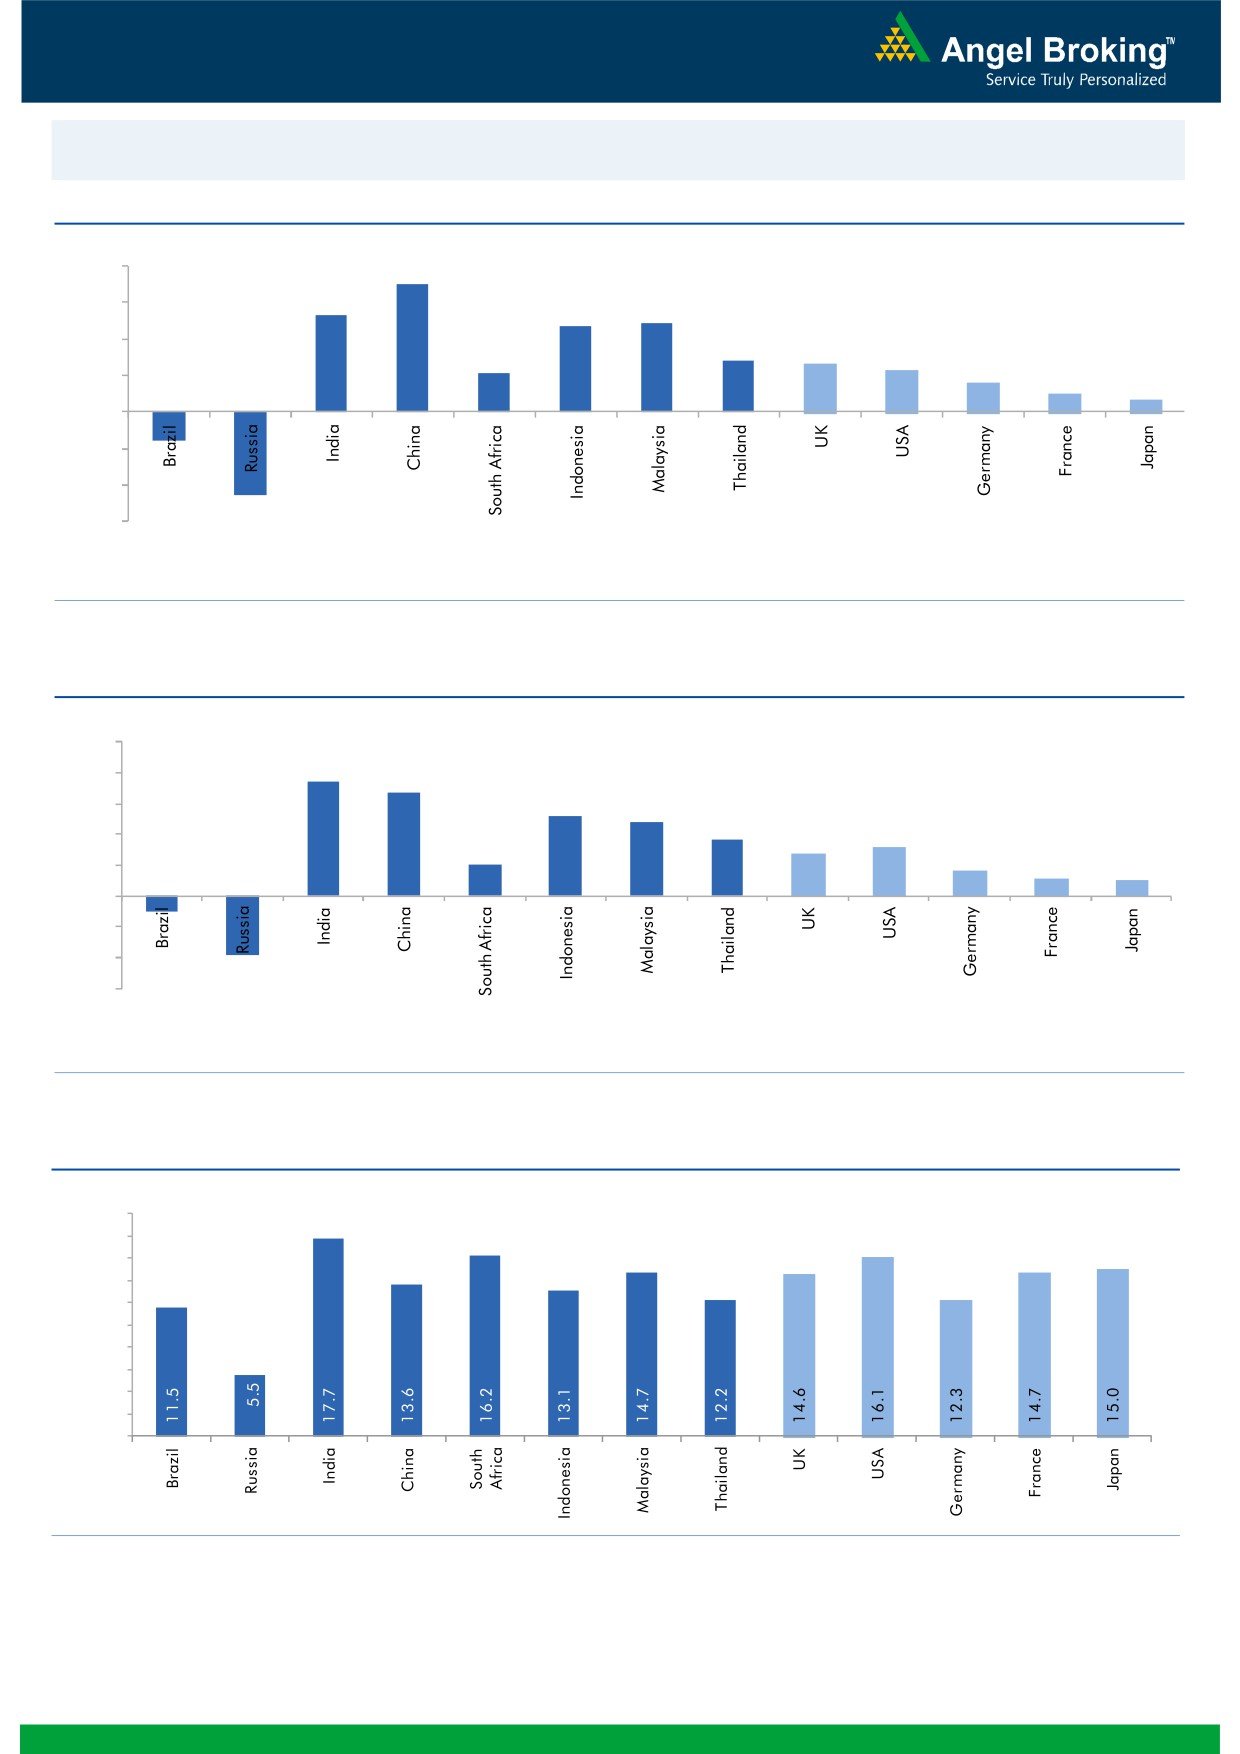
Global watch
Exhibit 1: Latest quarterly GDP Growth (%, yoy) across select developing and developed countries
(%)
8.0
7.0
6.0
5.3
4.9
4.7
4.0
2.8
2.6
2.1
2.3
1.6
2.0
1.0
(1.6)
0.7
(4.6)
-
(2.0)
(4.0)
(6.0)
Source: Bloomberg, Angel Research
Exhibit 2: 2015 GDP Growth projection by IMF (%, yoy) across select developing and developed countries
(%)
10.0
7.5
8.0
6.8
5.2
6.0
4.8
3.7
3.1
4.0
2.7
2.0
1.6
1.2
1.0
2.0
(3.8)
(1.0)
-
(2.0)
(4.0)
(6.0)
Source: IMF, Angel Research
Exhibit 3: One year forward P-E ratio across select developing and developed countries
(x)
20.0
18.0
16.0
14.0
12.0
10.0
8.0
6.0
4.0
2.0
-
Source: Bloomberg, Angel Research
Market Outlook
August 24, 2015
Exhibit 4: Relative performance of indices across globe
Returns (%)
Country
Name of index
Closing price
1M
3M
1YR
Brazil
Bovespa
45,720
(10.2)
(17.0)
(21.8)
Russia
Micex
1,663
1.7
(0.1)
14.9
India
Nifty
8,300
(3.9)
(0.8)
7.2
China
Shanghai Composite
3,508
(12.9)
(24.7)
57.8
South Africa
Top 40
43,405
(8.2)
(9.4)
(6.3)
Mexico
Mexbol
42,164
(5.6)
(6.0)
(7.1)
Indonesia
LQ45
727
(12.7)
(19.8)
(17.4)
Malaysia
KLCI
1,575
(9.0)
(11.9)
(15.4)
Thailand
SET 50
886
(8.1)
(12.5)
(13.3)
USA
Dow Jones
16,460
(7.8)
(10.0)
(3.2)
UK
FTSE
6,188
(7.2)
(12.0)
(9.3)
Japan
Nikkei
19,436
(5.6)
(4.1)
27.8
Germany
DAX
10,125
(12.1)
(14.3)
7.7
France
CAC
4,631
(8.9)
(9.5)
5.4
Source: Bloomberg, Angel Research
Market Outlook
August 24, 2015
Stock Watch
Company Name
Reco
CMP
Target
Mkt Cap
Sales ( Čcr )
OPM(%)
EPS (Č)
PER(x)
P/BV(x)
RoE(%)
EV/Sales(x)
(Č)
Price ( Č)
( Č cr )
FY16E FY17E
FY16E
FY17E
FY16E
FY17E
FY16E
FY17E
FY16E
FY17E
FY16E
FY17E
FY16E
FY17E
Agri / Agri Chemical
Rallis
Neutral
221
-
4,305
2,075
2,394
14.4
14.4
9.5
11.0
23.3
20.1
4.6
4.0
21.1
21.3
2.1
1.8
United Phosphorus
Neutral
536
-
22,954
13,698
15,752
17.6
17.6
32.1
38.5
16.7
13.9
3.3
2.7
21.4
21.3
1.8
1.5
Auto & Auto Ancillary
Ashok Leyland
Neutral
95
-
27,050
17,850
20,852
10.6
11.1
3.2
4.3
29.7
22.1
4.9
4.6
16.4
20.8
1.5
1.2
Bajaj Auto
Neutral
2,407
-
69,661
23,842
27,264
19.8
19.6
128.4
144.4
18.8
16.7
5.7
4.9
30.5
29.5
2.5
2.1
Eicher Motors
Accumulate
20,465
22,859
55,546
11,681
15,550
15.3
16.9
358.5
564.3
57.1
36.3
17.2
12.8
29.8
34.9
4.6
3.5
Hero Motocorp
Neutral
2,560
-
51,118
28,500
33,028
13.8
14.1
144.2
166.3
17.8
15.4
6.5
5.5
36.7
36.0
1.6
1.4
L G Balakrishnan & Bros Neutral
463
-
727
1,254
1,394
11.6
11.8
35.9
41.7
12.9
11.1
1.8
1.5
13.5
13.8
0.7
0.6
Mahindra and Mahindra Accumulate
1,322
1,493
82,105
40,088
45,176
13.8
14.0
59.6
70.4
22.2
18.8
3.7
3.2
16.6
17.2
1.7
1.4
Maruti
Neutral
4,569
-
138,022
58,102
68,587
16.7
16.9
182.0
225.5
25.1
20.3
5.0
4.3
19.9
21.0
2.1
1.8
Minda Industries
Buy
588
652
933
2,567
2,965
7.3
8.0
38.8
54.3
15.2
10.8
2.2
1.8
14.4
16.8
0.5
0.4
Rane Brake Lining
Accumulate
327
366
258
454
511
11.1
11.4
23.8
28.1
13.7
11.6
1.9
1.8
14.2
15.3
0.7
0.6
Setco Automotive
Neutral
221
-
591
594
741
12.7
13.7
8.4
15.8
26.3
14.0
2.7
2.4
10.4
16.9
1.4
1.2
Tata Motors
Buy
333
432
96,072
267,464
307,211
13.7
13.7
34.6
40.7
9.6
8.2
1.2
1.1
13.2
13.6
0.5
0.5
TVS Motor
Accumulate
229
255
10,868
11,839
13,985
7.0
8.0
10.8
15.9
21.2
14.4
5.4
4.3
25.5
29.7
0.9
0.7
Amara Raja Batteries
Neutral
1,076
-
18,379
5,101
6,224
17.8
17.6
31.1
39.2
34.6
27.5
8.6
6.8
24.8
24.8
3.6
2.9
Exide Industries
Neutral
155
-
13,137
7,363
8,247
13.7
14.5
6.6
7.7
23.4
20.1
3.0
2.7
12.6
13.3
1.5
1.4
Apollo Tyres
Neutral
196
-
9,954
12,428
13,262
16.8
16.4
21.9
21.1
8.9
9.3
1.5
1.3
17.0
14.1
0.9
0.9
Ceat
Neutral
1,169
-
4,729
6,041
6,770
14.3
14.1
101.5
120.3
11.5
9.7
2.3
1.9
20.0
19.6
0.9
0.8
JK Tyres
Buy
118
147
2,666
7,446
7,942
15.2
14.7
19.6
21.0
6.0
5.6
1.5
1.2
25.2
21.7
0.8
0.7
Swaraj Engines
Neutral
932
-
1,157
593
677
14.5
14.8
51.2
60.8
18.2
15.3
4.2
3.8
23.3
24.8
1.8
1.5
Subros
Neutral
88
-
531
1,268
1,488
11.6
11.9
3.7
6.6
23.9
13.4
1.6
1.5
6.8
11.4
0.7
0.6
Indag Rubber
Neutral
197
-
517
283
329
17.0
17.2
13.0
15.4
15.2
12.8
3.3
2.8
21.8
21.6
1.5
1.3
Capital Goods
ACE
Neutral
44
-
432
660
839
4.7
8.2
1.0
3.9
43.7
11.2
1.4
1.2
3.2
11.3
0.8
0.6
BEML
Neutral
1,309
-
5,450
3,277
4,006
6.0
8.9
29.2
64.3
44.8
20.4
2.5
2.3
5.7
11.7
1.8
1.4
BGR Energy
Neutral
122
-
882
3,615
3,181
9.5
9.4
16.7
12.4
7.3
9.9
0.7
0.7
10.0
7.0
0.7
0.8
BHEL
Neutral
249
-
60,933
33,722
35,272
10.8
11.7
10.5
14.2
23.7
17.5
1.8
1.7
7.0
9.0
1.9
1.8
Blue Star
Accumulate
358
387
3,224
3,649
4,209
5.0
5.9
9.2
14.7
39.2
24.3
7.1
6.7
9.1
17.5
1.0
0.8
Crompton Greaves
Accumulate
179
204
11,238
13,484
14,687
4.9
6.2
4.5
7.1
39.8
25.3
2.8
2.6
7.2
10.8
1.0
0.9
Inox Wind
Buy
386
505
8,569
4,980
5,943
17.0
17.5
26.6
31.6
14.5
12.2
4.3
3.2
35.0
30.0
1.9
1.5
Market Outlook
August 24, 2015
Stock Watch
Company Name
Reco
CMP
Target
Mkt Cap
Sales ( Čcr )
OPM(%)
EPS (Č)
PER(x)
P/BV(x)
RoE(%)
EV/Sales(x)
(Č)
Price ( Č)
( Č cr )
FY16E
FY17E
FY16E
FY17E
FY16E
FY17E
FY16E
FY17E
FY16E
FY17E
FY16E
FY17E
FY16E
FY17E
Capital Goods
KEC International
Neutral
137
-
3,522
8,791
9,716
6.1
6.8
5.4
8.2
25.4
16.7
2.5
2.3
10.0
14.0
0.6
0.6
Thermax
Neutral
1,029
-
12,263
6,413
7,525
7.4
8.5
30.5
39.3
33.7
26.2
5.2
4.5
15.0
17.0
1.9
1.6
Cement
ACC
Accumulate
1,405
1,548
26,385
11,856
14,092
14.5
17.8
47.6
76.1
29.5
18.5
3.0
2.8
10.6
15.7
2.1
1.7
Ambuja Cements
Neutral
227
-
35,189
10,569
12,022
20.7
22.2
8.7
10.7
26.1
21.2
3.3
3.1
13.0
15.2
2.9
2.6
India Cements
Buy
83
112
2,536
4,716
5,133
15.9
16.9
3.7
7.5
22.3
11.0
0.8
0.8
3.8
7.3
0.8
0.7
JK Cement
Buy
656
767
4,586
4,056
4,748
14.5
17.0
22.6
41.1
29.0
16.0
2.6
2.3
9.3
15.3
1.6
1.3
J K Lakshmi Cement
Buy
359
430
4,227
2,947
3,616
16.7
19.9
11.5
27.2
31.2
13.2
3.0
2.6
9.8
20.8
1.8
1.5
Mangalam Cements
Neutral
243
-
650
1,053
1,347
10.5
13.3
8.4
26.0
29.0
9.4
1.2
1.1
4.3
12.5
1.0
0.7
Orient Cement
Neutral
175
-
3,588
1,854
2,524
21.2
22.2
7.7
11.1
22.8
15.8
3.3
2.8
13.3
15.7
2.7
1.9
Ramco Cements
Neutral
356
-
8,465
4,036
4,545
20.8
21.3
15.1
18.8
23.6
18.9
2.9
2.6
12.9
14.3
2.6
2.2
Shree Cement^
Neutral
11,054
-
38,509
7,150
8,742
26.7
28.6
228.0
345.5
48.5
32.0
7.1
6.0
15.7
20.3
5.1
4.1
UltraTech Cement
Accumulate
2,972
3,282
81,547
27,562
31,548
20.4
22.3
111.9
143.3
26.6
20.7
3.8
3.3
15.2
16.8
3.0
2.6
Construction
ITNL
Neutral
104
-
2,562
7,360
8,825
34.0
35.9
1.0
5.0
103.9
20.8
0.4
0.4
0.3
1.4
3.8
3.7
KNR Constructions
Neutral
562
-
1,558
915
1,479
14.3
13.9
20.3
37.2
27.7
15.1
2.5
2.2
9.6
15.6
1.8
1.2
Larsen & Toubro
Buy
1,740
2,013
161,924
68,920
82,446
10.9
11.5
57.0
73.0
30.5
23.8
2.8
2.6
13.6
15.5
2.6
2.1
Gujarat Pipavav Port
Neutral
181
-
8,743
740
843
53.1
53.6
8.0
10.0
22.6
18.1
3.5
2.8
20.4
19.4
11.4
9.6
MBL Infrastructures
Buy
250
360
1,038
2,313
2,797
12.2
14.6
19.0
20.0
13.2
12.5
1.4
1.3
11.3
10.6
1.2
1.0
PNC Infratech
Neutral
486
-
2,496
1,798
2,132
13.2
13.5
22.0
30.0
22.1
16.2
2.0
1.8
11.5
11.4
1.5
1.3
Financials
Allahabad Bank
Neutral
88
-
5,028
8,859
9,817
3.0
3.0
23.7
30.1
3.7
2.9
0.4
0.4
10.6
12.3
-
-
Axis Bank
Buy
525
716
124,826
26,522
31,625
3.6
3.6
36.2
45.4
14.5
11.6
2.8
2.5
18.2
19.6
-
-
Bank of Baroda
Neutral
200
-
44,141
18,934
21,374
2.0
2.0
13.2
15.1
15.1
13.2
1.1
1.0
7.1
7.7
-
-
Bank of India
Neutral
167
-
11,071
17,402
20,003
2.0
2.1
40.3
50.7
4.1
3.3
0.4
0.4
9.0
10.4
-
-
Canara Bank
Neutral
327
-
16,870
15,805
17,745
2.0
2.2
64.3
73.5
5.1
4.5
0.6
0.5
10.8
11.3
-
-
Dena Bank
Neutral
44
-
2,444
3,580
4,040
2.1
2.2
8.4
10.9
5.2
4.0
0.5
0.4
6.8
8.4
-
-
Federal Bank
Neutral
67
-
11,472
3,522
4,045
3.2
3.2
12.2
14.1
5.5
4.8
0.7
0.6
12.9
13.4
-
-
HDFC
Accumulate
1,229
1,343
193,666
11,198
13,321
3.5
3.5
45.1
53.7
27.3
22.9
5.6
5.0
27.2
28.2
-
-
HDFC Bank
Buy
1,061
1,255
266,684
38,629
47,500
4.5
4.7
52.6
66.4
20.2
16.0
3.7
3.1
19.6
21.2
-
-
ICICI Bank
Buy
296
370
171,897
36,037
41,647
3.5
3.6
22.9
26.7
12.9
11.1
2.2
1.9
15.7
15.9
-
-
IDBI Bank
Neutral
67
-
10,763
9,806
11,371
1.7
1.9
10.0
16.3
6.8
4.1
0.5
0.4
6.8
10.4
-
-
Market Outlook
August 24, 2015
Stock Watch
Company Name
Reco
CMP
Target
Mkt Cap
Sales ( Čcr )
OPM(%)
EPS (Č)
PER(x)
P/BV(x)
RoE(%)
EV/Sales(x)
(Č)
Price ( Č)
( Č cr )
FY16E FY17E
FY16E
FY17E
FY16E
FY17E
FY16E
FY17E
FY16E
FY17E
FY16E
FY17E
FY16E
FY17E
Financials
Indian Bank
Neutral
140
-
6,700
6,454
7,321
2.5
2.6
26.4
33.3
5.3
4.2
0.5
0.4
8.1
9.6
-
-
LIC Housing Finance
Buy
462
590
23,308
2,934
3,511
2.3
2.3
30.9
36.8
15.0
12.6
2.4
2.1
16.8
17.5
-
-
Oriental Bank
Neutral
160
-
4,789
7,930
8,852
2.5
2.5
51.8
57.1
3.1
2.8
0.4
0.3
9.3
9.5
-
-
Punjab Natl.Bank
Neutral
160
-
29,599
24,160
27,777
2.9
3.0
18.5
24.6
8.6
6.5
0.8
0.7
8.8
10.8
-
-
South Ind.Bank
Neutral
22
-
2,984
1,999
2,249
2.4
2.4
3.5
4.0
6.4
5.5
0.8
0.7
12.6
13.1
-
-
St Bk of India
Accumulate
267
285
202,321
86,900
100,550
3.1
3.1
22.1
27.7
12.1
9.7
1.5
1.3
12.7
14.3
-
-
Union Bank
Neutral
200
-
12,700
12,995
14,782
2.4
2.4
32.3
40.9
6.2
4.9
0.7
0.6
10.7
12.3
-
-
Vijaya Bank
Neutral
38
-
3,252
3,474
3,932
1.8
1.9
5.9
7.2
6.5
5.3
0.5
0.5
8.1
9.3
-
-
Yes Bank
Buy
692
989
28,928
7,006
8,825
3.1
3.3
61.4
77.1
11.3
9.0
2.1
1.8
20.1
21.3
-
-
FMCG
Asian Paints
Neutral
887
-
85,038
16,553
19,160
16.0
16.2
17.7
21.5
50.2
41.2
13.3
12.0
29.4
31.2
5.0
4.3
Britannia
Neutral
3,202
-
38,416
8,065
9,395
9.6
10.2
47.2
65.5
67.8
48.9
22.5
21.3
38.3
41.2
4.6
4.0
Colgate
Neutral
1,999
-
27,182
4,836
5,490
19.5
19.7
48.5
53.2
41.2
37.6
30.2
26.3
99.8
97.5
5.5
4.9
Dabur India
Neutral
299
-
52,476
9,370
10,265
17.1
17.2
7.3
8.1
40.7
36.9
12.3
10.0
33.7
30.6
5.5
5.0
GlaxoSmith Con*
Neutral
6,224
-
26,173
4,919
5,742
17.2
17.4
168.3
191.2
37.0
32.6
10.5
8.9
28.8
28.9
4.9
4.1
Godrej Consumer
Neutral
1,309
-
44,564
10,168
12,886
16.1
16.1
32.1
38.4
40.8
34.1
8.3
7.7
19.7
21.0
4.5
3.5
HUL
Neutral
882
-
190,783
34,940
38,957
17.5
17.7
20.8
24.7
42.4
35.7
47.2
37.7
110.5
114.2
5.3
4.7
ITC
Buy
330
409
264,610
41,068
45,068
37.8
37.4
13.9
15.9
23.7
20.8
7.9
7.0
34.1
33.8
6.1
5.5
Marico
Neutral
430
-
27,752
6,551
7,766
15.7
16.0
10.4
12.5
41.5
34.4
12.0
10.0
33.2
32.4
4.2
3.5
Nestle*
Accumulate
6,099
6,646
58,807
11,291
12,847
22.2
22.3
158.9
184.6
38.4
33.0
20.1
18.1
55.0
57.3
5.1
4.4
Tata Global
Buy
130
152
8,223
8,635
9,072
9.8
9.9
6.5
7.6
20.1
17.2
2.0
1.9
6.8
7.4
0.9
0.8
IT
HCL Tech^
Buy
963
1,132
135,469
42,038
47,503
23.5
23.5
56.4
62.9
17.1
15.3
4.0
3.0
23.2
19.8
2.8
2.3
Infosys
Accumulate
1,151
1,306
264,286
60,250
66,999
28.0
28.0
58.3
63.7
19.7
18.1
4.1
3.6
20.9
19.7
3.7
3.2
TCS
Buy
2,675
3,168
523,979
108,420
123,559
28.8
28.7
127.2
143.9
21.0
18.6
8.4
7.8
39.9
41.8
4.4
3.8
Tech Mahindra
Accumulate
563
646
54,155
25,566
28,890
16.0
17.0
26.3
31.9
21.4
17.7
3.9
3.3
17.9
18.6
1.9
1.6
Wipro
Buy
576
719
142,298
52,414
58,704
23.7
23.8
38.4
42.3
15.0
13.6
2.9
2.6
19.5
18.0
2.3
1.9
Media
D B Corp
Accumulate
320
356
5,875
2,241
2,495
27.8
27.9
21.8
25.6
14.7
12.5
3.8
3.4
26.7
28.5
2.6
2.3
HT Media
Neutral
86
-
2,009
2,495
2,603
11.2
11.2
7.3
8.6
11.8
10.0
0.9
0.9
7.4
8.1
0.3
0.3
Jagran Prakashan
Accumulate
138
156
4,495
1,939
2,122
26.0
26.0
8.3
9.2
16.6
14.9
2.8
2.6
17.5
17.1
2.3
2.1
Sun TV Network
Neutral
338
-
13,312
2,779
3,196
70.2
70.5
22.8
27.3
14.8
12.4
3.7
3.3
26.7
28.3
4.5
3.9
Market Outlook
August 24, 2015
Stock Watch
Company Name
Reco
CMP
Target
Mkt Cap
Sales ( Čcr )
OPM(%)
EPS (Č)
PER(x)
P/BV(x)
RoE(%)
EV/Sales(x)
(Č)
Price ( Č)
( Č cr )
FY16E FY17E
FY16E
FY17E
FY16E
FY17E
FY16E
FY17E
FY16E
FY17E
FY16E
FY17E
FY16E
FY17E
Media
Hindustan Media
Buy
226
292
1,662
920
1,031
20.0
20.0
19.2
20.9
11.8
10.9
1.9
1.7
16.4
15.3
1.3
1.2
Ventures
Metals & Mining
Coal India
Buy
349
450
220,252
77,595
89,628
22.9
24.4
27.6
30.0
12.6
11.6
5.5
5.5
33.9
33.2
2.1
1.9
Hind. Zinc
Neutral
137
-
57,993
15,546
16,821
47.5
49.0
19.7
20.3
7.0
6.8
1.2
1.0
17.2
16.6
1.5
1.0
Hindalco
Neutral
86
-
17,769
112,328
119,817
7.7
7.9
16.3
20.1
5.3
4.3
0.4
0.4
8.0
8.5
0.6
0.5
JSW Steel
Neutral
946
-
22,875
48,125
53,595
18.8
21.0
46.9
97.5
20.2
9.7
1.0
0.9
4.4
9.5
1.3
1.1
NMDC
Neutral
93
-
36,892
12,544
13,330
59.5
59.7
16.3
16.5
5.7
5.6
1.0
1.0
5.1
9.9
1.7
1.7
SAIL
Neutral
55
-
22,881
56,365
63,383
6.9
8.0
7.1
8.2
7.8
6.8
0.5
0.5
7.0
7.1
1.0
0.9
Vedanta
Neutral
95
-
28,046
81,842
88,430
30.6
32.8
20.2
25.7
4.7
3.7
0.3
0.3
7.5
8.5
0.7
0.5
Tata Steel
Neutral
237
-
23,042
136,805
149,228
11.3
11.9
26.4
36.8
9.0
6.5
0.7
0.7
6.0
8.0
0.7
0.6
Oil & Gas
Cairn India
Neutral
142
-
26,614
12,617
14,513
33.7
40.0
25.5
27.7
5.6
5.1
0.4
0.4
7.4
7.7
0.8
0.6
GAIL
Neutral
312
-
39,545
75,595
85,554
8.6
8.0
31.8
36.1
9.8
8.6
1.1
1.0
10.7
11.4
0.7
0.5
ONGC
Neutral
256
-
218,978
174,773
192,517
22.7
24.8
34.6
38.2
7.4
6.7
1.1
1.0
14.2
14.9
1.4
1.2
Petronet LNG
Buy
179
210
13,425
39,007
40,785
3.8
4.2
9.2
11.0
19.6
16.3
2.2
2.0
11.6
12.7
0.4
0.4
Reliance Industries
Buy
907
1,050
293,797
339,083
384,014
7.8
9.5
75.7
94.5
12.0
9.6
1.2
1.1
10.7
12.2
1.2
1.1
Pharmaceuticals
Alembic Pharma
Neutral
709
-
13,373
2,601
3,115
21.2
20.2
20.8
23.9
34.1
29.7
11.0
8.3
37.2
31.8
5.2
4.3
Aurobindo Pharma
Neutral
805
-
47,003
14,435
16,600
22.6
22.6
36.1
41.2
22.3
19.5
6.6
5.0
34.5
29.3
3.6
3.1
Aventis*
Neutral
4,117
-
9,482
2,156
2,455
15.1
16.8
109.7
133.9
37.5
30.8
5.2
4.2
18.4
22.5
4.1
3.4
Cadila Healthcare
Neutral
1,951
-
39,948
10,224
11,840
20.0
21.0
71.0
85.6
27.5
22.8
7.4
5.8
30.1
28.5
4.0
3.4
Cipla
Neutral
697
-
56,005
14,051
16,515
20.4
18.7
26.6
28.4
26.2
24.6
4.4
3.8
18.2
16.5
4.0
3.3
Dr Reddy's
Neutral
4,242
-
72,312
17,903
20,842
22.7
22.8
160.5
189.5
26.4
22.4
5.4
4.4
22.2
21.7
4.0
3.4
Dishman Pharma
Buy
227
317
1,829
1,716
1,888
20.2
20.2
16.3
21.6
13.9
10.5
1.3
1.2
9.7
11.7
1.2
1.0
GSK Pharma*
Neutral
3,577
-
30,294
2,870
3,158
20.0
22.1
59.5
68.3
60.1
52.4
17.7
18.2
28.5
34.3
10.1
9.2
Indoco Remedies
Neutral
349
-
3,212
1,088
1,262
18.2
18.2
13.1
15.5
26.6
22.5
5.2
4.4
21.2
21.1
3.0
2.6
Ipca labs
Neutral
853
-
10,756
3,507
4,078
17.6
18.6
25.8
32.0
33.0
26.6
4.3
3.7
13.8
14.9
3.3
2.9
Lupin
Neutral
1,875
-
84,380
14,864
17,244
26.9
26.9
62.1
71.1
30.2
26.4
7.3
5.8
27.4
24.6
5.4
4.5
Sun Pharma
Neutral
938
-
225,784
28,163
32,610
25.8
30.7
17.4
26.9
53.9
34.9
5.1
4.4
13.0
16.6
7.5
6.3
Power
Tata Power
Neutral
68
-
18,391
38,302
38,404
14.1
13.1
5.1
6.0
13.2
11.4
1.3
1.2
9.2
10.3
1.4
1.3
NTPC
Buy
123
157
101,790
87,064
98,846
23.5
23.5
11.7
13.2
10.6
9.4
1.2
1.1
11.4
12.1
2.2
2.0
Power Grid
Buy
133
170
69,711
20,702
23,361
86.7
86.4
12.1
13.2
11.0
10.1
1.6
1.4
15.6
15.1
8.3
7.7
Market Outlook
August 24, 2015
Stock Watch
Company Name
Reco
CMP
Target
Mkt Cap
Sales ( Čcr )
OPM(%)
EPS (Č)
PER(x)
P/BV(x)
RoE(%)
EV/Sales(x)
(Č)
Price ( Č)
( Č cr )
FY16E FY17E
FY16E
FY17E
FY16E
FY17E
FY16E
FY17E
FY16E
FY17E
FY16E
FY17E
FY16E
FY17E
Telecom
Bharti Airtel
Neutral
370
-
147,784
101,748
109,191
32.1
31.7
12.0
12.5
30.8
29.6
2.1
2.0
6.9
6.7
2.1
1.9
Idea Cellular
Accumulate
153
171
54,916
34,282
36,941
32.0
31.5
5.9
6.2
25.9
24.6
2.4
2.2
9.9
9.3
2.2
2.1
zOthers
Abbott India
Neutral
4,847
-
10,300
2,715
3,153
14.5
14.1
134.3
152.2
36.1
31.8
9.0
7.4
27.4
25.6
3.5
3.0
Bajaj Electricals
Buy
250
341
2,524
4,719
5,287
5.2
5.8
8.6
12.7
29.3
19.8
3.3
2.9
11.4
14.8
0.5
0.5
Finolex Cables
Neutral
249
-
3,810
2,728
3,036
10.8
11.0
14.4
16.8
17.3
14.9
2.6
2.3
15.2
15.3
1.1
1.0
Goodyear India*
Accumulate
590
655
1,360
1,953
1,766
12.4
12.0
67.4
59.6
8.7
9.9
2.2
1.9
27.7
20.2
0.5
0.5
Hitachi
Neutral
1,324
-
3,601
1,806
2,112
9.0
9.2
28.6
29.1
46.3
45.5
11.5
9.3
28.1
22.6
2.1
1.8
Jyothy Laboratories
Neutral
317
-
5,736
1,620
1,847
11.5
11.5
7.3
8.5
43.5
37.4
5.6
5.2
13.3
14.4
3.4
2.9
MRF
Neutral
43,328
-
18,376
20,727
14,841
19.3
18.6
4,905.8
3,351.9
8.8
12.9
2.8
2.3
37.6
19.6
0.8
1.1
Page Industries
Neutral
14,661
-
16,352
1,929
2,450
19.8
20.1
229.9
299.0
63.8
49.0
28.1
19.6
52.1
47.1
8.5
6.7
Relaxo Footwears
Neutral
553
-
6,640
1,767
2,152
12.3
12.5
19.3
25.1
28.8
22.1
7.1
5.4
27.7
27.8
3.8
3.1
Siyaram Silk Mills
Accumulate
1,121
1,221
1,051
1,653
1,873
11.7
12.2
99.3
122.1
11.3
9.2
2.0
1.7
19.5
20.2
0.8
0.7
Styrolution ABS India*
Neutral
824
-
1,448
1,271
1,440
8.6
9.2
32.0
41.1
25.7
20.1
2.6
2.4
10.7
12.4
1.1
1.0
Tree House
Accumulate
395
433
1,670
259
324
56.8
56.8
17.0
21.7
23.2
18.2
2.3
2.1
10.1
11.5
6.4
5.2
TVS Srichakra
Accumulate
2,977
3,210
2,280
2,127
2,388
15.2
14.9
237.7
267.5
12.5
11.1
5.3
3.8
51.7
39.8
1.1
1.0
HSIL
Buy
279
434
2,018
2,085
2,436
18.5
18.6
21.7
28.9
12.9
9.7
1.3
1.2
10.0
12.1
1.1
0.9
Kirloskar Engines India
Neutral
287
-
4,151
2,634
3,252
10.1
12.0
10.9
17.4
26.3
16.5
2.9
2.6
11.4
16.8
1.2
0.9
Ltd
M M Forgings
Buy
658
797
795
563
671
22.1
22.9
51.0
66.5
12.9
9.9
2.7
2.1
23.1
24.1
1.6
1.3
Banco Products (India)
Neutral
140
-
1,000
1,208
1,353
11.0
12.3
10.8
14.5
13.0
9.7
1.5
1.3
11.9
14.5
0.8
0.7
Competent Automobiles Neutral
177
-
109
1,007
1,114
3.1
3.1
23.7
28.2
7.5
6.3
1.0
0.9
13.9
14.6
0.1
0.1
Nilkamal
Neutral
989
-
1,475
1,948
2,147
10.6
10.3
60.0
67.0
16.5
14.8
2.6
2.2
16.8
16.1
0.8
0.7
Visaka Industries
Neutral
173
-
274
1,158
1,272
8.6
9.5
23.7
32.7
7.3
5.3
0.7
0.7
10.1
12.5
0.4
0.3
Transport Corporation of
Neutral
287
-
2,185
2,830
3,350
8.8
9.0
14.4
18.3
20.0
15.7
3.1
2.7
15.4
17.1
0.9
0.8
India
Elecon Engineering
Accumulate
79
87
862
1,452
1,596
14.0
14.7
4.4
6.2
17.9
12.7
1.5
1.4
8.6
11.2
0.9
0.8
Surya Roshni
Buy
136
183
596
2,992
3,223
8.3
8.5
14.7
18.3
9.3
7.5
0.9
0.8
9.8
11.0
0.5
0.5
MT Educare
Buy
145
169
578
286
366
18.3
17.7
7.7
9.4
18.8
15.5
4.0
3.5
20.2
21.1
1.9
1.5
Radico Khaitan
Buy
93
112
1,240
1,565
1,687
11.9
12.4
5.4
6.6
17.2
14.2
1.4
1.3
8.0
9.0
1.3
1.2
Garware Wall Ropes
Buy
298
390
652
875
983
10.4
10.6
23.1
27.8
12.9
10.7
1.8
1.6
14.1
14.8
0.8
0.7
Source: Company, Angel Research; Note: *December year end; #September year end; &October year end; Price as on August 21, 2015
Market Outlook
August 24, 2015
Research Team Tel: 022 - 39357800
DISCLAIMER
Angel Broking Private Limited (hereinafter referred to as “Angel”) is a registered Member of National Stock Exchange of India Limited,
Bombay Stock Exchange Limited and MCX Stock Exchange Limited. It is also registered as a Depository Participant with CDSL and
Portfolio Manager with SEBI. It also has registration with AMFI as a Mutual Fund Distributor. Angel Broking Private Limited is a registered
entity with SEBI for Research Analyst in terms of SEBI (Research Analyst) Regulations, 2014 vide registration number INH000000164.
Angel or its associates has not been debarred/ suspended by SEBI or any other regulatory authority for accessing /dealing in securities
Market. Angel or its associates including its relatives/analyst do not hold any financial interest/beneficial ownership of more than 1% in
the company covered by Analyst. Angel or its associates/analyst has not received any compensation / managed or co-managed public
offering of securities of the company covered by Analyst during the past twelve months. Angel/analyst has not served as an officer,
director or employee of company covered by Analyst and has not been engaged in market making activity of the company covered by
Analyst.
This document is solely for the personal information of the recipient, and must not be singularly used as the basis of any investment
decision. Nothing in this document should be construed as investment or financial advice. Each recipient of this document should make
such investigations as they deem necessary to arrive at an independent evaluation of an investment in the securities of the companies
referred to in this document (including the merits and risks involved), and should consult their own advisors to determine the merits and
risks of such an investment.
Reports based on technical and derivative analysis center on studying charts of a stock's price movement, outstanding positions and
trading volume, as opposed to focusing on a company's fundamentals and, as such, may not match with a report on a company's
fundamentals.
The information in this document has been printed on the basis of publicly available information, internal data and other reliable sources
believed to be true, but we do not represent that it is accurate or complete and it should not be relied on as such, as this document is for
general guidance only. Angel Broking Pvt. Limited or any of its affiliates/ group companies shall not be in any way responsible for any
loss or damage that may arise to any person from any inadvertent error in the information contained in this report. Angel Broking Pvt.
Limited has not independently verified all the information contained within this document. Accordingly, we cannot testify, nor make any
representation or warranty, express or implied, to the accuracy, contents or data contained within this document. While Angel Broking
Pvt. Limited endeavors to update on a reasonable basis the information discussed in this material, there may be regulatory, compliance,
or other reasons that prevent us from doing so.
This document is being supplied to you solely for your information, and its contents, information or data may not be reproduced,
redistributed or passed on, directly or indirectly.
Neither Angel Broking Pvt. Limited, nor its directors, employees or affiliates shall be liable for any loss or damage that may arise from or
in connection with the use of this information.
Note: Please refer to the important ‘Stock Holding Disclosure' report on the Angel website (Research Section). Also, please refer to the
latest update on respective stocks for the disclosure status in respect of those stocks. Angel Broking Pvt. Limited and its affiliates may have
investment positions in the stocks recommended in this report.