Market Outlook
July 24, 2015
Dealer’s Diary
Domestic Indices
Chg (%)
(Pts)
(Close)
Indian markets are expected to open in red tracking SGX Nifty.
BSE Sensex
(0.5)
(134)
28,371
Weak earnings from industrial bellwethers Caterpillar, 3M and American Express
Nifty
(0.5)
(44)
8,590
weighed on Dow Jones, pushing the blue-chip index below the key technical level on
MID CAP
(0.2)
(18)
11,216
Thursday. Selling pressure accelerated in afternoon and key indexes closed in red
SMALL CAP
0.5
60
11,736
for third straight day, led by Utilities, Materials and Industrial stocks.
BSE HC
(0.6)
(109)
16,894
BSE PSU
0.0
1
7,807
FTSE and DAX ended in red, continuing the pull back of previous 2 sessions. With
BANKEX
(0.7)
(156)
21,633
Greece concerns easing, markets have now shifted their focus towards corporate
AUTO
0.5
94
19,170
earnings.
METAL
(0.5)
(47)
8,885
Markets lost half a percent on Thursday due to profit booking after seeing over
OIL & GAS
0.5
49
10,243
300 points relief rally in earlier sessions. Private Banks, Cap-goods, select Metals
BSE IT
(0.6)
(72)
11,070
and Pharma stocks dragged the market.
Global Indices
Chg (%)
(Pts)
(Close)
Dow Jones
(0.7)
(119)
17,732
News & Result Analysis
NASDAQ
(0.5)
(25)
5,146
Lupin- Updates
FTSE
(0.2)
(12)
6,655
Result Review: Rallis India, Wipro, Lupin
Result Preview: Axis Bank, TVS Motors
Nikkei
0.4
90
20,684
Refer detailed news & result analysis on the following page
Hang Sang
0.5
116
25,399
Straits Times
(0.1)
(3)
3,356
Markets Today
Shanghai Com
2.4
98
4,124
The trend deciding level for the day is 28,422 / 8,606 levels. If NIFTY trades above
this level during the first half-an-hour of trade then we may witness a further rally up
to 28,528 - 28,684 / 8,638 - 8,687 levels. However, if NIFTY trades below
Indian ADR
Chg (%)
(Pts)
(Close)
28,422/ 8,606 levels for the first half-an-hour of trade then it may correct towards
INFY
0.3
0.1
$17.3
28,265 - 28,159 / 8,557 - 8,525 levels.
WIT
(1.3)
(0.2)
$12.6
IBN
(1.6)
(0.2)
$10.1
Indices
S2
S1
PIVOT
R1
R2
HDB
(0.6)
(0.3)
$62.1
SENSEX
28,159
28,265
28,422
28,528
28,684
NIFTY
8,525
8,557
8,606
8,638
8,687
Advances / Declines
BSE
NSE
Advances
1,528
768
Net Inflows (July 22, 2015)
Declines
1,322
738
` cr
Purch
Sales
Net
MTD
YTD
FII
4,002
3,534
468
7,451
142,831
Unchanged
133
66
MFs
1,056
875
181
1,813
55,423
Volumes (` cr)
FII Derivatives (July 23, 2015)
BSE
3,403
` cr
Purch
Sales
Net
Open Interest
NSE
18,160
Index Futures
1,460
2,044
(584)
21,605
Stock Futures
3,919
4,277
(358)
51,482
Gainers / Losers
Gainer
Loser
Company
Price (`)
chg (%)
Company
Price (`)
chg (%)
POLARIS
211
9.3
KAILASH
7
(10.0)
RAJESHEXPO
521
7.8
TV18BRDCST
34
(8.0)
JUBILANT
229
7.3
JSWENERGY
93
(5.5)
CAIRN
177
6.2
CONCOR
1,656
(5.3)
SUNTV
274
6.0
LUPIN
1,729
(5.2)
Market Outlook
July 24, 2015
Lupin-Updates
In a recent development, the US Food and Drug Administration (USFDA) have
served Lupin's oral solids and formulation plant in Goa with Form 483, which used
by the regulator to document and communicate concerns discovered during an
inspection. The USFDA has raised nine concerns relating to manufacturing process
and quality control. The plant was inspected by the USFDA last week.
The main cause of concern for USFDA is cross contamination due to free
movement from one unit to another within the plant. Besides this, unsigned test
records, air handling system and stock location are other observations listed in the
form. Lupin has 15 days to respond to the observations before any further action is
taken by the USFDA. The Goa plant supplies drugs to markets in US, Europe and
Japan. While the further details are not available, these observations don’t look
that serious. Thus currently we are, not changing our numbers.
Also, during the quarter, the company entered into a definitive agreement to
acquire privately held GAVIS Pharmaceuticals LLC and Novel Laboratories Inc.
(GAVIS), subject to certain closing conditions, in a transaction valued at
US$880mn, cash free and debt free. The transaction has been unanimously
approved by the Boards of Directors of Lupin and GAVIS.
The acquisition enhances Lupin’s scale in the US generic market and also
broadens Lupin’s pipeline in dermatology, controlled substance products and
other high-value and niche generics. GAVIS brings to Lupin a highly skilled US
based R & D organization which would complement Lupin’s Coral Springs,
Florida, inhalation R&D center. GAVIS’s New Jersey based manufacturing facility
will become Lupin’s first manufacturing site in the US.
New Jersey based GAVIS is a privately held company specializing in formulation
development, manufacturing, packaging, sales, marketing, and distribution of
pharmaceuticals products. GAVIS recorded sales of US$96mn in FY
2014
(coming from around
20 products) and has over
250 New Jersey based
employees. GAVIS currently has 66 ANDA filings pending approval with the US
FDA and a pipeline of over 65+ products under development. 72% of these filings
pending approvals represent niche dosage forms. To date, GAVIS has filed 25
Para IVs and 8 FTFs products. GAVIS’s pending filings address a market value of
about US$9bn. The combined company will have a portfolio of 101 in-market
products, 164 cumulative filings pending approval and a deep pipeline of
products under development for the US. The acquisition creates the 5th largest
portfolio of ANDA filings with the US FDA, addressing a US$63.8bn market.
Prima facie, the acquisition looks very costly, coming in at 9.2xMarket Cap/Sales,
given the size of the company, though funding will be not a problem given that
company has very little debt on the books. We maintain our neutral rating on the
stock.
Market Outlook
July 24, 2015
Result Review
Rallis India (CMP: `253 / TP: /Upside:)
Rallis India, announced a poor set of numbers for 1QFY2016. The sales came in
at `463.6cr V/s `465.3cr, a yoy dip of 0.4%. On the operating front the EBDITA
margins came in 12.2% V/s 12.0% in 1QFY2015. The net profit came in at
`33.1cr v/s `37cr in 1QFY2015, a yoy dip of 10.5%. We maintain our neutral
rating on the stock.
Y/E
Sales OPM
PAT
EPS ROE P/E P/BV EV/EBITDA EV/Sales
March
(` cr)
(%)
(` cr)
(`)
(%)
(x)
(x)
(x)
(x)
FY2016E
2,097
14.4
184
9.5
21.1
26.7
5.3
14.0
2.0
FY2017E
2,415
14.4
214
11.0
21.3
23.0
4.6
11.9
1.7
Lupin (CMP: `1,729/ TP: /Upside: )
For 1QFY2016, the company, announced numbers lower than expected. On sales
front the company, posted a dip of 6.4% yoy to end the period at `3,074cr V/s
`3,600cr expected. Overall, the formulation (`2,748.6cr) posted a sales dip of
8.0% and API (`325.7cr) an 11% yoy growth. The formulation sales dipped, on
back of US (`1,109.6cr) posted a 26% yoy dip, on back of few launches and base
impact. Another export destination Japan (`323.1cr), posted a yoy dip of 5.0%,
mainly on back of currency. Sales in JPY terms grew 6% to JPY 6,178mn during
the quarter from JPY 5,823mn. Lupin’s sale to Europe (`85.6cr) and India
(`885.1cr) posted a yoy growth of 21% and 16% respectively. ROW (`182.6cr)
posted a strong growth of 44% in 1QFY2016.
On the operating front, the gross margins came in at 68.0% V/s 65.5% expected
and V/s 67.9% in corresponding period. However, EBITDA margins came in at
24.2% V/s 27.0% expected V/s 32.2% in 1QFY2015. This was mainly on back of
lower sales and the R&D expenditure, which rose by 28.4% yoy to end the period
at 10.2% in 1QFY2016 V/s 7.4% in 1QFY2015. The other income during the
quarter rose to `151.1cr V/s `85.1cr in 1QFY2015, also the Tax as % of PBT rose
by 33.3% V/s 39.0% in 1QFY2015. Consequently, the PAT came in at `525.5cr
V/s `749cr expected and `624cr in 1QFY2015, an expected a yoy de-growth of
16.0%. We maintain our neutral rating on the stock.
Y/E
Sales OPM
PAT
EPS ROE P/E P/BV EV/EBITDA EV/Sales
March
(` cr)
(%)
(` cr)
(`)
(%)
(x)
(x)
(x)
(x)
FY2016E
15,175
26.9
2,852
63.4
27.2
27.2
6.7
18.3
4.9
FY2017E
17,614
26.9
3,267
72.7
24.9
23.8
5.3
15.3
4.1
Wipro (CMP: `588/ TP: `753/Upside: 28.0%)
Wipro announced 1QFY2016 results. The company posted a 1.1% qoq in USD IT
Services revenues to end the period at US$1,794.1mn V/s US$1,775mn in
4QFY2015 and US$1,770mn expected. The guidance for the 1QFY2016 was
US$1,765-1,793mn, a (0.5)-1% qoq growth. Thus results have come, at the upper
end of the guidance. In rupee terms, the revenues came in at `12,238cr V/s
`12,207cr expected and `12,142cr in 4QFY2015.
Market Outlook
July 24, 2015
On Constant Currency (CC), the company posted a
0.2% qoq growth in
1QFY2016. On CC basis, the key verticals, which posted a qoq dip was
Healthcare, Life Sciences & Services, Global Media & Telecom and Energy,
Natural Resources & Utilities, which dipped 3.9%, 1.8% and 3.0% respectively.
The, domains which posted growth was Retail, Consumer Goods & Transportation,
Manufacturing & Hitech and Finance Solutions, was 4.5%, 2.1% and 1.3% qoq
respectively.
In terms of geography, the USA posted a 2.6% qoq CC growth, while India &
Middle East business and APAC and Other Emerging Markets, posted a 1.7% qoq
and 0.4% qoq CC growth respectively. The geography, which posted the dip on
CC basis, is 5.3% qoq.
On the EBDITA margin front, the EBDITA came in at 21.3% V/s 23.0% expected
and EBIT at 18.5% V/s 20.0% expected. Thus the EBDITA and EBIT have posted a
169bps and 144bps qoq dip respectively. The IT services, EBIT margins came in at
21.0%. The margin dip was mainly on back of currency impact and higher wage
hikes. On operating front the utilization level was 71.3% v/s 70.5%, with attrition
levels at 16.4% V/s 15.6%.Consequently; the PAT came in at `2,188cr V/s
`2,261cr expected and `2,272cr in 4QFY2015 a dip of 3.7% qoq.
In terms of client additions, the company added 36 clients during the quarter and
for 2QFY2016, the company expects revenues from our IT Services business to be
in the range of US$1,821mn-US$1,857mn, implying a 1.5-3.5% growth qoq, with
expectations that the worst is over in the Energy, Natural Resources & Utilities
domain and Healthcare, Life Sciences & Services expected to bounce back in
2QFY2016. We maintain our buy rating on the stock with a target price of `753.
Y/E
Sales OPM
PAT
EPS ROE P/E P/BV EV/EBITDA EV/Sales
March
(` cr)
(%)
(` cr)
(`)
(%)
(x)
(x)
(x)
(x)
FY2016E
54,050
23.7
9,737
39.4
19.9
14.9
3.0
9.7
2.2
FY2017E
61,617
23.8
10,901
44.1
18.8
13.3
2.7
7.9
1.8
Result Preview
Axis Bank (CMP: `583 / TP: `716 / Upside: 22.7%)
Axis Bank is slated to announce its 1QFY2016 results today. We expect the bank to
report a healthy NII growth of 18.7% yoy to `3,929cr, primarily on back of healthy
advance growth of 22.5% yoy. Non-interest income is expected to grow at 20.7%
yoy at `2,041cr. Operating expenses are expected to increase by 21.6% yoy to
`2,560cr, while provisioning expenses are expected to be lower by 2% yoy to
`379cr. Hence, we expect the bank to report healthy PAT growth of 18.9% yoy
during the quarter to `1,983cr. At the CMP, the stock is trading at 2.3x FY2017E
ABV. We recommend a BUY rating on the stock with a target price of `716.
Y/E
Op. Inc
NIM
PAT
EPS ABV ROA ROE
P/E P/ABV
March
(` cr)
(%)
(` cr)
(`)
(%)
(x)
(x)
(x)
(x)
FY2016E
26,806
3.5
9,030
38.1
215.0
1.8
19.0
15.4
2.7
FY2017E
32,298
3.6
11,089
46.8
251.3
1.9
20.1
12.5
2.3
Market Outlook
July 24, 2015
TVS Motors Ltd (CMP: `263/ TP: /Upside: )
TVS Motors is slated to announce 1QFY2016 results today. We expect the topline
to grow 14% yoy to `2,633cr. While the volumes have grown 5% yoy, we estimate
the realization/vehicle to improve 9% on account of better product mix. Operating
margins are estimated to improve 80 bp yoy to 6.5%. Better product mix coupled
with subdued raw material costs is likely to drive profitability. We estimate the Net
Profit to grow 37% yoy to `99cr. We currently have Neutral rating on the stock.
Y/E
Sales OPM
PAT
EPS ROE P/E P/BV EV/EBITDA EV/Sales
March
(` cr)
(%)
(` cr)
(`)
(%)
(x)
(x)
(x)
(x)
FY2016E
11,813
7.0
523
11.0
25.9
24.0
6.2
15.4
1.0
FY2017E
14,001
8.1
779
16.4
30.2
16.1
4.9
10.9
0.8
Quarterly Bloomberg Brokers Consensus Estimate
ABB India Ltd- July 24, 2015
Particulars (` cr)
2QFY16E
2QFY15
y-o-y (%)
1QFY15
q-o-q (%)
Net sales
1,940
1,794
8.1
1,785
8.7
EBITDA
147
126
16.7
144
2.2
EBITDA margin (%)
7.6
7.0
8.0
Net profit
63
48
32.2
54
16.1
Crompton Greaves Ltd (Consol)- July 24, 2015
Particulars (` cr)
1QFY16E
1QFY15
y-o-y (%)
4QFY15
q-o-q (%)
Net sales
3,476
3,442
1.0
3,808
(8.7)
EBITDA
176
173
2.1
147
20.0
EBITDA margin (%)
5.1
5.0
3.9
Net profit
72
64
12.4
(199)
0.0
Axis Bank Ltd- July 24, 2015
Particulars (` cr)
1QFY16E
1QFY15
y-o-y (%)
4QFY15
q-o-q (%)
PAT
1,963
1,667
17.8
2,181
(10.0)
Reliance Industries Ltd- July 24, 2015
Particulars (` cr)
1QFY16E
1QFY15
y-o-y (%)
4QFY15
q-o-q (%)
Net sales
67,939
96,351
(29.5)
56,043
21.2
EBITDA
8,963
7,530
19.0
8,629
3.9
EBITDA margin (%)
13.2
7.8
15.4
Net profit
6,250
5,649
10.6
6,243
0.1
Tech Mahindra Ltd (Consol)- July 27, 2015
Particulars (` cr)
1QFY16E
1QFY15
y-o-y (%)
4QFY15
q-o-q (%)
Net sales
6,218
5,122
21.4
6,117
1.7
EBITDA
923
928
(0.6)
928
(0.6)
EBITDA margin (%)
14.8
18.1
15.2
Net profit
593
631
(6.0)
472
25.6
Market Outlook
July 24, 2015
Economic and Political News
States initiate steps on district-level foundations for mining affected villages
Pellet makers seek rollback of export duty
Mineral auctions to take off in Odisha by October end
Corporate News
Madras HC allows Sun TV to participate in FM auction
DLF starts phased payment plan in Gurgaon project
SpiceJet, Qatar talks may lead to stake sale
Top Picks
Large Cap
Market Cap
CMP
Target
Upside
Company
Sector
Rating
(` Mn)
(`)
(`)
(%)
Axis Bank
Financials
1,38,699
Buy
584
716
22.6
ICICI Bank
Financials
1,81,624
Buy
313
392
25.3
Infosys
IT
2,52,400
Buy
1,099
1,306
18.9
Power Grid
Power
74,367
Buy
142
170
19.6
TCS
IT
4,87,322
Buy
2,488
3,168
27.3
Tech Mahindra
IT
48,114
Buy
500
646
29.1
Yes Bank
Financials
34,452
Buy
824
1,006
22.1
Ashok Leyland
Auto
23,422 Accumulate
82
88
6.9
LIC Housing Fin.
Financials
25,079 Accumulate
497
553
11.3
MRF
Others
16,168 Accumulate
38,121
43,439
13.9
Source: Angel Research, Bloomberg
Mid Cap
Market
CMP
Target
Upside
Company
Sector
Rating
Cap (` Mn)
(`)
(`)
(%)
Action Const. Equip. Capital Goods
420
Buy
43
54
27.1
Bajaj Electricals
Others
2,828
Buy
281
341
21.5
Hindustan Media Ven. Media
1,831
Buy
250
292
17.0
JK Tyre
Auto Ancillary
2,287
Buy
101
127
25.9
MBL Infrastructures
Construction
1,196
Buy
577
789
36.7
Mangalam Cements Cement
721
Buy
270
349
29.2
MT Educare
Others
454
Buy
114
141
23.7
Radico Khaitan
Others
1,155
Buy
87
112
29.0
Setco Automotive
Auto Ancillary
628
Buy
235
286
21.7
Source: Angel Research, Bloomberg
Market Outlook
July 24, 2015
Result Calendar
Date
Company
July 24, 2015
TVS Motor, ABB, Crompton Greaves, Axis Bank, Reliance Industries, Hitachi
July 25, 2015
Andhra Bank, IOB, Persistent, Sarda Energy, Relaxo, Visaka Industries
July 26, 2015
July 27, 2015
Subros, KEC International, Ambuja Cements, Tech Mahindra, Jagran Prakashan, MRF
Maruti, Thermax, Blue Star, HDFC, Punjab Natl.Bank, Bank of India, Union Bank, IDBI Bank, Syndicate Bank, Tide
July 28, 2015
Water Oil India
United Phosphorus, Yes Bank, Allahabad Bank, Nestle, Dabur India, Godrej Consumer, Mphasis, Sesa Goa, JSW Steel
July 29, 2015
, Essar Oil, NHPC
Exide Industries, Kotak Mah. Bank, Bank of Baroda, IDFC, Oriental Bank, Dena Bank, ITC, Colgate, Electrosteel
July 30, 2015
Castings, Petronet LNG, Jyothy Laboratories, HSIL, L G Balakrishnan & Bros, Dr Reddy's, Glenmark Pharma., Ipca
labs, Indoco Remedies, NTPC
July 31, 2015
Suzlon Energy, ICICI Bank, Shriram Trans., Sun TV Network, GSK Pharma, Alembic Pharma, CESC
August 1, 2015
Transport Corporation of India
Source: Bloomberg, Angel Research
Global economic events release calendar
Date
Time
Country Event Description
Unit
Period
Bloomberg Data
Last Reported Estimated
July 24, 2015
1:00PM Germany PMI Services
Value
Jul P
53.80
54.00
1:00PM Germany PMI Manufacturing
Value
Jul P
51.90
51.90
7:30PM US
New home sales
Thousands
Jun
546.00
547.50
July 28, 2015
2:00PM UK
GDP (YoY)
% Change
2Q A
2.90
2.60
7:30PM US
Consumer Confidence
S.A./ 1985=100
Jul
101.40
100.00
July 29, 2015
11:30PM US
FOMC rate decision
%
Jul 29
0.25
0.25
July 30, 2015
1:25PM Germany Unemployment change (000's)
Thousands
Jul
(1.00)
(5.50)
6:00PM US
GDP Qoq (Annualised)
% Change
2Q A
(0.20)
2.50
August 1, 2015
6:30AM China PMI Manufacturing
Value
Jul
50.20
--
August 3, 2015
2:00PM UK
PMI Manufacturing
Value
Jul
51.40
--
August 4, 2015
11:00AM India
RBI Reverse Repo rate
%
Aug 4
6.25
--
11:00AM India
RBI Repo rate
%
Aug 4
7.25
--
11:00AM India
RBI Cash Reserve ratio
%
Aug 4
4.00
--
August 6, 2015
4:30PM UK
BOE Announces rates
% Ratio
Aug 6
0.50
0.50
2:00PM UK
Industrial Production (YoY)
% Change
Jun
2.10
--
August 7, 2015
6:00PM US
Change in Nonfarm payrolls
Thousands
Jul
223.00
--
6:00PM US
Unnemployment rate
%
Jul
5.30
--
August 8, 2015
China
Exports YoY%
% Change
Jul
2.80
--
August 9, 2015
7:00AM China Consumer Price Index (YoY)
% Change
Jul
1.40
--
August 10, 2015
India
Imports YoY%
% Change
Jul
(13.40)
--
India
Exports YoY%
% Change
Jul
(15.80)
--
August 12, 2015
2:00PM UK
Jobless claims change
% Change
Jul
7.00
--
11:00AM China Industrial Production (YoY)
% Change
Jul
6.80
--
5:30PM India
Industrial Production YoY
% Change
Jun
2.70
--
Source: Bloomberg, Angel Research
Market Outlook
July 24, 2015
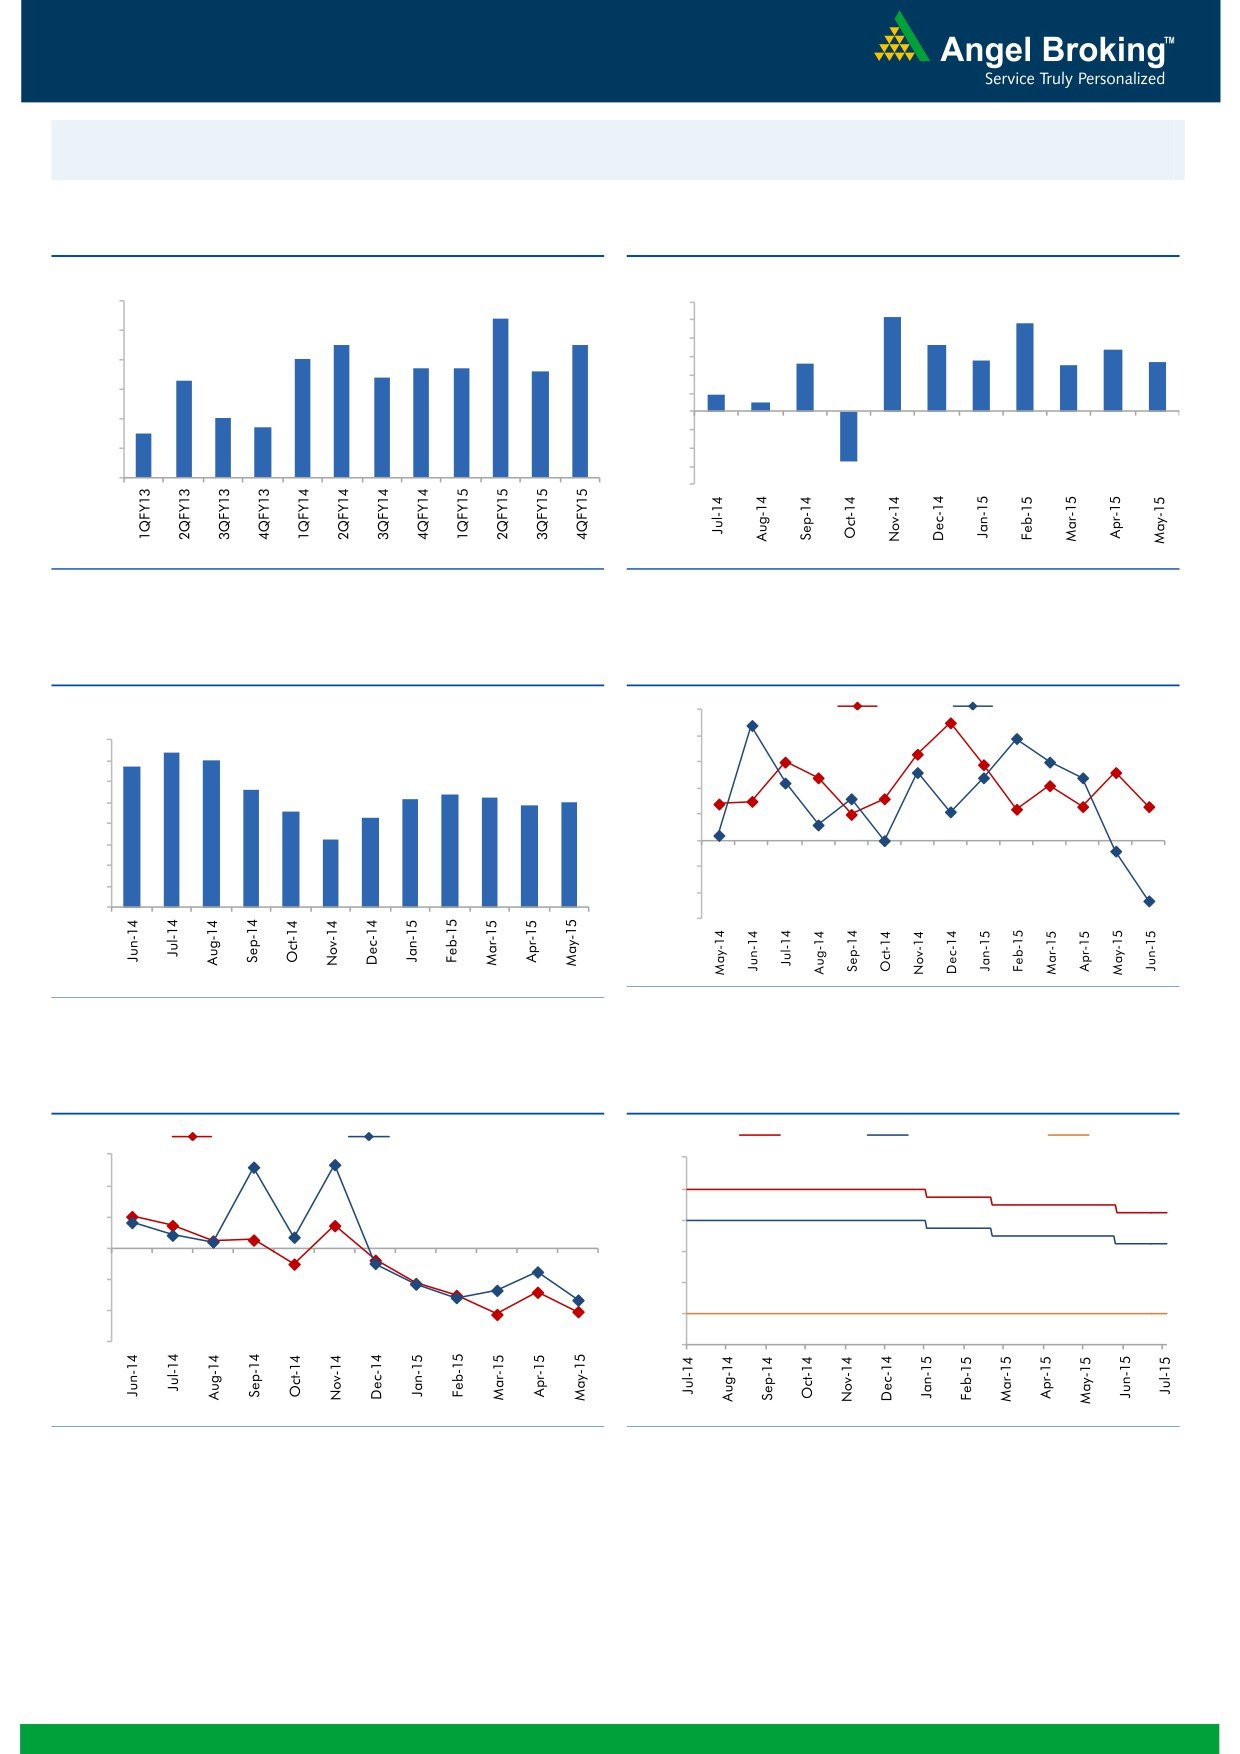
Macro watch
Exhibit 1: Quarterly GDP trends
Exhibit 2: IIP trends
(%)
(%)
9.0
8.4
6.0
5.2
4.8
5.0
8.0
7.5
7.5
3.6
3.4
7.0
4.0
2.8
2.7
6.7
6.7
2.6
2.5
6.6
3.0
7.0
6.3
6.4
2.0
0.9
6.0
0.5
1.0
5.0
4.7
-
5.0
4.5
(1.0)
4.0
(2.0)
(3.0)
3.0
(2.7)
(4.0)
Source: CSO, Angel Research
Source: MOSPI, Angel Research
Exhibit 3: Monthly CPI inflation trends
Exhibit 4: Manufacturing and services PMI
(%)
55.0
Mfg. PMI
Services PMI
8.0
7.4
54.0
6.8
7.0
7.0
53.0
5.6
5.4
6.0
5.2
5.3
4.9
5.0
52.0
4.6
5.0
4.3
51.0
4.0
3.3
50.0
3.0
2.0
49.0
1.0
48.0
-
47.0
Source: Market, Angel Research; Note: Level above 50 indicates expansion
Source: MOSPI, Angel Research
Exhibit 5: Exports and imports growth trends
Exhibit 6: Key policy rates
(%)
Exports yoy growth
Imports yoy growth
(%)
Repo rate
Reverse Repo rate
CRR
30.0
9.00
20.0
8.00
10.0
7.00
0.0
6.00
(10.0)
5.00
(20.0)
4.00
(30.0)
3.00
Source: Bloomberg, Angel Research
Source: RBI, Angel Research
Market Outlook
July 24, 2015
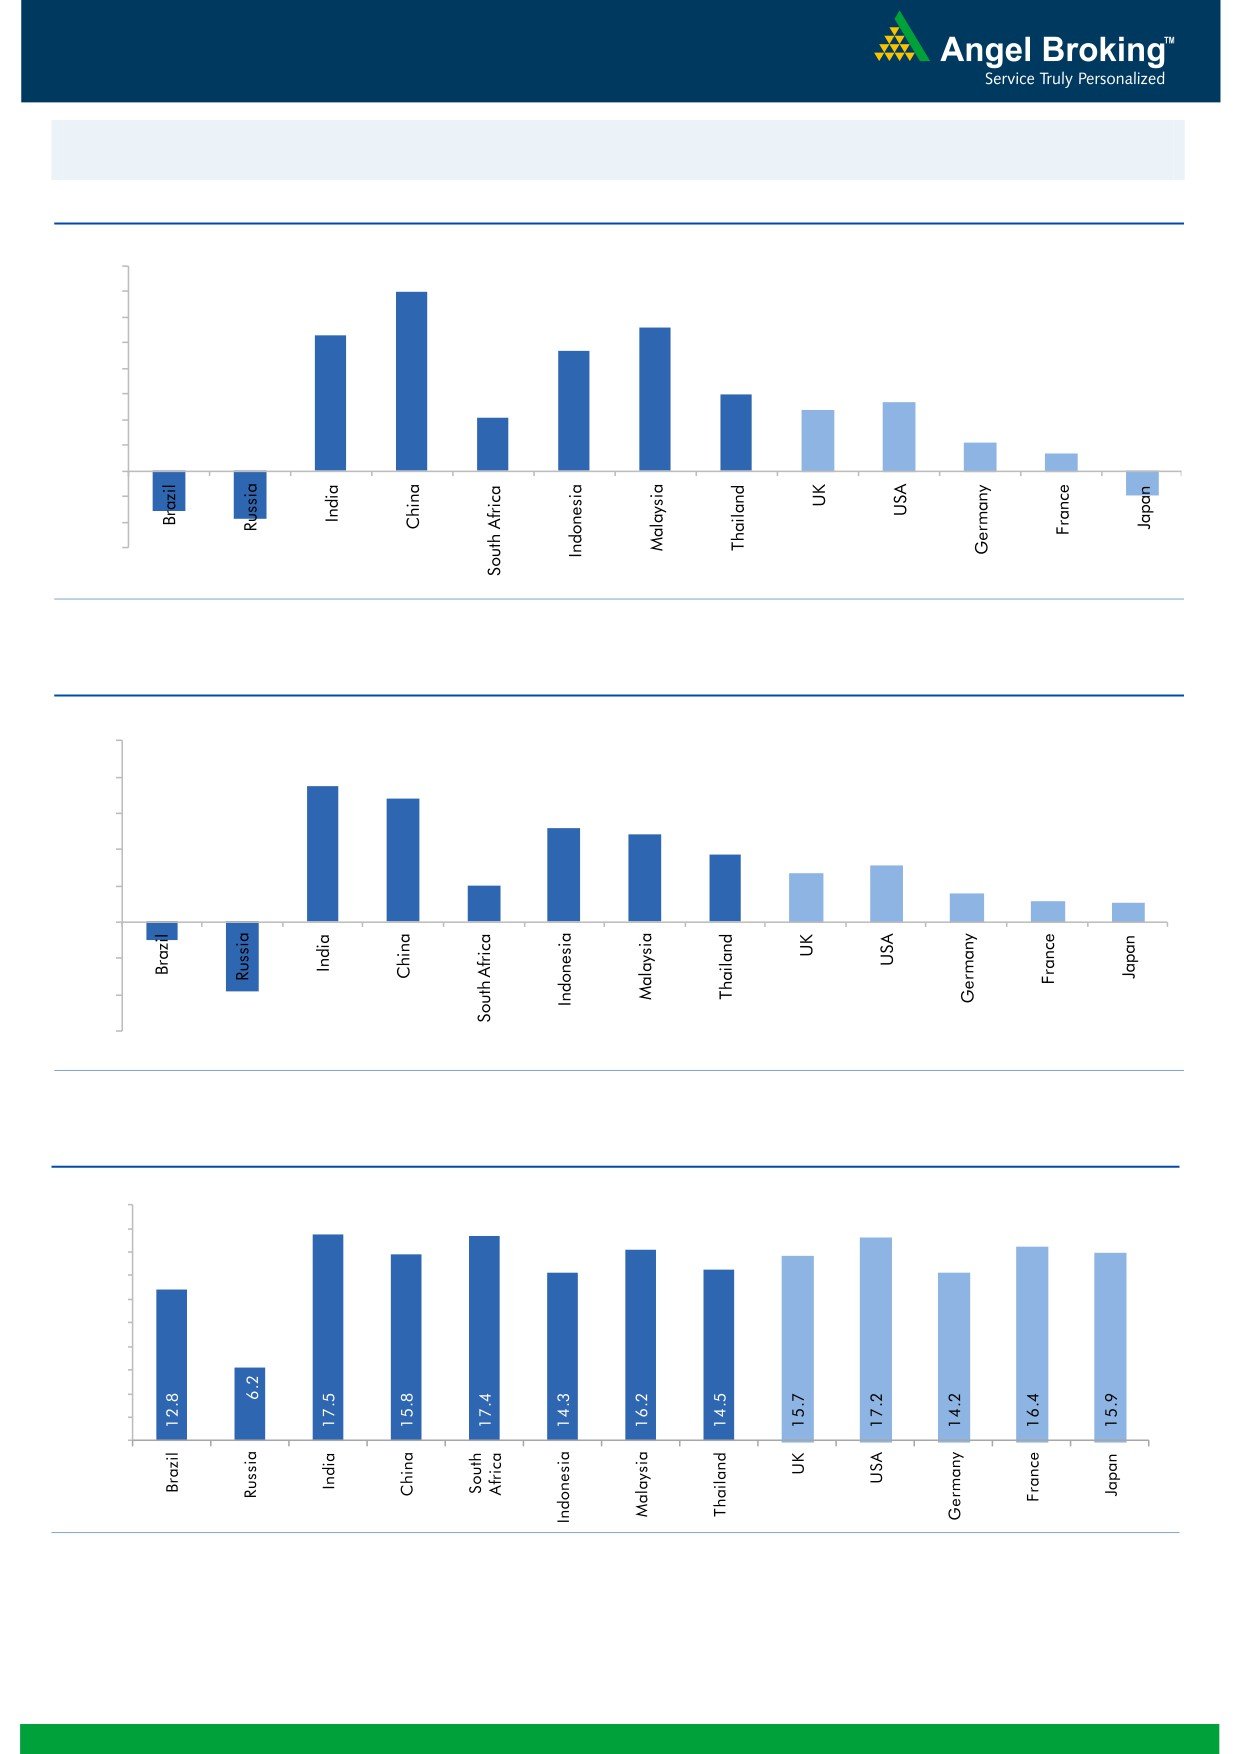
Global watch
Exhibit 1: Latest quarterly GDP Growth (%, yoy) across select developing and developed countries
(%)
8.0
7.0
7.0
5.6
6.0
5.3
4.7
5.0
4.0
3.0
2.7
3.0
2.4
2.1
2.0
1.1
0.7
1.0
(1.6)
(1.9)
(0.9)
-
(1.0)
(2.0)
(3.0)
Source: Bloomberg, Angel Research
Exhibit 2: 2015 GDP Growth projection by IMF (%, yoy) across select developing and developed countries
(%)
10.0
7.5
8.0
6.8
6.0
5.2
4.8
3.7
4.0
3.1
2.7
2.0
1.6
2.0
1.2
1.0
(1.0)
(3.8)
-
(2.0)
(4.0)
(6.0)
Source: IMF, Angel Research
Exhibit 3: One year forward P-E ratio across select developing and developed countries
(x)
20.0
18.0
16.0
14.0
12.0
10.0
8.0
6.0
4.0
2.0
-
Source: Bloomberg, Angel Research
Market Outlook
July 24, 2015
Exhibit 4: Relative performance of indices across globe
Returns (%)
Country
Name of index
Closing price
1M
3M
1YR
Brazil
Bovespa
49,807
(7.5)
(7.4)
(13.6)
Russia
Micex
1,616
(2.5)
(4.0)
14.9
India
Nifty
8,590
2.5
2.3
15.2
China
Shanghai Composite
4,124
(11.8)
(6.3)
100.1
South Africa
Top 40
46,649
(0.8)
(2.5)
(0.2)
Mexico
Mexbol
44,836
(1.4)
(1.3)
1.4
Indonesia
LQ45
840
(2.2)
(11.7)
(3.3)
Malaysia
KLCI
1,722
(0.8)
(7.6)
(9.0)
Thailand
SET 50
949
(4.1)
(8.7)
(7.1)
USA
Dow Jones
17,732
(2.1)
(1.7)
3.8
UK
FTSE
6,655
(2.6)
(5.3)
(2.0)
Japan
Nikkei
20,684
(1.3)
4.6
33.4
Germany
DAX
11,512
(0.3)
(3.0)
18.0
France
CAC
5,087
0.6
(1.8)
16.5
Source: Bloomberg, Angel Research
Market Outlook
July 24, 2015
Stock Watch
Company Name
Reco
CMP
Target
Mkt Cap
Sales ( Čcr )
OPM(%)
EPS (Č)
PER(x)
P/BV(x)
RoE(%)
EV/Sales(x)
(Č)
Price ( Č)
( Č cr )
FY16E FY17E
FY16E
FY17E
FY16E
FY17E
FY16E
FY17E
FY16E
FY17E
FY16E
FY17E
FY16E
FY17E
Agri / Agri Chemical
Rallis
Neutral
253
-
4,912
2,075
2,394
14.4
14.4
9.5
11.0
26.6
23.0
5.3
4.6
21.1
21.3
2.4
2.1
United Phosphorus
Neutral
542
-
23,211
13,698
15,752
17.6
17.6
32.1
38.5
16.9
14.1
3.3
2.7
21.4
21.3
1.8
1.5
Auto & Auto Ancillary
Ashok Leyland
Accumulate
82
88
23,422
17,094
19,726
9.5
10.7
2.7
4.2
30.5
19.6
4.2
3.9
13.9
19.8
1.3
1.1
Bajaj Auto
Neutral
2,488
-
71,987
25,664
29,609
18.8
18.6
134.2
150.3
18.5
16.6
5.7
4.9
30.7
29.6
2.5
2.2
Eicher Motors
Neutral
20,538
-
55,746
11,872
15,783
15.5
17.8
399.4
642.0
51.4
32.0
16.8
12.1
32.3
37.7
4.7
3.5
Hero Motocorp
Neutral
2,714
-
54,201
29,771
34,219
13.0
13.5
142.3
165.2
19.1
16.4
6.9
5.9
36.3
35.8
1.7
1.4
L G Balakrishnan & Bros Accumulate
506
541
795
1,254
1,394
11.6
11.8
35.9
41.7
14.1
12.2
1.9
1.7
13.5
13.8
0.7
0.7
Mahindra and Mahindra Neutral
1,358
-
84,366
41,078
46,473
11.5
12.0
51.4
62.7
26.4
21.7
3.9
3.4
14.7
15.9
1.8
1.5
Maruti
Accumulate
4,236
4,399
127,951
57,615
68,166
15.6
15.5
180.2
220.0
23.5
19.3
4.6
4.0
19.7
20.6
2.0
1.6
Minda Industries
Buy
553
652
878
2,500
2,889
7.6
8.3
39.4
54.3
14.0
10.2
2.0
1.7
14.1
16.3
0.5
0.4
Rane Brake Lining
Accumulate
347
366
275
454
511
11.1
11.4
23.8
28.1
14.6
12.4
2.1
1.9
14.2
15.3
0.7
0.7
Setco Automotive
Buy
235
286
628
718
862
13.3
14.3
13.4
19.0
17.5
12.4
2.7
2.3
15.4
18.5
1.1
1.0
Tata Motors
Buy
401
489
115,878
260,543
278,575
13.3
13.7
31.7
38.0
12.7
10.6
1.5
1.3
12.2
13.0
0.6
0.6
TVS Motor
Neutral
263
-
12,511
11,813
14,001
7.0
8.1
11.0
16.4
23.9
16.1
6.2
4.9
25.9
30.2
1.0
0.8
Amara Raja Batteries
Neutral
870
-
14,860
5,355
6,641
17.4
17.8
31.8
40.9
27.4
21.3
6.9
5.4
25.2
25.5
2.7
2.2
Exide Industries
Accumulate
153
164
12,975
7,919
9,028
13.9
14.4
7.3
8.6
20.9
17.8
2.9
2.6
13.8
14.4
1.4
1.2
Apollo Tyres
Neutral
197
-
10,035
12,866
13,892
15.7
15.4
20.1
19.9
9.8
9.9
1.6
1.4
15.8
13.6
0.8
0.8
Ceat
Neutral
806
-
3,258
6,047
6,776
12.4
12.0
82.0
90.4
9.8
8.9
1.6
1.4
16.5
15.7
0.7
0.6
JK Tyres
Buy
101
127
2,287
7,774
8,456
13.3
12.9
17.3
18.1
5.8
5.6
1.3
1.1
22.8
19.7
0.6
0.6
Swaraj Engines
Neutral
885
-
1,099
604
689
14.3
14.5
51.4
60.7
17.2
14.6
4.0
3.6
23.4
24.7
1.6
1.4
Subros
Accumulate
81
80
486
1,295
1,533
11.7
12.0
4.2
7.3
19.3
11.1
1.5
1.3
7.7
12.4
0.7
0.5
Indag Rubber
Buy
198
247
519
283
329
17.0
17.2
13.0
15.4
15.3
12.8
3.3
2.8
21.8
21.6
1.4
1.2
Capital Goods
ACE
Buy
43
54
421
660
839
4.7
8.2
1.0
3.9
42.5
10.9
1.3
1.2
3.2
11.3
0.8
0.6
BEML
Accumulate
1,513
1,607
6,302
3,277
4,006
6.0
8.9
29.2
64.3
51.8
23.5
5.7
11.7
2.0
1.6
BGR Energy
Neutral
125
-
901
3,615
3,181
9.5
9.4
16.7
12.4
7.5
10.1
0.7
0.7
10.0
7.0
0.7
0.8
BHEL
Neutral
285
-
69,732
33,722
35,272
10.8
11.7
10.5
14.2
27.1
20.1
2.0
1.9
7.0
9.0
2.1
2.1
Blue Star
Buy
334
391
3,001
3,649
4,209
4.8
5.7
8.5
14.0
39.5
23.9
6.3
5.4
16.3
24.4
0.9
0.8
Crompton Greaves
Accumulate
192
220
12,018
15,252
16,870
5.4
5.6
7.9
10.7
24.3
17.9
3.0
2.6
12.0
15.0
0.9
0.8
Inox Wind
Buy
430
505
9,552
4,980
5,943
17.0
17.5
26.6
31.6
16.2
13.6
35.0
30.0
2.1
1.7
Market Outlook
July 24, 2015
Stock Watch
Company Name
Reco
CMP
Target
Mkt Cap
Sales ( Čcr )
OPM(%)
EPS (Č)
PER(x)
P/BV(x)
RoE(%)
EV/Sales(x)
(Č)
Price ( Č)
( Č cr )
FY16E
FY17E
FY16E
FY17E
FY16E
FY17E
FY16E
FY17E
FY16E
FY17E
FY16E
FY17E
FY16E
FY17E
Capital Goods
KEC International
Neutral
151
-
3,878
8,791
9,716
6.1
6.8
5.4
8.2
27.9
18.4
2.8
2.6
10.0
14.0
0.7
0.6
Thermax
Neutral
1,058
-
12,609
6,413
7,525
7.4
8.5
30.5
39.3
34.7
26.9
5.3
4.6
15.0
17.0
1.9
1.6
Cement
ACC
Accumulate
1,424
1,548
26,727
11,856
14,092
14.5
17.8
47.6
76.2
29.9
18.7
3.1
2.8
10.6
15.7
2.1
1.7
Ambuja Cements
Neutral
244
-
37,936
10,930
12,022
22.2
23.2
9.7
11.2
25.2
21.8
3.5
3.2
14.3
15.2
3.1
2.8
India Cements
Buy
86
132
2,640
4,716
5,133
14.9
15.8
1.0
4.5
86.0
19.1
0.9
0.9
1.0
4.5
0.9
0.8
JK Cement
Buy
612
778
4,282
4,061
4,748
16.2
17.7
24.5
42.9
25.0
14.3
2.4
2.1
10.0
15.9
1.5
1.2
J K Lakshmi Cement
Buy
329
443
3,871
3,004
3,618
17.6
19.9
13.9
27.2
23.7
12.1
2.7
2.3
11.8
20.5
1.7
1.4
Mangalam Cements
Buy
270
349
721
1,111
1,336
12.2
15.1
16.3
34.6
16.6
7.8
1.3
1.2
8.2
16.0
0.9
0.7
Orient Cement
Neutral
187
-
3,826
2,039
2,573
22.7
24.5
9.3
13.3
20.1
14.0
3.5
2.9
18.3
22.6
2.5
1.9
Ramco Cements
Neutral
355
-
8,460
4,036
4,545
20.8
21.3
15.1
18.8
23.5
18.9
2.9
2.6
12.9
14.3
2.6
2.2
Shree Cement^
Neutral
10,889
-
37,934
7,150
8,742
26.7
28.6
228.0
345.5
47.8
31.5
7.0
5.9
15.7
20.3
5.0
4.0
UltraTech Cement
Neutral
3,240
-
88,912
27,562
31,548
20.3
22.0
111.0
145.0
29.2
22.4
4.1
3.5
15.1
17.0
3.3
2.8
Construction
ITNL
Buy
148
211
3,643
7,589
8,021
34.0
35.9
16.0
19.0
9.2
7.8
0.6
0.5
6.5
6.7
3.6
3.8
KNR Constructions
Neutral
579
-
1,628
915
1,479
14.3
13.9
20.3
37.2
28.5
15.6
2.6
2.3
9.6
15.6
1.9
1.2
Larsen & Toubro
Accumulate
1,831
2,013
170,370
68,920
82,446
10.9
11.5
57.0
73.0
32.1
25.1
2.9
2.7
13.6
15.5
2.7
2.3
Gujarat Pipavav Port
Neutral
222
-
10,749
793
694
53.0
50.9
9.0
8.0
24.7
27.8
5.4
4.4
25.9
18.4
13.5
15.4
MBL Infrastructures
Buy
577
789
1,196
2,507
2,986
12.4
14.4
43.0
41.0
13.4
14.1
1.6
1.5
12.6
12.7
1.2
1.1
PNC Infratech
Accumulate
420
445
2,152
1,719
2,003
13.0
13.5
21.0
28.0
20.0
15.0
1.7
1.5
11.0
10.9
1.3
1.1
Financials
Allahabad Bank
Neutral
89
-
5,085
8,859
9,817
3.0
3.0
23.7
30.1
3.8
3.0
0.5
0.4
10.6
12.3
-
-
Axis Bank
Buy
584
716
138,699
26,522
31,625
3.6
3.6
36.2
45.4
16.1
12.9
3.2
2.7
18.2
19.6
-
-
Bank of Baroda
Neutral
153
-
33,770
18,934
21,374
2.0
2.0
13.2
15.1
11.6
10.1
0.9
0.8
7.1
7.7
-
-
Bank of India
Neutral
173
-
11,476
17,402
20,003
2.0
2.1
40.3
50.7
4.3
3.4
0.4
0.4
9.0
10.4
-
-
Canara Bank
Neutral
285
-
14,657
15,805
17,745
2.0
2.2
64.3
73.5
4.4
3.9
0.5
0.4
10.8
11.3
-
-
Dena Bank
Neutral
44
-
2,466
3,580
4,040
2.1
2.2
8.4
10.9
5.3
4.0
0.5
0.4
6.8
8.4
-
-
Federal Bank
Neutral
70
-
12,004
3,522
4,045
3.2
3.2
12.2
14.1
5.7
5.0
0.7
0.6
12.9
13.4
-
-
HDFC
Neutral
1,349
-
212,701
11,198
13,321
3.5
3.5
45.1
53.7
29.9
25.1
6.2
5.5
27.2
28.2
-
-
HDFC Bank
Accumulate
1,107
1,255
278,069
38,629
47,500
4.5
4.7
52.6
66.4
21.1
16.7
3.9
3.3
19.6
21.2
-
-
ICICI Bank
Buy
313
392
181,624
36,037
41,647
3.5
3.6
22.9
26.7
13.6
11.7
2.3
2.0
15.7
15.9
-
-
IDBI Bank
Neutral
64
-
10,281
9,806
11,371
1.7
1.9
10.0
16.3
6.5
3.9
0.5
0.4
6.8
10.4
-
-
Market Outlook
July 24, 2015
Stock Watch
Company Name
Reco
CMP
Target
Mkt Cap
Sales ( Čcr )
OPM(%)
EPS (Č)
PER(x)
P/BV(x)
RoE(%)
EV/Sales(x)
(Č)
Price ( Č)
( Č cr )
FY16E FY17E
FY16E
FY17E
FY16E
FY17E
FY16E
FY17E
FY16E
FY17E
FY16E
FY17E
FY16E
FY17E
Financials
Indian Bank
Neutral
135
-
6,482
6,454
7,321
2.5
2.6
26.4
33.3
5.1
4.1
0.4
0.4
8.1
9.6
-
-
LIC Housing Finance
Accumulate
497
553
25,079
2,934
3,511
2.3
2.3
30.9
36.8
16.1
13.5
2.6
2.3
16.8
17.5
-
-
Oriental Bank
Neutral
174
-
5,214
7,930
8,852
2.5
2.5
51.8
57.1
3.4
3.1
0.4
0.3
9.3
9.5
-
-
Punjab Natl.Bank
Neutral
140
-
25,917
24,160
27,777
2.9
3.0
18.5
24.6
7.6
5.7
0.7
0.6
8.8
10.8
-
-
South Ind.Bank
Neutral
23
-
3,159
1,999
2,249
2.4
2.4
3.5
4.0
6.7
5.8
0.8
0.8
12.6
13.1
-
-
St Bk of India
Accumulate
270
297
203,909
86,900
100,550
3.1
3.1
22.1
27.7
12.2
9.7
1.5
1.3
12.7
14.3
-
-
Union Bank
Neutral
163
-
10,363
12,995
14,782
2.4
2.4
32.3
40.9
5.0
4.0
0.6
0.5
10.7
12.3
-
-
Vijaya Bank
Neutral
41
-
3,479
3,474
3,932
1.8
1.9
5.9
7.2
6.9
5.6
0.6
0.5
8.1
9.3
-
-
Yes Bank
Buy
824
1,006
34,452
7,006
8,825
3.1
3.3
61.4
77.1
13.4
10.7
2.5
2.1
20.1
21.3
-
-
FMCG
Asian Paints
Neutral
846
-
81,153
16,553
19,160
16.0
16.2
17.7
21.5
47.9
39.4
12.7
11.4
29.4
31.2
4.7
4.1
Britannia
Neutral
2,854
-
34,246
8,065
9,395
9.6
10.2
47.2
65.5
60.5
43.6
20.1
19.0
38.3
41.2
4.1
3.5
Colgate
Neutral
2,070
-
28,146
4,836
5,490
19.5
19.7
48.5
53.2
42.7
38.9
31.3
27.2
99.8
97.5
5.7
5.0
Dabur India
Neutral
298
-
52,432
9,370
10,265
17.1
17.2
7.3
8.1
40.7
36.9
12.3
10.0
33.7
30.6
5.5
5.0
GlaxoSmith Con*
Neutral
6,332
-
26,630
4,919
5,742
17.2
17.4
168.3
191.2
37.6
33.1
10.7
9.1
28.8
28.9
5.0
4.3
Godrej Consumer
Neutral
1,232
-
41,949
10,168
12,886
16.1
16.1
32.1
38.4
38.4
32.1
7.8
7.2
19.7
21.0
4.2
3.3
HUL
Neutral
905
-
195,858
34,940
38,957
17.5
17.7
20.8
24.7
43.5
36.7
48.4
38.7
110.5
114.2
5.5
4.9
ITC
Buy
315
409
252,710
41,068
45,068
37.8
37.4
13.9
15.9
22.6
19.8
7.6
6.7
34.1
33.8
5.8
5.2
Marico
Neutral
432
-
27,881
6,551
7,766
15.7
16.0
10.4
12.5
41.6
34.6
12.1
10.1
33.2
32.4
4.2
3.5
Nestle*
Accumulate
6,054
6,646
58,367
11,291
12,847
22.2
22.3
158.9
184.6
38.1
32.8
19.9
17.9
55.0
57.3
5.0
4.3
Tata Global
Buy
141
186
8,882
8,735
9,182
9.8
9.9
8.5
9.3
16.6
15.2
2.2
2.1
7.9
8.1
0.9
0.9
IT
HCL Tech^
Accumulate
972
1,100
136,612
41,535
46,519
24.0
23.4
56.6
61.1
17.2
15.9
3.6
2.8
20.8
17.7
3.2
2.8
Infosys
Buy
1,099
1,306
252,400
60,250
66,999
28.0
28.0
58.3
63.7
18.9
17.3
4.0
3.4
20.9
19.7
3.5
3.0
TCS
Buy
2,488
3,168
487,322
108,420
123,559
28.8
28.7
127.2
143.9
19.6
17.3
7.8
7.2
39.9
41.8
4.2
3.6
Tech Mahindra
Buy
500
646
48,114
27,281
31,373
17.3
18.4
30.8
38.0
16.2
13.2
3.3
2.7
20.3
20.9
1.6
1.3
Wipro
Buy
588
753
145,304
54,050
61,617
23.7
23.8
39.4
44.1
14.9
13.3
3.0
2.7
19.9
18.8
2.3
1.8
Media
D B Corp
Accumulate
322
356
5,920
2,241
2,495
27.8
27.9
21.8
25.6
14.8
12.6
3.9
3.4
26.7
28.5
2.6
2.3
HT Media
Buy
91
129
2,123
2,495
2,703
13.5
13.6
9.4
10.7
9.7
8.5
1.0
0.9
10.4
10.6
0.4
0.3
Jagran Prakashan
Buy
133
156
4,358
1,939
2,122
26.0
26.0
8.3
9.2
16.1
14.5
2.8
2.5
17.5
17.1
2.2
2.0
Sun TV Network
Accumulate
274
275
10,794
2,779
3,196
70.2
70.5
22.8
27.3
12.0
10.0
3.0
2.7
26.7
28.3
3.4
2.9
Market Outlook
July 24, 2015
Stock Watch
Company Name
Reco
CMP
Target
Mkt Cap
Sales ( Čcr )
OPM(%)
EPS (Č)
PER(x)
P/BV(x)
RoE(%)
EV/Sales(x)
(Č)
Price ( Č)
( Č cr )
FY16E FY17E
FY16E
FY17E
FY16E
FY17E
FY16E
FY17E
FY16E
FY17E
FY16E
FY17E
FY16E
FY17E
Media
Hindustan Media
Buy
250
292
1,831
920
1,031
20.0
20.0
19.2
20.9
13.0
12.0
2.1
1.8
16.4
15.3
1.5
1.3
Ventures
Metals & Mining
Coal India
Neutral
431
-
272,362
77,595
89,628
22.9
24.4
27.6
30.0
15.6
14.4
6.7
6.7
33.9
33.2
2.8
2.5
Hind. Zinc
Neutral
166
-
70,056
15,546
16,821
47.5
49.0
19.7
20.3
8.4
8.2
1.4
1.2
17.2
16.6
2.2
1.7
Hindalco
Neutral
109
-
22,415
112,328
119,817
7.7
7.9
16.3
20.1
6.7
5.4
0.5
0.5
8.0
8.5
0.7
0.6
JSW Steel
Neutral
858
-
20,745
48,125
53,595
18.8
21.0
46.9
97.5
18.3
8.8
0.9
0.8
4.4
9.5
1.2
1.1
NMDC
Neutral
114
-
45,337
12,544
13,330
59.5
59.7
16.3
16.5
7.0
6.9
1.3
1.2
5.1
9.9
2.3
2.3
SAIL
Neutral
59
-
24,244
56,365
63,383
6.9
8.0
7.1
8.2
8.2
7.2
0.5
0.5
7.0
7.1
1.0
0.9
Vedanta
Neutral
136
-
40,172
81,842
88,430
30.6
32.8
20.2
25.7
6.7
5.3
0.5
0.4
7.5
8.5
0.9
0.7
Tata Steel
Neutral
270
-
26,252
136,805
149,228
11.3
11.9
26.4
36.8
10.2
7.4
0.8
0.8
6.0
8.0
0.7
0.7
Oil & Gas
Cairn India
Neutral
177
-
33,241
12,617
14,513
33.7
40.0
25.5
27.7
7.0
6.4
0.5
0.5
7.4
7.7
1.1
0.9
GAIL
Neutral
370
-
46,896
75,595
85,554
8.6
8.0
31.8
36.1
11.6
10.2
1.3
1.2
10.7
11.4
0.8
0.6
ONGC
Neutral
284
-
242,805
174,773
192,517
22.7
24.8
34.6
38.2
8.2
7.4
1.2
1.1
14.2
14.9
1.5
1.3
Petronet LNG
Neutral
200
-
14,989
45,759
49,386
3.7
4.0
12.6
14.9
15.9
13.4
2.4
2.2
16.1
16.7
0.4
0.3
Reliance Industries
Neutral
1,046
-
338,549
339,083
384,014
7.8
9.5
75.7
94.5
13.8
11.1
1.4
1.3
10.7
12.2
1.3
1.2
Pharmaceuticals
Alembic Pharma
Neutral
758
-
14,292
2,405
2,859
19.9
20.4
17.7
22.0
42.8
34.5
12.3
9.4
32.6
30.9
6.1
5.0
Aurobindo Pharma
Accumulate
746
824
43,575
14,435
16,600
22.6
22.6
36.1
41.2
20.7
18.1
6.1
4.7
34.5
29.3
3.4
2.9
Aventis*
Neutral
3,771
-
8,684
2,156
2,455
15.1
16.8
109.7
133.9
34.4
28.2
4.7
3.9
18.4
22.5
3.6
3.0
Cadila Healthcare
Neutral
1,955
-
40,026
10,224
11,840
19.7
20.0
69.8
81.0
28.0
24.1
7.4
5.9
26.8
25.3
4.0
3.4
Cipla
Neutral
674
-
54,105
14,051
16,515
18.9
18.7
25.1
28.9
26.8
23.3
4.3
3.7
17.2
16.9
3.9
3.2
Dr Reddy's
Neutral
3,910
-
66,666
17,443
20,296
22.3
22.4
156.7
180.1
25.0
21.7
5.0
4.2
21.8
20.8
3.7
3.1
Dishman Pharma
Buy
167
238
1,346
1,716
1,888
20.2
20.2
16.3
21.6
10.2
7.7
1.0
0.9
9.7
11.7
1.0
0.8
GSK Pharma*
Neutral
3,400
-
28,802
2,818
3,044
18.9
18.9
56.2
58.6
60.5
58.0
17.1
18.6
27.1
30.7
9.8
9.2
Indoco Remedies
Neutral
368
-
3,387
1,088
1,262
18.2
18.2
13.1
15.5
28.1
23.7
5.5
4.6
21.2
21.1
3.2
2.7
Ipca labs
Accumulate
692
736
8,730
3,533
4,109
18.6
19.6
28.2
34.8
24.5
19.9
3.4
2.9
15.0
15.9
2.7
2.3
Lupin
Neutral
1,729
-
77,767
14,864
17,244
26.9
26.9
62.1
71.1
27.8
24.3
6.8
5.4
27.4
24.6
5.3
4.4
Sun Pharma
Accumulate
828
950
199,139
27,839
33,542
27.7
29.7
18.9
26.9
43.8
30.8
3.9
3.5
13.0
14.6
6.6
5.2
Power
Tata Power
Neutral
72
-
19,446
38,302
38,404
14.1
13.1
5.1
6.0
14.0
12.1
1.3
1.3
9.2
10.3
1.4
1.4
NTPC
Neutral
138
-
113,994
89,067
98,329
15.9
16.5
12.1
13.1
11.5
10.6
1.3
1.2
11.0
11.6
2.3
2.3
Power Grid
Buy
142
170
74,367
19,986
22,702
86.2
86.3
11.1
12.7
12.8
11.2
1.7
1.6
14.4
14.7
8.9
8.2
Market Outlook
July 24, 2015
Stock Watch
Company Name
Reco
CMP
Target
Mkt Cap
Sales ( Čcr )
OPM(%)
EPS (Č)
PER(x)
P/BV(x)
RoE(%)
EV/Sales(x)
(Č)
Price ( Č)
( Č cr )
FY16E FY17E
FY16E
FY17E
FY16E
FY17E
FY16E
FY17E
FY16E
FY17E
FY16E
FY17E
FY16E
FY17E
Telecom
Bharti Airtel
Neutral
433
-
172,928
101,748
109,191
32.1
31.7
12.0
12.5
36.1
34.6
2.5
2.3
6.9
6.7
2.4
2.1
Idea Cellular
Neutral
178
-
64,075
34,282
36,941
32.0
31.5
5.9
6.2
30.2
28.7
2.8
2.5
9.9
9.3
2.5
2.3
zOthers
Abbott India
Neutral
4,365
-
9,274
2,713
3,141
13.7
13.5
127.8
145.7
34.1
30.0
8.0
6.5
25.9
23.9
3.1
2.6
Bajaj Electricals
Buy
281
341
2,828
4,719
5,287
5.2
5.8
8.6
12.7
32.8
22.2
3.7
3.3
11.4
14.8
0.6
0.5
Finolex Cables
Neutral
266
-
4,066
2,728
3,036
10.8
11.0
14.4
16.8
18.5
15.9
2.8
2.4
15.2
15.3
1.2
1.0
Goodyear India*
Neutral
577
-
1,330
1,536
1,683
9.6
10.0
41.8
48.0
13.8
12.0
2.4
2.1
18.2
18.3
0.6
0.5
Hitachi
Neutral
1,583
-
4,306
1,801
2,051
8.9
9.3
31.0
38.8
51.0
40.8
11.0
8.7
23.9
23.8
2.4
2.1
Jyothy Laboratories
Neutral
325
-
5,891
1,620
1,847
11.5
11.5
7.3
8.5
44.6
38.4
5.8
5.4
13.3
14.4
3.4
2.9
MRF
Buy
38,121
43,439
16,168
13,524
14,440
18.6
18.2
2,999.2
3,102.8
12.7
12.3
2.8
2.3
24.7
20.5
1.1
1.0
Page Industries
Neutral
14,708
-
16,405
1,929
2,450
19.8
20.1
229.9
299.0
64.0
49.2
28.2
19.6
52.1
47.1
8.6
6.7
Relaxo Footwears
Neutral
579
-
6,948
1,767
2,152
12.3
12.5
19.3
25.1
30.1
23.1
7.4
5.7
27.7
27.8
3.8
3.1
Siyaram Silk Mills
Neutral
1,216
-
1,139
1,653
1,873
11.7
12.2
99.3
122.1
12.2
10.0
2.2
1.9
19.5
20.2
0.8
0.7
Styrolution ABS India*
Neutral
733
-
1,290
1,271
1,440
8.6
9.2
32.0
41.1
22.9
17.9
2.3
2.1
10.7
12.4
1.0
0.8
Tree House
Neutral
432
-
1,830
259
324
56.8
56.8
17.0
21.7
25.4
20.0
2.6
2.3
10.1
11.5
7.1
5.8
TVS Srichakra
Neutral
2,444
-
1,871
2,112
2,389
11.9
12.1
168.5
202.5
14.5
12.1
5.0
3.7
39.6
35.5
0.9
0.8
HSIL
Buy
348
434
2,517
2,085
2,436
18.5
18.6
21.7
28.9
16.1
12.1
1.6
1.5
10.0
12.1
1.3
1.1
Kirloskar Engines India
Neutral
286
-
4,135
2,779
3,314
10.3
11.9
12.0
17.5
23.9
16.3
2.9
2.6
12.5
16.7
1.1
0.9
Ltd
M M Forgings
Buy
675
783
815
586
671
22.3
22.9
53.4
65.2
12.6
10.4
2.7
2.2
24.1
23.5
1.5
1.3
Banco Products (India)
Neutral
106
-
756
1,196
1,370
9.7
11.8
9.4
14.3
11.3
7.4
1.1
1.0
10.4
14.5
0.6
0.5
Competent Automobiles Neutral
155
-
95
1,007
1,114
3.1
3.1
23.7
28.2
6.6
5.5
0.9
0.8
13.9
14.6
0.1
0.1
Nilkamal
Neutral
787
-
1,175
1,947
2,131
8.1
8.3
35.7
45.9
22.1
17.1
2.2
2.0
10.3
12.1
0.6
0.6
Visaka Industries
Accumulate
148
166
236
1,158
1,272
8.6
9.5
23.7
32.7
6.3
4.5
0.6
0.6
10.1
12.5
0.4
0.3
Transport Corporation of
Accumulate
267
293
2,020
2,830
3,350
8.8
9.0
14.4
18.3
18.6
14.6
2.9
2.5
15.4
17.1
0.8
0.7
India
Elecon Engineering
Neutral
90
-
978
1,452
1,596
13.7
14.7
4.2
6.2
21.7
14.4
1.7
1.5
8.1
11.2
1.0
0.8
Surya Roshni
Accumulate
139
152
609
2,992
3,223
8.4
8.7
15.2
19.3
9.1
7.2
0.9
0.8
10.1
11.5
0.5
0.5
MT Educare
Buy
114
141
454
275
355
18.3
17.3
7.4
8.8
15.4
12.9
3.1
2.7
20.2
21.1
1.6
1.2
Radico Khaitan
Buy
87
112
1,155
1,565
1,687
11.9
12.4
5.4
6.6
16.0
13.2
1.3
1.2
8.0
9.0
1.2
1.2
Garware Wall Ropes
Accumulate
308
303
674
875
983
10.4
10.5
23.1
27.5
13.3
11.2
1.9
1.6
14.1
14.6
0.7
0.6
Source: Company, Angel Research; Note: *December year end; #September year end; &October year end; Price as on July 23, 2015
Market Outlook
July 24, 2015
Research Team Tel: 022 - 39357800
DISCLAIMER
Angel Broking Private Limited (hereinafter referred to as “Angel”) is a registered Member of National Stock Exchange of India Limited,
Bombay Stock Exchange Limited and MCX Stock Exchange Limited. It is also registered as a Depository Participant with CDSL and
Portfolio Manager with SEBI. It also has registration with AMFI as a Mutual Fund Distributor. Angel Broking Private Limited is a registered
entity with SEBI for Research Analyst in terms of SEBI (Research Analyst) Regulations, 2014 vide registration number INH000000164.
Angel or its associates has not been debarred/ suspended by SEBI or any other regulatory authority for accessing /dealing in securities
Market. Angel or its associates including its relatives/analyst do not hold any financial interest/beneficial ownership of more than 1% in
the company covered by Analyst. Angel or its associates/analyst has not received any compensation / managed or co-managed public
offering of securities of the company covered by Analyst during the past twelve months. Angel/analyst has not served as an officer,
director or employee of company covered by Analyst and has not been engaged in market making activity of the company covered by
Analyst.
This document is solely for the personal information of the recipient, and must not be singularly used as the basis of any investment
decision. Nothing in this document should be construed as investment or financial advice. Each recipient of this document should make
such investigations as they deem necessary to arrive at an independent evaluation of an investment in the securities of the companies
referred to in this document (including the merits and risks involved), and should consult their own advisors to determine the merits and
risks of such an investment.
Reports based on technical and derivative analysis center on studying charts of a stock's price movement, outstanding positions and
trading volume, as opposed to focusing on a company's fundamentals and, as such, may not match with a report on a company's
fundamentals.
The information in this document has been printed on the basis of publicly available information, internal data and other reliable sources
believed to be true, but we do not represent that it is accurate or complete and it should not be relied on as such, as this document is for
general guidance only. Angel Broking Pvt. Limited or any of its affiliates/ group companies shall not be in any way responsible for any
loss or damage that may arise to any person from any inadvertent error in the information contained in this report. Angel Broking Pvt.
Limited has not independently verified all the information contained within this document. Accordingly, we cannot testify, nor make any
representation or warranty, express or implied, to the accuracy, contents or data contained within this document. While Angel Broking
Pvt. Limited endeavors to update on a reasonable basis the information discussed in this material, there may be regulatory, compliance,
or other reasons that prevent us from doing so.
This document is being supplied to you solely for your information, and its contents, information or data may not be reproduced,
redistributed or passed on, directly or indirectly.
Neither Angel Broking Pvt. Limited, nor its directors, employees or affiliates shall be liable for any loss or damage that may arise from or
in connection with the use of this information.
Note: Please refer to the important ‘Stock Holding Disclosure' report on the Angel website (Research Section). Also, please refer to the
latest update on respective stocks for the disclosure status in respect of those stocks. Angel Broking Pvt. Limited and its affiliates may have
investment positions in the stocks recommended in this report.