Market Outlook
June 24, 2016
Market Cues
Domestic Indices
Chg (%)
(Pts)
(Close)
Indian markets’ are likely to open on a Negative note tracing Global cues.
BSE Sensex
0.9
237
27,002
Nifty
0.8
67
8,270
U.S. Markets closed higher Thursday, with all three indexes rallying, as investors
wagered that the U.K. will choose to remain in the European Union in a historic
Mid Cap
0.3
31
11,436
referendum with far-reaching implications.
Small Cap
(0.0)
(4)
11,446
Bankex
1.6
325
20,460
The European markets ended Thursday's session in the green, bringing its winning
streak to five sessions. The gains were fueled by optimism that the U.K. will remain
part of the European Union, following the results of recent polls.
Global Indices
Chg (%)
(Pts)
(Close)
Indian markets rose sharply on Thursday, with sentiment supported by a rally in
Dow Jones
1.3
230
18,011
European markets and gains in rupee, after two new polls suggested the Remain
Nasdaq
1.6
77
4,910
campaign has taken the lead in Britain's referendum on EU membership.
FTSE
1.2
77
6,338
News Analysis
Nikkei
1.1
173
16,238
Hang Seng
0.4
73
20,868
Still a close call on the Leave/Remain EU referendum for UK
Sun Pharma board approves buyback of shares at `900
Shanghai Com
(0.5)
(14)
2,892
Detailed analysis on Pg2
Advances / Declines
BSE
NSE
Investor’s Ready Reckoner
Advances
1,099
618
Key Domestic & Global Indicators
Declines
1,501
954
Stock Watch: Latest investment recommendations on 150+ stocks
Unchanged
189
76
Refer Pg5 onwards
Top Picks
Volumes (` Cr)
CMP
Target
Upside
Company
Sector
Rating
(`)
(`)
(%)
BSE
2,284
Amara Raja
Auto/Auto Ancillary
Buy
866
1,076
24.2
NSE
14,007
HCL Tech
IT
Buy
769
1,000
30.1
LIC Housing
Financials
Buy
487
592
21.4
Net Inflows (` Cr)
Net
Mtd
Ytd
Bharat Electronics
Capital Goods
Accumulate
1,274
1,414
11.0
FII
(32)
4,181
18,550
Navkar Corporation Others
Buy
205
265
29.5
MFs
(7)
32
9,462
More Top Picks on Pg4
Key Upcoming Events
Top Gainers
Price (`)
Chg (%)
Previous
Consensus
Date
Region
Event Description
Albk
64
5.6
Reading
Expectations
June 28 Germany
Unemployment change (000’s)
-11.0
--
Jisljaleqs
71
5.4
June 29 US
GDP QoQ (Annualised)
0.8
1.0
Hexaware
233
5.2
June 30 Euro zone
Euro zone consumer confidence
-7.3
--
Skfindia
1,306
4.7
June 30 UK
GDP (YoY)
2.1
--
Sparc
297
4.2
6.(
More Events on Pg5
Top Losers
Price (`)
Chg (%)
Infratel
323
(4.9)
Aloktext
4
(4.6)
Jubilant
324
(3.2)
Unitech
6
(3.2)
Monsanto
2,507
(2.8)
As on June 23, 2016
Market Outlook
June 24, 2016
Still a close call on the Leave/Remain EU referendum for UK
The much awaited D-day has finally come and as the results from 382 polling
areas start coming in, the tally suggest that it will be a tight finish. As at 8:30am,
the results from 271 areas suggest that Leaves lead with ~51%. Although the
results of the remaining counting areas can swing things in favor of either
campaign, the repercussions for the global markets will be dictated by the final
outcome.
What will happen if UK were to Exit
The main case for the BREXIT camp has been “UK’s chance to get its sovereignty
back” and curbing immigration into the UK. General feeling in the camp has been
that the EU institutions have drained out the power from the British Parliament and
its membership of the EU has made Britain un-governable. If the Leave
campaign were to end up on the winning side, it would mean that UK would
invoke Article 50 of the Lisbon Treaty, which provides for members leaving the EU
and gives the departing member two years to agree terms with the EU.
The consequences of this move are expected to have global implications and also
cast doubts over the stability and future of the EU. UK too is likely to be plunged
into economic instability as the benefits of its saving (from net contribution to the
EU budget) are likely to be negated by the high costs, capital outflow, loss of jobs
and impact its trade. UK would lose its access to the EU single market and would
have to undergo a brutal process of re-negotiating trade terms with the EU
countries as well as the countries trading with the EU. This is critical as the EU
remains the largest market for Britain’s exports, constituting 40-45% of its
exports. This would result in capital outflow from the country as multinational
companies who have setup headquarters in the UK (to tap the EU market) would
likely move out. Many foreign manufacturers have also indicated that they would
shut production facilities in and event of exit which will hurt the job market (as per
various articles ~3mn jobs in the UK are linked to trade with EU). Considering
that the EU will make it hard for UK to negotiate favorable terms (to discourage
similar moves by other EU members) the economic impact on UK as well as global
markets are likely to be severe. On the positive side, its exit from the EU would
mean that UK will have the freedom to negotiate free trade agreements with
ROW/EU and especially growing economies like India and China.
However, if Remain camp were to end up winning the referendum, it would mean
that it will bring closure to fears of uncertain future. In such event, the Indian
markets are expected to open on a positive note (more likely on a marginally
positive note as most of the positive has been discounted by the markets). The
Indian markets will witness a gap down opening if the BREXITTERS win.
Market Outlook
June 24, 2016
Snapshot of various Global Stock and Currencies
Asian Markets
Last Trade
Change
(% chg)
Shanghai
2,845
(46.7)
-1.6%
Nikkei 225
15,742
(496.0)
-3.1%
Hang Seng Index
20,127
(741.4)
-3.6%
Futures
DOW
17,374
(538.0)
-3.0%
DAX
9,585
(800.6)
-7.7%
FTSE 100
5,817
(547.5)
-8.6%
SGX NIFTY
8,099
(201.5)
-2.5%
Currency
USD/INR
68
0.6
0.8%
EUR/USD
1
(0.0)
-2.9%
GBP/USD
1
(0.1)
-8.8%
Source: Angel Research
Sun Pharma board approves buyback of shares at `900
Sun Pharmaceutical Industries Ltd, India’s largest drug maker, on Thursday said it
will buy back 7.5 million shares from the public at a price of `900 each (almost
20% above its current market price).
As on March 2016, promoters and promoter group held 54.97% stake in the
company, while public held 45.02% and the employee trust 0.01%. Under
Securities and Exchange Board of India (Sebi) guidelines, 15% of the buyback offer
is reserved for small investors holding shares worth not more than `2,00,000 as
on the record date.
Sun Pharma is the world’s fifth largest specialty generic pharmaceutical company.
The consolidated revenue for 12 months ending March 2016 is approximately
$4.3 billion, of which US market contributes $2.1 billion.
Economic and Political News
PM Modi to launch works in 20 smart cities on Saturday
India imports cotton from Pakistan as domestic prices climb
FDI reforms, REIT rule relaxations to boost realty sector: CBRE
Corporate News
HDFC invokes 35k USL shares pledged by Kingfisher Finvest
Sun Pharma bets on new products to boost US skincare products growth
Biocon begins clinical trials for drug to treat rare eye disorder
Market Outlook
June 24, 2016
Top Picks ★★★★★
Large Cap
Market Cap
CMP
Target
Upside
Company
Rationale
(` Cr)
(`)
(`)
(%)
To outpace battery industry growth due to better technological
Amara Raja Batteries
14,798
866
1,076
24.2
products leading to market share gains in both the automotive
OEM and replacement segments.
Uptick in defense capex by government, coupled with BELs
Bharat Electronics
30,586
1,274
1,414
11.0
strong market positioning, indicate good times ahead for BEL.
HCL Tech
1,08,431
769
1,000
30.1
Stock is trading at attractive valuations & factors all bad news.
Strong visibility for a robust 20% earnings trajectory, coupled
HDFC Bank
3,01,214
1,190
1,262
6.1
with high quality of earnings on account of high quality retail
business and strategic focus on highly rated corporates.
Back on the growth trend, expect a long term growth of 14% to
Infosys
2,78,286
1,212
1,374
13.4
be a US$20bn in FY2020.
Continues to grow its retail loan book at healthy pace with
LIC Housing Finance
24,597
487
592
21.4
improvement in asset quality. Expect LICHF to post a healthy
loan book which is likely to reflect in a strong earnings growth.
Huge bid pipeline of re-development works at Delhi and other
NBCC
11,229
187
220
17.6
State Governments and opportunity from Smart City, positions
NBCC to report strong growth, going forward.
Strong market positioning within the domestic AC markets to
Voltas
10,605
321
407
27.0
continue, EMP business set to revive
Source: Company, Angel Research
Mid Cap
Market Cap
CMP
Target
Upside
Company
Rationale
(` Cr)
(`)
(`)
(%)
Among the top 4 players in the consumer durables segment.
Bajaj Electricals
2,226
220
268
21.7
Improved profitability backed by turn around in E&P segment.
Strong order book lends earnings visibility.
Favourable outlook for AC industry to augur well for Cooling
Blue Star
3,828
426
495
16.3
products business. EMPPAC division's profitability to improve
once operating environment turns around.
With a focus on the low and medium income (LMI) consumer
Dewan Housing
5,829
200
270
35.2
segment, the company has increased its presence in tier-II & III
cities where the growth opportunity is immense.
Strong loan growth backed by diversified loan portfolio and
Equitas Holdings
5,879
175
235
34.1
adequate CAR. ROE & ROA likely to remain decent as risk of
dilution remains low. Attractive valuations considering growth.
Commencement of new projects, downtrend in the interest rate
IL&FS Transport
2,395
73
93
27.7
cycle, to lead to stock re-rating
Economic recovery to have favourable impact on advertising &
circulation revenue growth. Further, the acquisition of a radio
Jagran Prakashan
5,558
170
205
20.6
business (Radio City) would also boost the company's revenue
growth.
Speedier execution and speedier sales, strong revenue visibility
Mahindra Lifespace
1,874
457
554
21.3
in short-to-long run, attractive valuations
Massive capacity expansion along with rail advantage at ICD
Navkar Corporation
2,919
205
265
29.5
as well CFS augurs well for the company
Earnings boost on back of stable material prices and
Radico Khaitan
1,233
93
125
34.9
favourable pricing environment. Valuation discount to peers
provides additional comfort
Strong brands and distribution network would boost growth
Siyaram Silk Mills
1,031
1,100
1,347
22.4
going ahead. Stock currently trades at an inexpensive
valuation.
Source: Company, Angel Research
Market Outlook
June 24, 2016
Key Upcoming Events
Global economic events release calendar
Bloomberg Data
Date
Time
Country
Event Description
Unit
Period
Last Reported
Estimated
Jun 28, 2016
7:30 PM
US
Consumer Confidence
S.A./ 1985=100
Jun
92.60
93.00
1:25 PM Germany Unemployment change (000's)
Thousands
Jun
-11.00
Jun 29, 2016
6:00 PM
US
GDP Qoq (Annualised)
% Change
1Q T
0.80
1.00
Jun 30, 2016
2:30 PM Euro Zone Euro-Zone Consumer Confidence
Value
Jun F
-7.30
2:00 PM
UK
GDP (YoY)
% Change
1Q F
2.10
Jul 01, 2016
2:00 PM
UK
PMI Manufacturing
Value
Jun
50.10
6:30 AM
China
PMI Manufacturing
Value
Jun
50.10
2:24 AM
July 07, 2016
2:00 PM
UK
Industrial Production (YoY)
% Change
May
1.60
July 08, 2016
India
Imports YoY%
% Change
Jun
-13.20
India
Exports YoY%
% Change
Jun
-0.80
6:00 PM
US
Change in Nonfarm payrolls
Thousands
Jun
38.00
6:00 PM
US
Unnemployment rate
%
Jun
4.70
Jul 10, 2016
7:00 AM
China
Consumer Price Index (YoY)
% Change
Jun
2.00
Jul 12, 2016
China
Exports YoY%
% Change
Jun
(4.10)
Jul 13, 2016
5:30 PM
India
Industrial Production YoY
% Change
May
(0.80)
Source: Bloomberg, Angel Research
Market Outlook
June 24, 2016
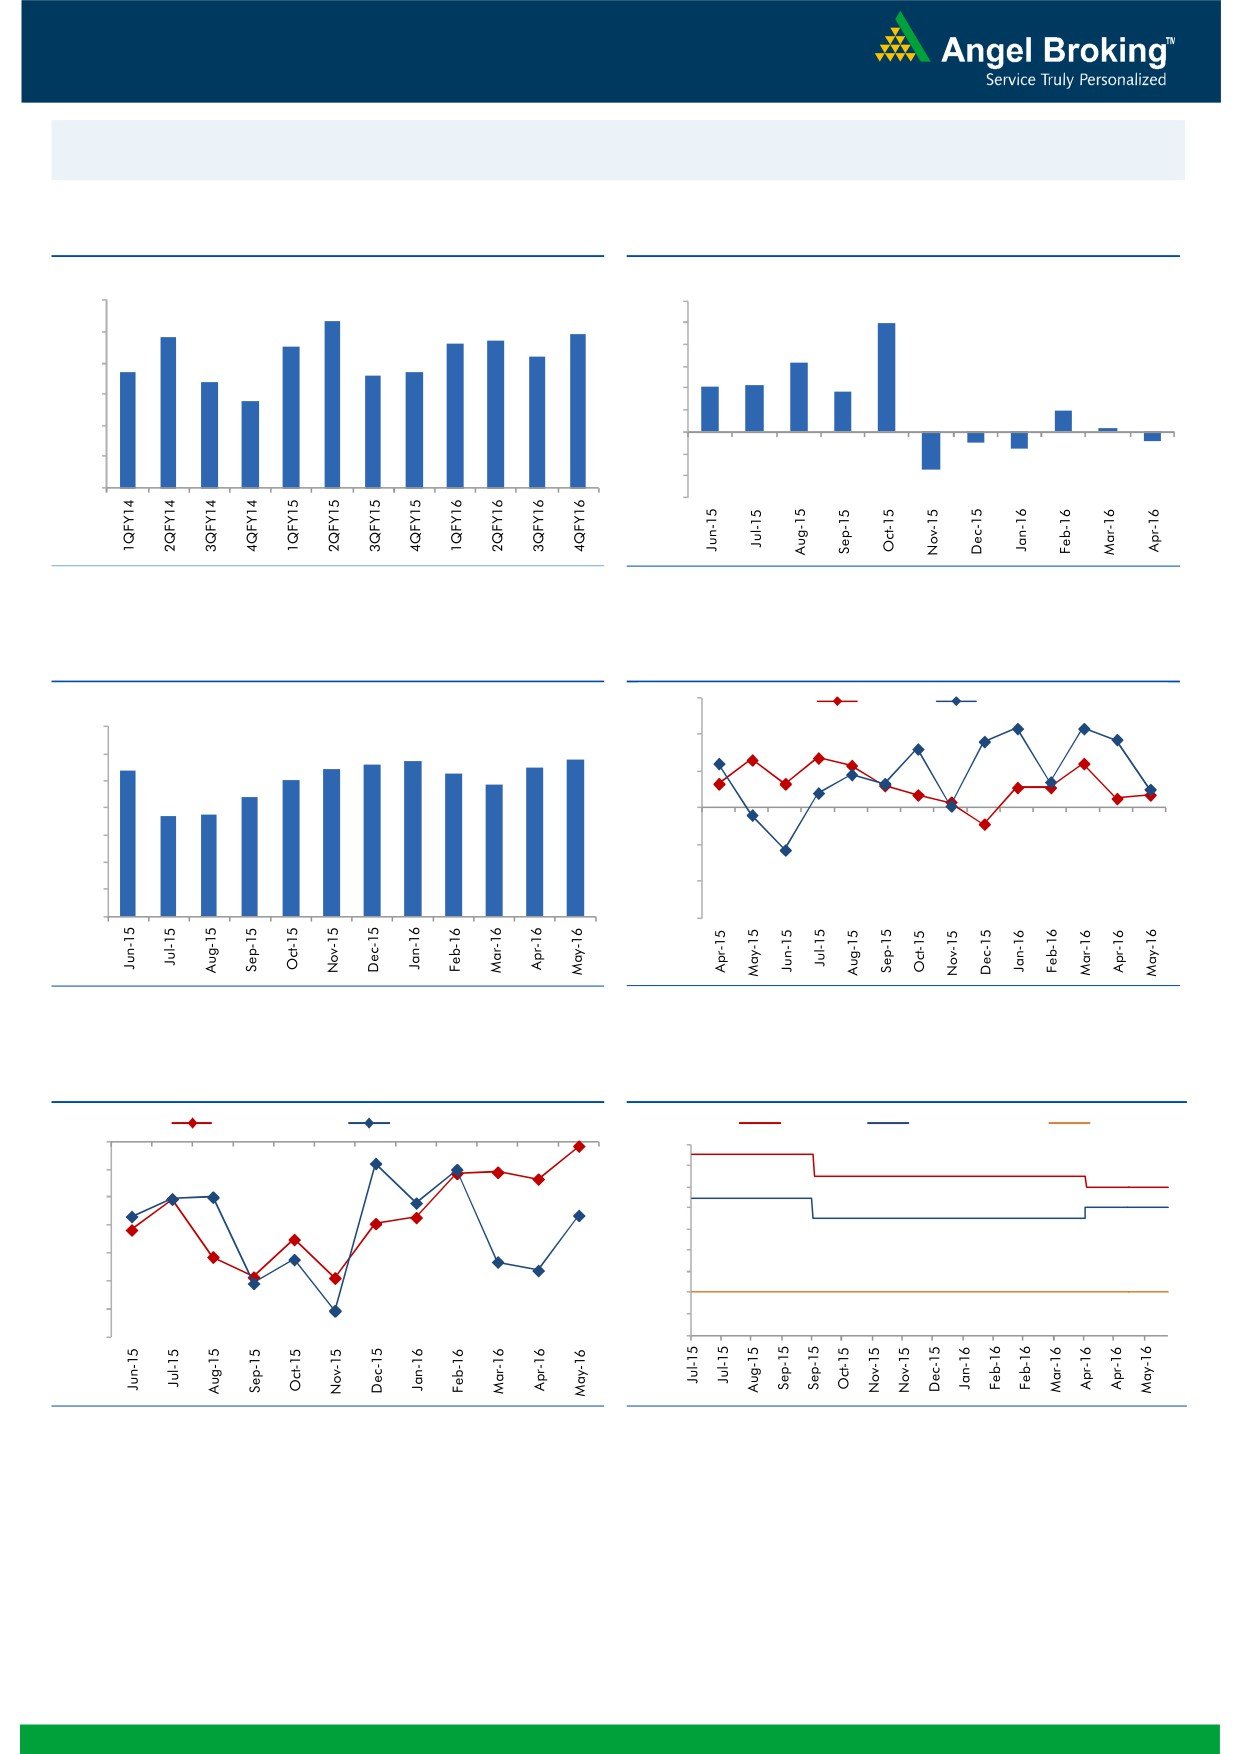
Macro watch
Exhibit 1: Quarterly GDP trends
Exhibit 2: IIP trends
(%)
(%)
9.0
12.0
8.3
9.9
7.8
7.7
7.9
10.0
8.0
7.5
7.6
7.2
8.0
6.3
6.7
6.6
6.7
7.0
6.4
6.0
4.2
4.3
3.7
5.8
4.0
6.0
2.0
2.0
0.3
5.0
-
4.0
(2.0)
(0.9)
(0.8)
(1.6)
(4.0)
3.0
(3.4)
(6.0)
Source: CSO, Angel Research
Source: MOSPI, Angel Research
Exhibit 3: Monthly CPI inflation trends
Exhibit 4: Manufacturing and services PMI
56.0
Mfg. PMI
Services PMI
(%)
7.0
54.0
5.7
5.8
5.4
5.4
5.6
5.5
6.0
5.3
5.0
4.8
52.0
5.0
4.4
3.7
3.7
4.0
50.0
3.0
48.0
2.0
46.0
1.0
-
44.0
Source: MOSPI, Angel Research
Source: Market, Angel Research; Note: Level above 50 indicates expansion
Exhibit 5: Exports and imports growth trends
Exhibit 6: Key policy rates
(%)
Exports yoy growth
Imports yoy growth
(%)
Repo rate
Reverse Repo rate
CRR
0.0
7.50
(5.0)
7.00
6.50
(10.0)
6.00
(15.0)
5.50
(20.0)
5.00
4.50
(25.0)
4.00
(30.0)
3.50
(35.0)
3.00
Source: Bloomberg, Angel Research
Source: RBI, Angel Research
Market Outlook
June 24, 2016
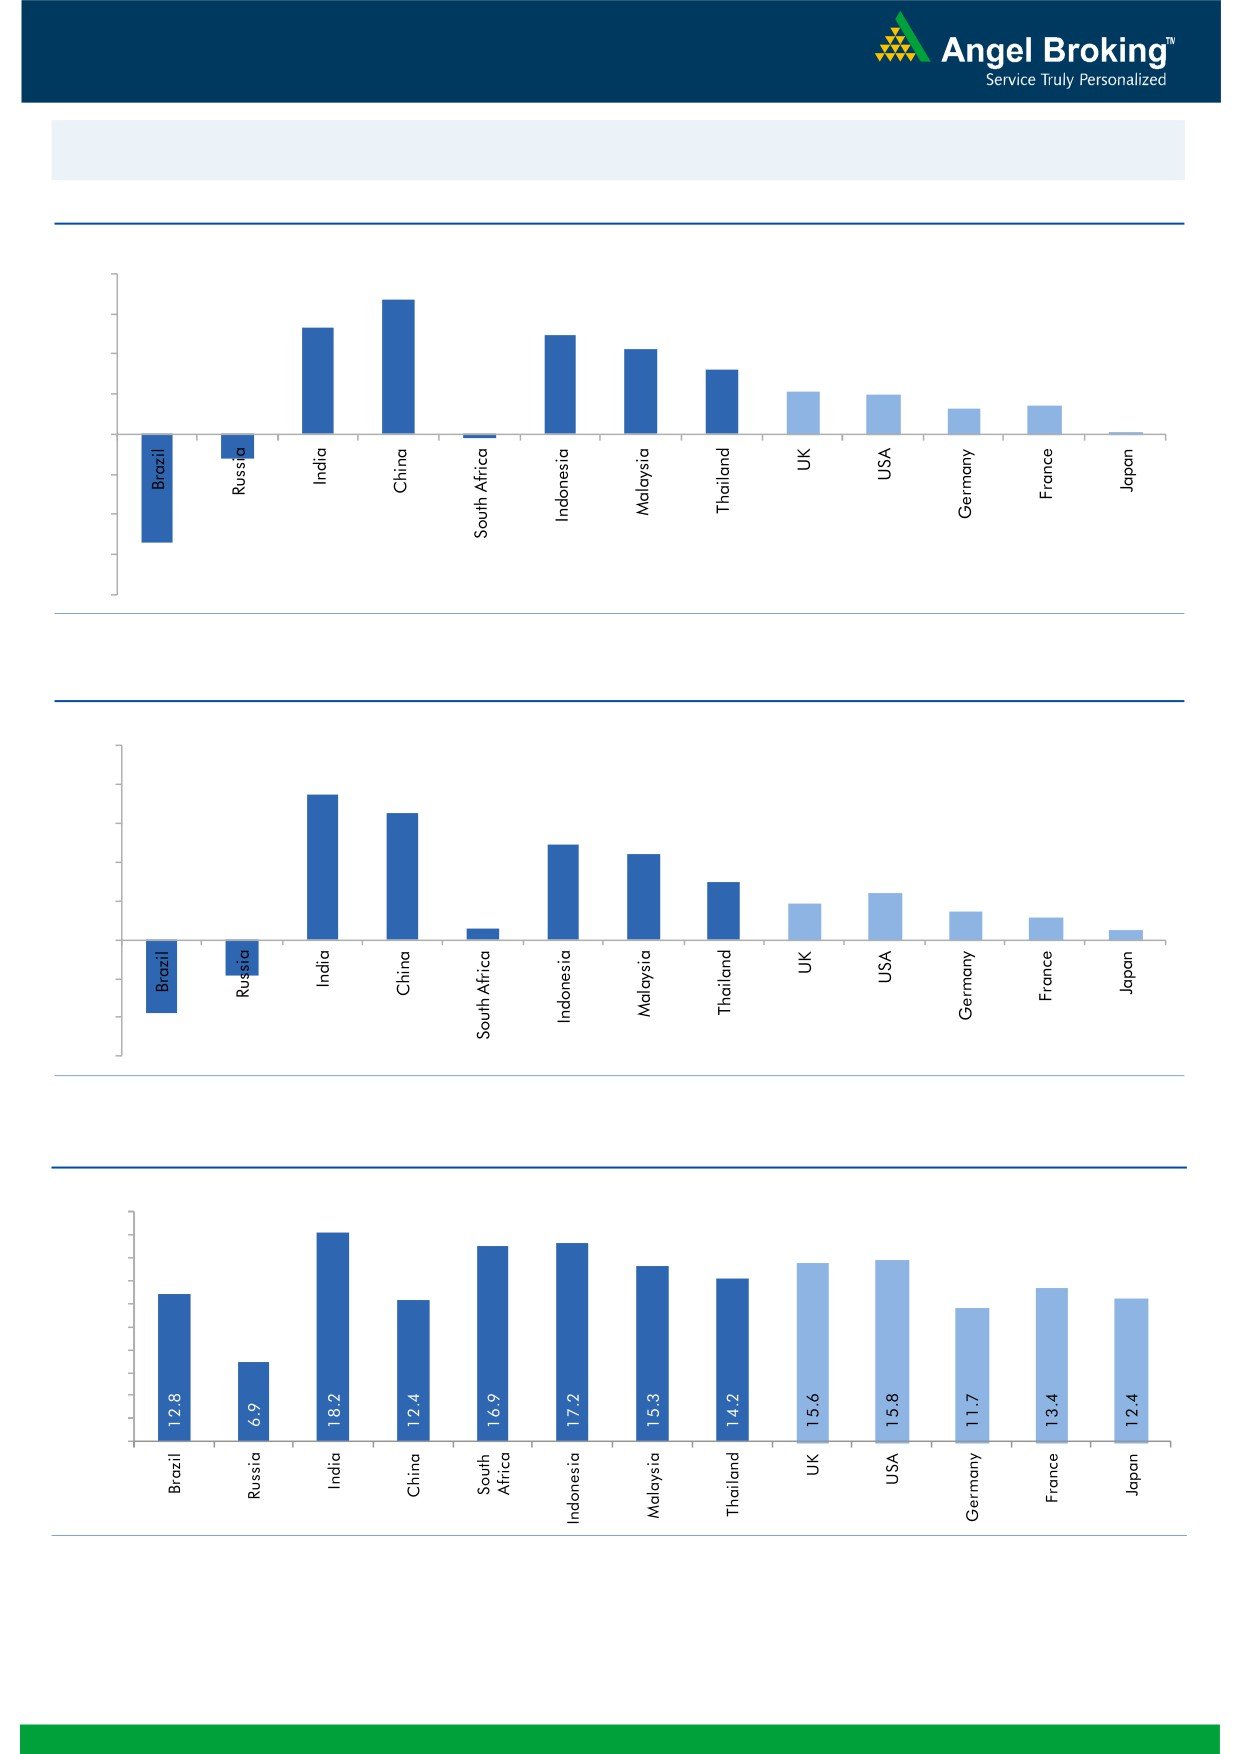
Global watch
Exhibit 1: Latest quarterly GDP Growth (%, yoy) across select developing and developed countries
(%)
8.0
6.7
6.0
5.3
4.9
4.2
4.0
3.2
2.1
2.0
1.3
1.4
2.0
0.1
-
(0.2)
(2.0)
(4.0)
(1.2)
(6.0)
(5.4)
(8.0)
Source: Bloomberg, Angel Research
Exhibit 2: 2016 GDP Growth projection by IMF (%, yoy) across select developing and developed countries
(%)
10.0
7.5
8.0
6.5
6.0
4.9
4.4
4.0
3.0
2.4
1.9
1.5
2.0
1.1
0.6
0.5
(3.8)
(1.8)
-
(2.0)
(4.0)
(6.0)
Source: IMF, Angel Research
Exhibit 3: One year forward P-E ratio across select developing and developed countries
(x)
20.0
18.0
16.0
14.0
12.0
10.0
8.0
6.0
4.0
2.0
-
Source: IMF, Angel Research
Market Outlook
June 24, 2016
Exhibit 4: Relative performance of indices across globe
Returns (%)
Country
Name of index
Closing price
1M
3M
1YR
Brazil
Bovespa
51,560
4.5
1.1
(3.2)
Russia
Micex
1,919
2.7
0.8
15.8
India
Nifty
8,270
6.7
8.8
1.2
China
Shanghai Composite
2,892
1.4
(3.9)
(43.1)
South Africa
Top 40
47,454
2.0
0.6
1.0
Mexico
Mexbol
46,146
1.4
1.1
1.7
Indonesia
LQ45
831
3.1
(1.7)
0.7
Malaysia
KLCI
1,640
0.3
(4.9)
(5.0)
Thailand
SET 50
913
3.5
2.7
(7.4)
USA
Dow Jones
18,011
3.0
2.9
0.7
UK
FTSE
6,338
3.3
2.5
(6.2)
Japan
Nikkei
16,238
(1.6)
(2.9)
(20.4)
Germany
DAX
10,257
2.0
2.7
(7.5)
France
CAC
4,466
0.8
0.9
(7.6)
Source: Bloomberg, Angel Research
Stock Watch
June 24, 2016
Company Name
Reco
CMP
Target
Mkt Cap
Sales ( Čcr )
OPM(%)
EPS (Č)
PER(x)
P/BV(x)
RoE(%)
EV/Sales(x)
(Č)
Price ( Č)
( Č cr )
FY16E FY17E
FY16E
FY17E
FY16E
FY17E
FY16E
FY17E
FY16E
FY17E
FY16E
FY17E
FY16E
FY17E
Agri / Agri Chemical
Rallis
Neutral
216
-
4,202
1,612
1,911
13.3
13.3
7.4
9.5
29.2
22.7
4.7
4.2
16.7
18.4
2.6
2.2
United Phosphorus
Accumulate
542
684
23,233
13,083
15,176
18.5
18.5
31.5
37.4
17.2
14.5
3.4
2.8
21.4
21.4
2.2
1.8
Auto & Auto Ancillary
Ashok Leyland
Neutral
99
-
28,231
17,995
21,544
11.4
11.6
3.4
4.7
29.2
21.1
5.1
4.7
17.7
22.2
1.6
1.3
Bajaj Auto
Neutral
2,651
-
76,718
22,709
25,860
20.9
20.1
129.0
143.6
20.6
18.5
6.3
5.4
30.7
29.4
2.9
2.5
Bharat Forge
Buy
753
875
17,524
7,351
8,318
19.9
19.7
31.2
36.5
24.1
20.6
4.3
3.7
19.3
19.2
2.5
2.2
Eicher Motors
Accumulate
18,659
20,044
50,681
15,556
16,747
15.5
17.3
464.8
597.5
40.2
31.2
14.7
10.8
36.2
34.3
3.2
2.9
Gabriel India
Accumulate
93
101
1,331
1,415
1,544
8.7
9.0
4.6
5.4
20.1
17.2
3.7
3.2
18.1
18.9
0.9
0.8
Hero Motocorp
Neutral
3,063
-
61,158
28,244
30,532
15.5
15.9
156.7
168.5
19.5
18.2
7.8
6.6
39.9
36.4
2.1
1.9
Jamna Auto Industries Neutral
170
-
1,359
1,281
1,473
11.2
11.5
7.6
9.2
22.4
18.5
5.7
4.6
25.4
25.2
1.1
0.9
L G Balakrishnan & Bros Neutral
441
-
692
1,254
1,394
11.6
11.8
35.9
41.7
12.3
10.6
1.7
1.5
13.5
13.8
0.7
0.6
Mahindra and Mahindra Neutral
1,374
-
85,360
38,416
42,904
13.7
13.9
54.8
63.4
25.1
21.7
3.9
3.4
15.4
15.8
1.8
1.6
Maruti
Neutral
4,163
-
125,745
57,865
68,104
16.4
16.7
176.3
225.5
23.6
18.5
4.6
3.9
19.4
21.2
2.0
1.6
Minda Industries
Neutral
1,144
-
1,815
2,523
2,890
8.7
9.0
55.0
65.4
20.8
17.5
4.0
3.3
19.3
18.7
0.8
0.7
Motherson Sumi
Accumulate
302
313
39,927
39,343
45,100
8.8
9.1
10.1
12.5
29.9
24.2
9.5
7.4
35.3
34.4
1.0
0.9
Rane Brake Lining
Buy
375
465
297
454
511
11.5
12.0
25.2
31.0
14.9
12.1
2.2
2.0
14.9
16.6
0.8
0.7
Setco Automotive
Neutral
46
-
618
594
741
12.7
13.7
1.7
3.2
27.2
14.5
2.9
2.5
10.4
16.9
1.3
1.1
Tata Motors
Neutral
488
-
140,896
259,686
273,957
13.0
13.4
25.9
29.5
18.8
16.5
2.5
2.2
8.0
9.0
0.7
0.7
TVS Motor
Accumulate
296
330
14,041
11,263
13,122
6.9
8.5
9.2
15.0
32.1
19.7
7.3
5.8
22.7
29.6
1.2
1.0
Amara Raja Batteries
Buy
866
1,076
14,798
4,690
5,429
17.5
17.5
28.5
35.3
30.5
24.5
7.0
5.8
23.1
25.9
3.0
2.6
Exide Industries
Neutral
163
-
13,889
6,950
7,784
14.4
14.8
6.6
7.3
24.8
22.4
3.1
2.9
12.6
12.8
1.6
1.5
Apollo Tyres
Buy
149
183
7,579
12,056
12,714
17.2
16.4
23.0
20.3
6.5
7.3
1.1
1.0
17.7
13.6
0.7
0.7
Ceat
Buy
811
1,119
3,282
6,041
6,597
14.1
13.7
99.5
111.9
8.2
7.3
1.6
1.3
19.6
18.5
0.8
0.6
JK Tyres
Neutral
87
-
1,962
7,446
7,669
15.2
14.0
19.6
18.4
4.4
4.7
1.1
0.9
25.2
19.5
0.7
0.6
Swaraj Engines
Neutral
1,153
-
1,432
552
630
14.2
14.7
44.6
54.1
25.9
21.3
6.0
5.5
23.2
25.6
2.3
2.0
Subros
Neutral
87
-
522
1,293
1,527
11.8
11.9
4.2
6.7
20.7
13.0
1.6
1.4
7.7
11.5
0.7
0.6
Indag Rubber
Neutral
180
-
472
283
329
17.0
17.2
13.0
15.4
13.9
11.7
3.0
2.5
21.8
21.6
1.5
1.2
Capital Goods
ACE
Neutral
41
-
410
660
839
4.7
8.2
1.0
3.9
41.5
10.6
1.3
1.2
3.2
11.3
0.8
0.6
BEML
Buy
844
1,157
3,514
3,277
4,006
6.0
8.9
36.2
64.3
23.3
13.1
1.6
1.5
5.7
11.7
1.1
0.9
Bharat Electronics
Buy
1,274
1,414
30,586
7,295
8,137
20.0
16.8
56.5
58.7
22.6
21.7
3.4
3.0
42.1
44.6
3.0
2.5
Stock Watch
June 24, 2016
Company Name
Reco
CMP
Target
Mkt Cap
Sales ( Čcr )
OPM(%)
EPS (Č)
PER(x)
P/BV(x)
RoE(%)
EV/Sales(x)
(Č)
Price ( Č)
( Č cr )
FY16E
FY17E
FY16E
FY17E
FY16E
FY17E
FY16E
FY17E
FY16E
FY17E
FY16E
FY17E
FY16E
FY17E
Capital Goods
Voltas
Buy
321
407
10,605
5,857
6,511
7.5
7.9
11.7
12.9
27.4
24.8
4.5
3.9
17.1
16.7
1.9
1.7
BGR Energy
Neutral
112
-
806
3,615
3,181
9.5
9.4
16.7
12.4
6.7
9.0
0.6
0.6
10.0
7.0
0.6
0.8
BHEL
Neutral
123
-
29,995
33,722
35,272
10.8
11.7
10.5
14.2
11.7
8.6
0.9
0.8
7.0
9.0
0.9
0.9
Blue Star
Buy
426
495
3,828
3,770
4,351
5.7
6.4
11.4
17.2
37.3
24.8
5.8
5.4
18.4
23.1
1.0
0.9
Crompton Greaves
Neutral
73
-
4,550
13,484
14,687
4.9
6.2
4.5
7.1
16.1
10.2
1.1
1.1
7.2
10.8
0.5
0.4
Greaves Cotton
Neutral
136
-
3,311
1,655
1,755
16.6
16.8
7.4
7.8
18.3
17.4
3.7
3.5
21.1
20.6
2.0
1.9
Inox Wind
Buy
232
286
5,141
4,406
5,605
15.5
15.7
20.4
24.8
11.4
9.3
2.6
1.9
27.9
25.9
1.3
1.0
KEC International
Neutral
138
-
3,550
8,791
9,716
6.1
6.8
5.4
8.2
25.6
16.8
2.6
2.3
10.0
14.0
0.6
0.6
Thermax
Neutral
812
-
9,673
6,413
7,525
7.4
8.5
30.5
39.3
26.6
20.7
4.1
3.6
15.0
17.0
1.4
1.1
VATech Wabag
Neutral
564
-
3,076
2,722
3,336
7.9
8.1
19.5
24.6
28.9
22.9
3.0
2.7
11.1
12.4
1.3
1.1
Cement
ACC
Neutral
1,575
-
29,575
13,151
14,757
16.4
18.3
63.9
83.4
24.7
18.9
3.2
2.9
13.3
16.1
2.0
1.7
Ambuja Cements
Neutral
249
-
38,619
11,564
12,556
19.4
20.7
8.9
10.1
28.0
24.6
3.5
3.3
12.8
13.8
2.7
2.5
HeidelbergCement
Neutral
107
-
2,426
1,772
1,926
13.3
15.4
1.0
3.0
107.1
35.7
2.7
2.5
2.6
7.9
1.9
1.7
India Cements
Neutral
102
-
3,146
4,216
4,840
18.0
19.5
4.0
9.9
25.6
10.3
1.0
1.0
4.0
9.5
1.0
0.8
JK Cement
Neutral
647
-
4,522
3,661
4,742
10.1
15.8
7.5
28.5
86.2
22.7
2.6
2.3
7.5
22.9
1.6
1.2
J K Lakshmi Cement
Neutral
385
-
4,527
2,947
3,616
16.7
19.9
11.5
27.2
33.5
14.1
3.2
2.7
9.8
20.8
1.8
1.4
Mangalam Cements
Neutral
290
-
774
1,053
1,347
10.5
13.3
8.4
26.0
34.5
11.2
1.5
1.3
4.3
12.5
1.1
0.8
Orient Cement
Neutral
163
-
3,332
1,854
2,524
21.2
22.2
7.7
11.1
21.1
14.7
3.0
2.6
13.3
15.7
2.6
1.8
Ramco Cements
Neutral
548
-
13,045
4,036
4,545
20.8
21.3
15.1
18.8
36.3
29.2
4.4
3.9
12.9
14.3
3.5
3.0
Shree Cement^
Neutral
14,406
-
50,187
7,150
8,742
26.7
28.6
228.0
345.5
63.2
41.7
9.3
7.8
15.7
20.3
6.4
5.1
UltraTech Cement
Neutral
3,334
-
91,502
24,669
29,265
18.2
20.6
82.0
120.0
40.7
27.8
4.4
3.8
11.3
14.7
3.6
3.1
Construction
ITNL
Buy
73
93
2,395
7,360
8,682
34.0
32.2
7.0
8.6
10.4
8.5
0.4
0.4
3.2
2.5
3.7
3.5
KNR Constructions
Neutral
556
-
1,564
937
1,470
14.3
14.0
44.2
38.6
12.6
14.4
2.5
2.2
15.4
15.4
1.8
1.2
Larsen & Toubro
Buy
1,497
1,700
139,554
58,870
65,708
8.3
10.3
42.0
53.0
35.7
28.3
2.5
2.2
8.8
11.2
2.5
2.3
Gujarat Pipavav Port
Neutral
165
-
7,955
629
684
51.0
52.2
6.4
5.9
25.7
27.9
3.4
3.1
15.9
12.7
11.8
10.7
MBL Infrastructures
Buy
111
285
460
2,313
2,797
12.2
14.6
19.0
20.0
5.8
5.5
0.6
0.6
11.3
10.6
0.9
0.8
Nagarjuna Const.
Neutral
74
-
4,117
7,892
8,842
8.8
9.1
3.0
5.3
24.7
14.0
1.2
1.1
5.0
8.5
0.7
0.6
PNC Infratech
Neutral
550
-
2,823
1,873
2,288
13.2
13.5
24.0
32.0
22.9
17.2
2.2
2.0
12.1
12.3
1.6
1.3
Simplex Infra
Neutral
272
-
1,343
5,955
6,829
10.3
10.5
16.0
31.0
17.0
8.8
0.9
0.8
5.3
9.9
0.7
0.6
Stock Watch
June 24, 2016
Company Name
Reco
CMP
Target
Mkt Cap
Sales ( Čcr )
OPM(%)
EPS (Č)
PER(x)
P/BV(x)
RoE(%)
EV/Sales(x)
(Č)
Price ( Č)
( Č cr )
FY16E
FY17E
FY16E
FY17E
FY16E
FY17E
FY16E
FY17E
FY16E
FY17E
FY16E
FY17E
FY16E
FY17E
Construction
Power Mech Projects
Neutral
539
-
793
1,539
1,801
12.8
12.7
59.0
72.1
9.1
7.5
1.4
1.2
18.6
16.8
0.6
0.5
Sadbhav Engineering
Accumulate
286
298
4,908
3,186
3,598
10.2
10.3
8.0
9.0
35.8
31.8
3.3
2.9
9.4
9.9
1.8
1.6
NBCC
Accumulate
187
220
11,229
5,838
7,428
6.0
7.9
5.2
8.2
36.0
22.8
1.1
0.9
21.9
28.2
1.8
1.3
MEP Infra
Neutral
38
-
617
1,956
1,876
28.1
30.5
1.3
3.0
29.2
12.7
6.1
4.1
21.2
32.8
1.7
1.7
SIPL
Neutral
99
-
3,487
675
1,042
62.4
64.7
-
-
3.7
4.2
-
-
16.7
11.3
Engineers India
Neutral
198
-
6,670
1,667
1,725
13.5
16.0
9.7
11.4
20.4
17.4
2.4
2.3
11.7
13.4
2.7
2.7
Financials
Allahabad Bank
Neutral
64
-
4,609
8,569
9,392
2.8
2.9
16.3
27.5
3.9
2.3
0.4
0.3
7.6
11.9
-
-
Axis Bank
Neutral
527
-
125,645
26,204
29,738
3.6
3.5
34.5
35.4
15.3
14.9
2.4
2.1
16.8
14.9
-
-
Bank of Baroda
Neutral
152
-
35,058
18,802
21,088
2.0
2.2
(7.4)
13.0
11.7
1.2
1.0
(4.2)
7.3
-
-
Bank of India
Neutral
96
-
9,009
15,972
17,271
1.9
2.0
15.3
33.4
6.3
2.9
0.3
0.3
3.6
7.6
-
-
Canara Bank
Neutral
213
-
11,582
15,441
16,945
2.0
2.1
46.6
70.4
4.6
3.0
0.4
0.4
8.0
11.2
-
-
Dena Bank
Neutral
37
-
2,438
3,440
3,840
2.1
2.3
7.3
10.0
5.0
3.6
0.4
0.3
6.1
7.9
-
-
Dewan Housing Finance Buy
200
270
5,829
1,828
2,225
2.9
3.0
24.9
29.7
8.0
6.7
1.2
1.1
15.1
16.1
-
-
Equitas Holdings
Buy
175
235
5,879
679
1,076
12.4
11.7
6.2
6.7
28.3
26.2
3.5
2.6
13.3
12.5
-
-
Federal Bank
Neutral
56
-
9,622
3,279
3,787
2.8
2.9
3.9
5.5
14.2
10.1
1.2
1.1
8.4
10.8
-
-
HDFC
Neutral
1,243
-
196,443
10,358
11,852
3.3
3.3
41.1
47.0
30.3
26.4
5.8
5.2
24.7
24.9
-
-
HDFC Bank
Accumulate
1,190
1,262
301,214
38,606
47,696
4.4
4.5
48.8
61.4
24.4
19.4
4.1
3.6
18.7
20.0
-
-
ICICI Bank
Neutral
241
-
140,101
34,279
39,262
3.3
3.3
21.0
24.4
11.5
9.9
1.9
1.6
14.4
14.7
-
-
IDBI Bank
Neutral
70
-
14,360
9,625
10,455
1.8
1.8
8.5
14.2
8.2
4.9
0.5
0.5
5.9
9.3
-
-
Indian Bank
Neutral
137
-
6,568
6,160
6,858
2.5
2.5
24.5
29.8
5.6
4.6
0.4
0.4
7.7
8.6
-
-
LIC Housing Finance
Buy
487
592
24,597
3,179
3,758
2.6
2.6
32.9
40.6
14.8
12.0
2.7
2.3
19.6
20.7
-
-
Oriental Bank
Neutral
102
-
3,531
7,643
8,373
2.4
2.4
37.2
45.4
2.7
2.3
0.2
0.2
8.2
9.4
-
-
Punjab Natl.Bank
Neutral
99
-
19,489
23,122
26,022
2.8
2.8
7.0
21.6
14.2
4.6
0.7
0.7
3.4
10.0
-
-
South Ind.Bank
Neutral
20
-
2,701
1,965
2,185
2.5
2.5
2.5
3.3
8.0
6.1
0.8
0.7
9.5
11.7
-
-
St Bk of India
Neutral
217
-
168,763
79,958
86,061
2.6
2.6
13.4
20.7
16.2
10.5
1.3
1.2
11.5
12.8
-
-
Union Bank
Neutral
126
-
8,679
12,646
14,129
2.3
2.4
31.0
39.1
4.1
3.2
0.4
0.4
9.8
11.4
-
-
Vijaya Bank
Neutral
36
-
3,626
3,536
3,827
1.9
1.9
5.5
6.7
6.6
5.5
0.5
0.5
7.8
8.8
-
-
Yes Bank
Neutral
1,112
-
46,804
7,190
9,011
3.2
3.3
58.2
69.7
19.1
16.0
3.4
2.9
19.2
19.6
-
-
FMCG
Asian Paints
Neutral
984
-
94,380
15,534
17,445
17.7
16.8
18.4
19.6
53.6
50.2
18.9
17.9
34.6
35.6
6.2
5.5
Stock Watch
June 24, 2016
Company Name
Reco
CMP
Target
Mkt Cap
Sales ( Čcr )
OPM(%)
EPS (Č)
PER(x)
P/BV(x)
RoE(%)
EV/Sales(x)
(Č)
Price ( Č)
( Č cr )
FY16E FY17E
FY16E
FY17E
FY16E
FY17E
FY16E
FY17E
FY16E
FY17E
FY16E
FY17E
FY16E
FY17E
FMCG
Britannia
Neutral
2,624
-
31,482
8,481
9,795
14.0
14.1
65.5
78.3
40.1
33.5
19.0
15.6
38.3
41.2
3.8
3.3
Colgate
Neutral
881
-
23,965
4,136
4,632
22.5
23.3
22.2
25.3
39.7
34.8
24.1
21.5
68.6
67.5
5.6
5.0
Dabur India
Neutral
307
-
53,944
9,370
10,265
17.6
17.3
7.3
8.1
41.8
37.9
10.8
9.9
31.7
30.6
5.6
5.1
GlaxoSmith Con*
Accumulate
6,010
6,118
25,277
4,519
5,142
19.6
19.8
164.3
191.2
36.6
31.4
10.1
8.6
30.8
29.9
4.7
4.1
Godrej Consumer
Neutral
1,547
-
52,686
9,003
10,335
18.1
18.7
34.1
41.8
45.4
37.0
9.8
8.4
23.9
24.8
6.1
5.3
HUL
Neutral
869
-
188,157
33,299
35,497
17.1
17.1
18.9
20.0
46.0
43.5
40.3
35.1
87.6
80.8
5.6
5.2
ITC
Accumulate
360
380
289,901
36,837
39,726
38.8
38.7
12.2
13.5
29.5
26.7
8.2
7.2
27.8
26.9
7.2
6.7
Marico
Neutral
260
-
33,493
6,151
6,966
17.2
17.3
5.4
6.4
48.1
40.6
15.1
11.9
33.2
32.4
5.2
4.6
Nestle*
Neutral
6,429
-
61,987
9,393
10,507
22.2
22.3
106.8
121.8
60.2
52.8
21.2
19.0
34.8
36.7
6.2
5.6
Tata Global
Accumulate
127
137
8,000
8,635
9,072
9.8
9.9
5.8
7.2
21.9
17.6
1.9
1.9
6.8
7.4
0.9
0.9
Procter & Gamble
Buy
6,240
7,369
20,256
2,588
2,939
23.3
23.2
130.2
146.2
47.9
42.7
95.6
91.6
27.6
25.3
7.4
6.4
Hygiene
IT
HCL Tech^
Buy
769
1,000
108,431
37,061
30,781
21.5
20.5
51.4
40.0
15.0
19.2
3.9
2.8
20.1
20.3
2.5
2.7
Infosys
Accumulate
1,212
1,374
278,286
62,441
70,558
27.5
27.5
59.0
65.3
20.5
18.6
4.1
3.8
22.2
22.4
4.1
3.5
TCS
Accumulate
2,644
3,004
521,040
108,646
122,770
28.3
28.3
123.7
141.0
21.4
18.8
7.1
6.5
33.1
34.6
4.3
3.7
Tech Mahindra
Buy
532
700
51,652
26,494
30,347
16.3
17.0
32.2
37.5
16.5
14.2
3.6
3.1
21.7
21.8
1.8
1.5
Wipro
Buy
564
680
139,237
50,808
56,189
23.7
23.8
37.3
40.7
15.1
13.9
2.9
2.6
19.2
17.7
2.1
1.7
Media
D B Corp
Neutral
375
-
6,891
2,025
2,187
27.4
27.4
17.4
18.9
21.5
19.9
4.9
4.4
22.9
23.7
3.4
3.1
HT Media
Neutral
77
-
1,788
2,495
2,673
12.9
13.2
6.8
7.2
11.3
10.7
0.9
0.8
7.5
7.8
0.3
0.3
Jagran Prakashan
Buy
170
205
5,558
2,107
2,355
33.5
28.0
10.1
10.8
16.9
15.7
3.9
3.4
23.3
21.7
2.7
2.4
Sun TV Network
Neutral
363
-
14,307
2,510
2,763
71.8
71.5
21.9
24.8
16.6
14.6
3.9
3.6
22.8
24.3
5.2
4.7
Hindustan Media
Neutral
270
-
1,982
914
1,016
21.7
21.5
21.9
23.3
12.3
11.6
2.2
1.9
18.0
16.2
1.6
1.4
Ventures
Metals & Mining
Coal India
Buy
317
380
200,513
76,167
84,130
19.9
22.3
22.4
25.8
14.2
12.3
5.1
5.0
35.5
41.0
1.9
1.7
Hind. Zinc
Neutral
175
-
73,774
14,641
14,026
50.4
50.4
17.7
16.0
9.9
10.9
1.5
1.4
16.2
13.2
2.5
2.3
Hindalco
Neutral
124
-
25,575
104,356
111,186
8.7
9.5
6.7
11.1
18.4
11.2
0.7
0.6
3.5
5.9
0.7
0.7
JSW Steel
Neutral
1,400
-
33,852
42,308
45,147
16.4
20.7
(10.3)
49.5
28.3
1.6
1.5
(1.0)
5.6
1.8
1.7
NMDC
Neutral
92
-
36,337
8,237
10,893
46.6
44.5
10.0
11.7
9.2
7.9
1.0
0.9
12.5
13.0
4.1
3.1
SAIL
Neutral
44
-
18,152
45,915
53,954
7.2
10.5
1.5
4.4
29.2
10.0
0.4
0.4
2.3
4.1
1.0
0.9
Vedanta
Neutral
127
-
37,533
71,445
81,910
26.2
26.3
12.9
19.2
9.8
6.6
0.7
0.6
7.2
8.9
0.9
0.7
Tata Steel
Neutral
334
-
32,414
126,760
137,307
8.9
11.3
6.4
23.1
52.5
14.5
1.1
1.0
2.0
7.1
0.8
0.8
Stock Watch
June 24, 2016
Company Name
Reco
CMP
Target
Mkt Cap
Sales ( Čcr )
OPM(%)
EPS (Č)
PER(x)
P/BV(x)
RoE(%)
EV/Sales(x)
(Č)
Price ( Č)
( Č cr )
FY16E FY17E
FY16E
FY17E
FY16E
FY17E
FY16E
FY17E
FY16E
FY17E
FY16E
FY17E
FY16E
FY17E
Oil & Gas
Cairn India
Neutral
138
-
25,901
11,323
12,490
49.4
51.0
20.7
20.7
6.7
6.7
0.4
0.4
6.4
6.1
1.4
0.8
GAIL
Neutral
375
-
47,619
64,856
70,933
9.1
9.6
24.0
28.9
15.7
13.0
1.3
1.3
8.8
9.6
0.9
0.8
ONGC
Neutral
218
-
186,339
154,564
145,998
36.8
37.4
20.8
22.6
10.5
9.6
1.0
0.9
10.1
9.7
1.4
1.5
Petronet LNG
Neutral
287
-
21,540
29,691
31,188
5.8
6.2
12.8
13.4
22.5
21.4
3.4
3.0
15.8
14.8
0.8
0.7
Indian Oil Corp
Accumulate
422
455
102,411
359,607
402,760
5.9
6.1
42.5
48.7
9.9
8.7
1.3
1.2
14.1
14.4
0.4
0.3
Reliance Industries
Buy
982
1,150
318,376
304,775
344,392
12.6
13.4
91.3
102.6
10.8
9.6
1.2
1.1
11.8
12.0
0.9
0.8
Pharmaceuticals
Alembic Pharma
Neutral
537
-
10,129
3,274
3,802
26.9
19.4
35.0
28.7
15.4
18.7
6.8
5.1
55.6
31.2
3.2
2.7
Aurobindo Pharma
Accumulate
726
856
42,501
14,923
17,162
22.0
23.0
35.7
42.8
20.3
17.0
6.0
4.5
34.0
30.2
3.5
3.0
Aventis*
Accumulate
4,139
4,738
9,533
2,049
2,375
15.4
17.3
115.4
153.5
35.9
27.0
5.9
4.6
19.3
25.8
4.6
3.9
Cadila Healthcare
Buy
315
400
32,222
9,469
11,246
21.2
22.0
14.9
17.1
21.1
18.4
6.0
4.7
28.8
26.6
3.4
2.9
Cipla
Buy
476
605
38,258
13,979
16,447
20.2
18.6
25.7
27.5
18.5
17.3
3.0
2.6
17.6
16.1
2.7
2.2
Dr Reddy's
Accumulate
3,171
3,476
54,073
15,471
17,479
24.6
24.6
138.2
152.4
22.9
20.8
4.2
3.6
19.7
18.7
3.4
3.0
Dishman Pharma
Neutral
133
-
2,151
1,733
1,906
21.5
21.5
10.1
10.0
13.2
13.3
1.6
1.4
10.5
11.2
1.9
1.7
GSK Pharma*
Neutral
3,409
-
28,875
2,870
3,158
20.0
22.1
59.5
68.3
57.3
49.9
16.9
17.4
28.5
34.3
9.9
9.1
Indoco Remedies
Neutral
260
-
2,396
1,033
1,199
15.9
18.2
9.4
13.6
27.7
19.1
4.1
3.5
15.7
19.7
2.6
2.3
Ipca labs
Buy
473
750
5,972
3,363
3,909
12.9
18.6
13.4
28.0
35.3
16.9
2.5
2.2
7.4
14.0
1.9
1.6
Lupin
Buy
1,485
1,809
66,959
13,702
15,912
23.7
26.4
50.5
58.1
29.4
25.6
6.1
5.0
22.9
21.4
5.2
4.2
Sun Pharma
Buy
752
950
180,911
28,163
32,610
25.8
30.7
17.4
26.9
43.2
27.9
4.1
3.6
13.0
16.6
5.8
4.8
Power
Tata Power
Neutral
73
-
19,771
35,923
37,402
22.6
22.8
4.1
5.2
18.0
14.2
1.4
1.3
7.5
9.3
1.5
1.4
NTPC
Neutral
149
-
122,899
87,271
99,297
23.5
23.5
11.8
13.3
12.7
11.2
1.4
1.3
11.5
12.2
2.4
2.2
Power Grid
Accumulate
157
170
81,901
20,702
23,361
86.7
86.4
12.1
13.2
13.0
11.9
1.9
1.7
15.6
15.1
8.7
8.1
Real Estate
MLIFE
Buy
457
554
1,874
826
1,011
20.1
21.9
22.7
30.7
20.1
14.9
1.2
1.1
6.0
7.4
4.1
3.1
Telecom
Bharti Airtel
Neutral
364
-
145,585
101,748
109,191
32.1
31.7
12.0
12.5
30.4
29.1
2.1
2.0
6.9
6.7
2.0
1.9
Idea Cellular
Neutral
102
-
36,582
34,282
36,941
32.0
31.5
5.9
6.2
17.2
16.4
1.6
1.4
9.9
9.3
1.7
1.6
zOthers
Abbott India
Neutral
4,520
-
9,604
2,715
3,153
14.5
14.1
134.3
152.2
33.7
29.7
8.4
6.9
27.4
25.6
3.3
2.8
Bajaj Electricals
Buy
220
268
2,226
4,612
5,351
5.6
5.7
23.4
18.0
9.4
12.3
2.9
2.6
12.5
14.4
0.5
0.4
Finolex Cables
Neutral
348
-
5,329
2,520
2,883
12.2
12.0
12.7
14.2
27.5
24.5
3.7
3.3
13.6
13.5
1.9
1.6
Goodyear India*
Accumulate
516
582
1,190
1,800
1,600
11.7
11.5
58.7
52.9
8.8
9.8
2.0
1.7
24.6
18.7
0.4
0.4
Hitachi
Neutral
1,269
-
3,451
1,779
2,081
7.8
8.8
21.8
33.4
58.2
38.0
9.4
7.6
17.4
22.1
2.0
1.7
Stock Watch
June 24, 2016
Company Name
Reco
CMP
Target
Mkt Cap
Sales ( Čcr )
OPM(%)
EPS (Č)
PER(x)
P/BV(x)
RoE(%)
EV/Sales(x)
(Č)
Price ( Č)
( Č cr )
FY16E
FY17E
FY16E
FY17E
FY16E
FY17E
FY16E
FY17E
FY16E
FY17E
FY16E
FY17E
FY16E
FY17E
zOthers
Jyothy Laboratories
Neutral
298
-
5,398
1,620
1,847
11.5
11.5
7.3
8.5
40.9
35.2
5.3
4.9
13.3
14.4
3.1
2.7
MRF
Buy
31,677
45,575
13,435
20,316
14,488
21.4
21.1
5,488.0
3,798.0
5.8
8.3
2.0
1.6
41.1
21.2
0.6
0.9
Page Industries
Neutral
13,480
-
15,035
1,929
2,450
19.8
20.1
229.9
299.0
58.6
45.1
25.9
18.0
52.1
47.1
8.2
6.4
Relaxo Footwears
Neutral
478
-
5,742
1,767
2,152
12.3
12.5
19.3
25.1
24.9
19.1
6.1
4.7
27.7
27.8
3.0
2.5
Siyaram Silk Mills
Buy
1,100
1,347
1,031
1,619
1,799
11.6
11.6
93.5
104.9
11.8
10.5
2.0
1.7
17.1
16.4
0.8
0.8
Styrolution ABS India* Neutral
602
-
1,058
1,271
1,440
8.6
9.2
32.0
41.1
18.8
14.7
1.9
1.7
10.7
12.4
0.8
0.7
TVS Srichakra
Buy
2,314
2,932
1,771
2,035
2,252
15.9
15.3
248.6
268.1
9.3
8.6
4.1
2.9
43.6
33.9
0.9
0.8
HSIL
Accumulate
273
310
1,972
2,123
2,384
16.1
16.5
15.0
18.9
18.1
14.5
1.4
1.3
8.0
9.4
1.3
1.1
Kirloskar Engines India
Neutral
265
-
3,837
2,403
2,554
8.6
9.9
9.2
10.5
28.9
25.3
2.8
2.6
9.7
10.7
1.2
1.1
Ltd
M M Forgings
Buy
424
546
512
511
615
21.7
21.6
43.1
55.8
9.8
7.6
1.8
1.5
19.9
21.2
1.3
1.0
Banco Products (India) Neutral
140
-
1,001
1,208
1,353
11.0
12.3
10.8
14.5
13.0
9.7
1.5
1.3
11.9
14.5
0.8
0.7
Competent Automobiles Neutral
142
-
87
1,040
1,137
3.2
3.1
25.7
28.0
5.5
5.1
0.8
0.7
15.0
14.3
0.1
0.1
Nilkamal
Neutral
1,129
-
1,685
1,871
2,031
10.7
10.5
63.2
69.8
17.9
16.2
2.9
2.5
17.6
16.6
1.0
0.9
Visaka Industries
Buy
149
162
236
1,020
1,120
8.7
9.1
13.9
20.1
10.7
7.4
0.7
0.6
6.4
8.7
0.4
0.4
Transport Corporation of
Neutral
307
-
2,349
2,830
3,350
8.8
9.0
14.4
18.3
21.4
16.8
3.3
2.9
15.4
17.1
0.9
0.8
India
Elecon Engineering
Neutral
61
-
669
1,359
1,482
10.3
13.7
0.8
3.9
76.5
15.8
1.3
1.2
1.6
7.8
0.8
0.7
Surya Roshni
Buy
163
201
712
2,992
3,223
8.1
8.4
14.7
18.3
11.1
8.9
1.0
0.9
9.7
11.0
0.5
0.5
MT Educare
Neutral
162
-
645
286
366
18.3
17.7
7.7
9.4
21.0
17.3
4.4
3.9
20.2
21.1
2.4
1.8
Radico Khaitan
Buy
93
125
1,233
1,543
1,659
12.6
13.0
5.8
6.3
16.0
14.6
1.4
1.3
8.5
8.6
1.3
1.2
Garware Wall Ropes
Buy
360
460
788
828
898
11.2
10.3
28.3
29.0
12.7
12.4
2.1
1.9
16.8
14.9
0.9
0.8
Wonderla Holidays
Neutral
395
-
2,232
206
308
44.0
43.6
9.0
12.9
43.9
30.6
6.0
5.4
13.7
17.8
10.4
6.9
Linc Pen & Plastics
Accumulate
237
235
350
344
382
9.1
9.1
12.4
13.1
19.1
18.1
3.5
3.0
18.0
16.7
1.0
0.9
The Byke Hospitality
Neutral
159
-
636
222
287
20.5
20.5
5.6
7.6
28.1
21.0
5.3
4.4
18.9
20.8
3.1
2.4
Interglobe Aviation
Neutral
1,007
-
36,272
17,022
21,122
20.7
14.5
63.9
53.7
15.8
18.8
23.6
19.3
149.9
103.2
2.1
1.7
Coffee Day Enterprises
Neutral
251
-
5,164
2,692
2,964
17.0
18.6
-
4.7
-
52.9
3.1
2.9
0.2
5.5
2.4
2.2
Ltd
Navneet Education
Neutral
93
-
2,206
998
1,062
24.1
24.0
5.8
6.1
16.1
15.2
3.6
3.1
22.0
20.6
2.1
2.0
Navkar Corporation
Buy
205
265
2,919
347
408
43.2
42.9
6.7
6.8
30.7
30.2
2.3
2.1
7.3
6.9
8.7
7.9
UFO Moviez
Neutral
524
-
1,446
558
619
32.0
33.2
22.5
30.0
23.3
17.5
2.8
2.4
12.0
13.8
2.5
2.1
VRL Logistics
Neutral
310
-
2,824
1,725
1,902
16.5
16.7
12.2
14.6
25.4
21.3
5.3
4.7
20.8
21.9
1.6
1.4
Stock Watch
June 24, 2016
Company Name
Reco
CMP
Target Mkt Cap
Sales ( Čcr )
OPM(%)
EPS (Č)
PER(x)
P/BV(x)
RoE(%)
EV/Sales(x)
(Č)
Price ( Č)
( Č cr )
FY16E FY17E FY16E FY17E FY16E FY17E FY16E FY17E FY16E FY17E FY16E FY17E FY16E FY17E
zOthers
Team Lease Serv.
Neutral
921
-
1,575
2,565
3,229
1.3
1.5
15.2
22.8
60.7
40.5
4.9
4.3
8.0
10.7
0.5
0.4
S H Kelkar & Co.
Neutral
218
-
3,151
928
1,036
15.3
15.1
4.9
6.1
44.1
35.7
4.1
3.8
9.4
10.7
3.2
2.8
Quick Heal
Neutral
258
-
1,805
339
408
27.8
27.3
7.1
7.7
36.5
33.3
3.1
3.1
8.5
9.3
3.8
3.2
Narayana Hrudaya
Neutral
319
-
6,520
1,603
1,873
10.9
11.5
1.0
2.6
334.9
120.6
8.1
7.4
2.4
6.1
4.1
3.5
Manpasand Bever.
Neutral
526
-
2,634
540
836
19.9
19.6
10.2
16.9
51.4
31.2
4.2
3.7
8.1
12.0
4.7
3.0
Source: Company, Angel Research; Note: *December year end; #September year end; &October year end; Price as on June 23, 2016
Market Outlook
June 24, 2016
Research Team Tel: 022 - 39357800
DISCLAIMER
Angel Broking Private Limited (hereinafter referred to as “Angel”) is a registered Member of National Stock Exchange of India Limited,
Bombay Stock Exchange Limited and Metropolitian Stock Exchange of India Limited. It is also registered as a Depository Participant with
CDSL and Portfolio Manager with SEBI. It also has registration with AMFI as a Mutual Fund Distributor. Angel Broking Private Limited is a
registered entity with SEBI for Research Analyst in terms of SEBI (Research Analyst) Regulations, 2014 vide registration number
INH000000164. Angel or its associates has not been debarred/ suspended by SEBI or any other regulatory authority for accessing
/dealing in securities Market. Angel or its associates including its relatives/analyst do not hold any financial interest/beneficial ownership
of more than 1% in the company covered by Analyst. Angel or its associates/analyst has not received any compensation / managed or co
-managed public offering of securities of the company covered by Analyst during the past twelve months. Angel/analyst has not served as
an officer, director or employee of company covered by Analyst and has not been engaged in market making activity of the company
covered by Analyst.
This document is solely for the personal information of the recipient, and must not be singularly used as the basis of any investment
decision. Nothing in this document should be construed as investment or financial advice. Each recipient of this document should make
such investigations as they deem necessary to arrive at an independent evaluation of an investment in the securities of the companies
referred to in this document (including the merits and risks involved), and should consult their own advisors to determine the merits and
risks of such an investment.
Reports based on technical and derivative analysis center on studying charts of a stock's price movement, outstanding positions and
trading volume, as opposed to focusing on a company's fundamentals and, as such, may not match with a report on a company's
fundamentals.
The information in this document has been printed on the basis of publicly available information, internal data and other reliable sources
believed to be true, but we do not represent that it is accurate or complete and it should not be relied on as such, as this document is for
general guidance only. Angel Broking Pvt. Limited or any of its affiliates/ group companies shall not be in any way responsible for any
loss or damage that may arise to any person from any inadvertent error in the information contained in this report. Angel Broking Pvt.
Limited has not independently verified all the information contained within this document. Accordingly, we cannot testify, nor make any
representation or warranty, express or implied, to the accuracy, contents or data contained within this document. While Angel Broking
Pvt. Limited endeavors to update on a reasonable basis the information discussed in this material, there may be regulatory, compliance,
or other reasons that prevent us from doing so.
This document is being supplied to you solely for your information, and its contents, information or data may not be reproduced,
redistributed or passed on, directly or indirectly.
Neither Angel Broking Pvt. Limited, nor its directors, employees or affiliates shall be liable for any loss or damage that may arise from or
in connection with the use of this information.
Note: Please refer to the important ‘Stock Holding Disclosure' report on the Angel website (Research Section). Also, please refer to the
latest update on respective stocks for the disclosure status in respect of those stocks. Angel Broking Pvt. Limited and its affiliates may have
investment positions in the stocks recommended in this report.