Market Outlook
November 23, 2015
Market Cues
Domestic Indices
Chg (%)
(Pts)
(Close)
Indian markets are expected to open on a positive note tracking the SGX Nifty and
BSE Sensex
0.1
27
25,868
global cues.
Nifty
0.2
14
7,857
U.S. stocks closed in the green on Friday, marking its best week as big gains in
Mid Cap
0.9
93
10,858
shares of retail and technology companies pushed the indices higher.
Small Cap
0.6
68
11,368
The European markets edged higher, clocking three month highs. Talks of further
Bankex
(0.2)
(29)
19,471
stimulus measures from European Central Bank led to gains in the indices.
Indian markets closed with a marginal gain in a volatile trading session. The
Global Indices
Chg (%)
(Pts)
(Close)
markets gave up almost entire gains after rising 0.8% at day’s high. Rally in
Dow Jones
0.5
91
17,824
automotive stocks following a Seventh Central Pay commission which proposed a
Nasdaq
0.6
31
5,105
hefty 24% hike for Government employees had pushed the market higher in early
trade.
FTSE
0.1
5
6,335
Nikkei
0.1
20
19,880
News & Result Analysis
Hang Seng
1.1
254
22,755
Aurobindo Pharma gets USFDA nod for Sildenafil tablets
Shanghai Com
0.4
13
3,631
Bajaj Electricals to buy Hind Lamps manufacturing business
Detailed analysis on Pg2
Advances / Declines
BSE
NSE
Investor’s Ready Reckoner
Advances
1,464
879
Key Domestic & Global Indicators
Declines
1,190
624
Stock Watch: Latest investment recommendations on 150+ stocks
Unchanged
230
79
Refer P4 onwards
Top Picks
Volumes (` Cr)
CMP
Target
Upside
Company
Sector
Rating
BSE
2,554
(`)
(`)
(%)
NSE
15,316
Axis Bank
Financials
Buy
459
630
37.1
HCL Tech
IT
Buy
864
1,132
31.0
ICICI Bank
Financials
Buy
265
357
34.7
Net Inflows (` Cr)
Net
Mtd
Ytd
Ashok Leyland
Automobiles
Buy
94
111
18.6
FII
(307)
(4,350)
(19,170)
Larsen & Toubro
Construction
Buy
1,366
1,646
20.5
MFs
299
3,309
53,655
More Top Picks on Pg3
Top Gainers
Price (`)
Chg (%)
Key Upcoming Events
Previous
Consensus
Gail
349
10.1
Date
Region
Event Description
Reading
Expectations
Justdial
867
7.7
Nov 24
US
GDP (QoQ) (Q3)
1.5%
2.0%
Jindalstel
88
7.2
Nov 27
UK
GDP (QoQ) (Q3)
0.5%
-
Petronet
220
6.8
Dec 1
India
RBI Repo Rate
6.75%
-
Ibulhousing
654
6.4
Top Losers
Price (`)
Chg (%)
Pmcfin
1
(6.9)
Niittech
586
(3.5)
Gruh
255
(2.6)
Kec
154
(2.6)
Arvind
303
(2.3)
As on November 20, 2015
Market Outlook
November 23, 2015
Aurobindo Pharma gets USFDA nod for Sildenafil tablets
Aurobindo Pharma Ltd has announced that the company has received final
approval from the US Food & Drug Administration (USFDA) to manufacture
and market Sildenafil tablets, 20 mg. This product is expected to be launched by
Q4 FY 2015-16. The approved ANDA is bioequivalent and therapeutically
equivalent to the reference listed drug product REVATIO (sildenafil citrate) tablets
20 mg of Pfizer Inc, Aurobindo informed the BSE.
Sildenafil tablets are used in the treatment of pulmonary arterial hypertension
(high blood pressure in the lungs). The approved product has an estimated market
size of $80 million for the 12 months ended September 30, 2015. This is the 51st
ANDA to be approved out of Unit VII formulation facility in Hyderabad, India for
the manufacture of oral non-antibiotic products. Aurobindo now has 219 ANDA
approvals (190 final approvals, including 10 from Aurolife Pharma LLC and
29 Tentative approvals) from USFDA. We currently have Neutral rating on the
stock.
Bajaj Electricals to buy Hind Lamps mfg biz
Bajaj Electricals on Friday is considering to acquire the manufacturing business of
Shikohabad-based Hind Lamps Ltd. In a filing to BSE Bajaj Electricals stated that
the board of directors would meet on November 23, 2015 to consider a proposal
to acquire manufacturing business of Hind Lamps. Hind Lamps Ltd (HLL) is
engaged in the business of manufacturing of glass bulbs, HID bulbs and
aluminium caps, it added. The company has a manufacturing unit at Shikohabad,
District Firozabad, Uttar Pradesh and HID (High-intensity discharge) Lamps
manufacturing unit at Parwanoo, Himachal Pradesh. Established in 1951, HLL has
been declared a sick industrial company by the Board of Industrial and Financial
Reconstruction.
Economic and Political News
Pay commission could spook India's fiscal plans
Textile exports: Industry welcomes new interest subsidy scheme
Most corporate tax breaks may be phased out in FY18
Drought shadow on rabi sowing
Corporate News
R-Defence's 12 industrial licences okayed
Show-cause notice to NDTV by ED
Dabhol project to resume generation today
RasGas relaxation could help Petronet avoid `10k-cr hit
Market Outlook
November 23, 2015
Top Picks ★★★★★
Large Cap
Market Cap
CMP
Target
Upside
Company
Rationale
(` Cr)
(`)
(`)
(%)
To outpace battery industry growth due to better technological
Amara Raja Batteries
15,273
894
1,040
16.3
products leading to market share gains in both the automotive
OEM and replacement segments.
Earnings to grow strongly given the MHCV cyclical upturn.
Ashok Leyland
26,637
94
111
18.6
Focus on exports and LCV's provides additional growth
avenue.
Healthy pace of branch expansion, backed by distribution
Axis Bank
109,239
459
630
37.1
network, will be the driving force for the bank’s retail business
and overall earnings.
The stock is trading at attractive valuations and is factoring all
HCL Tech
121,532
864
1,132
31.0
the bad news.
Strong visibility for a robust 20% earnings trajectory, coupled
HDFC Bank
269,170
1,069
1,262
18.1
with high quality of earnings on account of high quality retail
business and strategic focus on highly rated corporates.
Due to its robust franchise and capital adequacy position, the
bank is well positioned to grow by at least a few percentage
ICICI Bank
153,787
265
357
34.7
points higher than the average industry growth rate from a
structural point of view.
Back on the growth trend, expect a long term growth of 14%
Infosys
241,845
1,053
1,306
24.0
to be a US$20bn in FY2020.
Well positioned to benefit from such expected gradual
recovery in the overall domestic capex cycle, given its presence
Larsen & Toubro
127,142
1,366
1,646
20.5
across various infrastructure segments, its execution
capabilities, and its strong balance sheet.
LICHF continues to grow its retail loan book at a healthy pace
with improvement in asset quality. We expect the company to
LIC Housing Finance
23,429
464
571
23.0
post a healthy loan book which is likely to reflect in a strong
earnings growth.
Source: Company, Angel Research
Mid Cap
Market Cap
CMP
Target
Upside
Company
Rationale
(` Cr)
(`)
(`)
(%)
Government thrust on Renewable sector and strong order
Inox Wind
8,161
368
505
37.3
book would drive future growth.
Change in business focus towards high-margin chronic and
Ipca labs
9,676
767
900
17.4
lifestyle segments and increasing penetration in Europe and
US
Economic recovery to have favourable impact on advertising &
circulation revenue growth. Further, the acquisition of a radio
Jagran Prakashan
4,676
143
169
18.1
business (Radio City) would also boost the company's revenue
growth.
Strong brand & quality teaching with innovative technologies
MT Educare
524
132
169
28.5
& higher government educational spending to boost growth
Earnings boost on back of stable material prices and
Radico Khaitan
1,636
123
156
26.8
favourable pricing environment. Valuation discount to peers
provides additional comfort
Strong brands and distribution network would boost growth
Siyaram Silk Mills
885
945
1,145
21.3
going ahead. Stock currently trades at an inexpensive
valuation.
Structural shift in the Lighting industry towards LED lighting will
Surya Roshni
575
131
183
39.5
drive growth.
Source: Company, Angel Research
Market Outlook
November 23, 2015
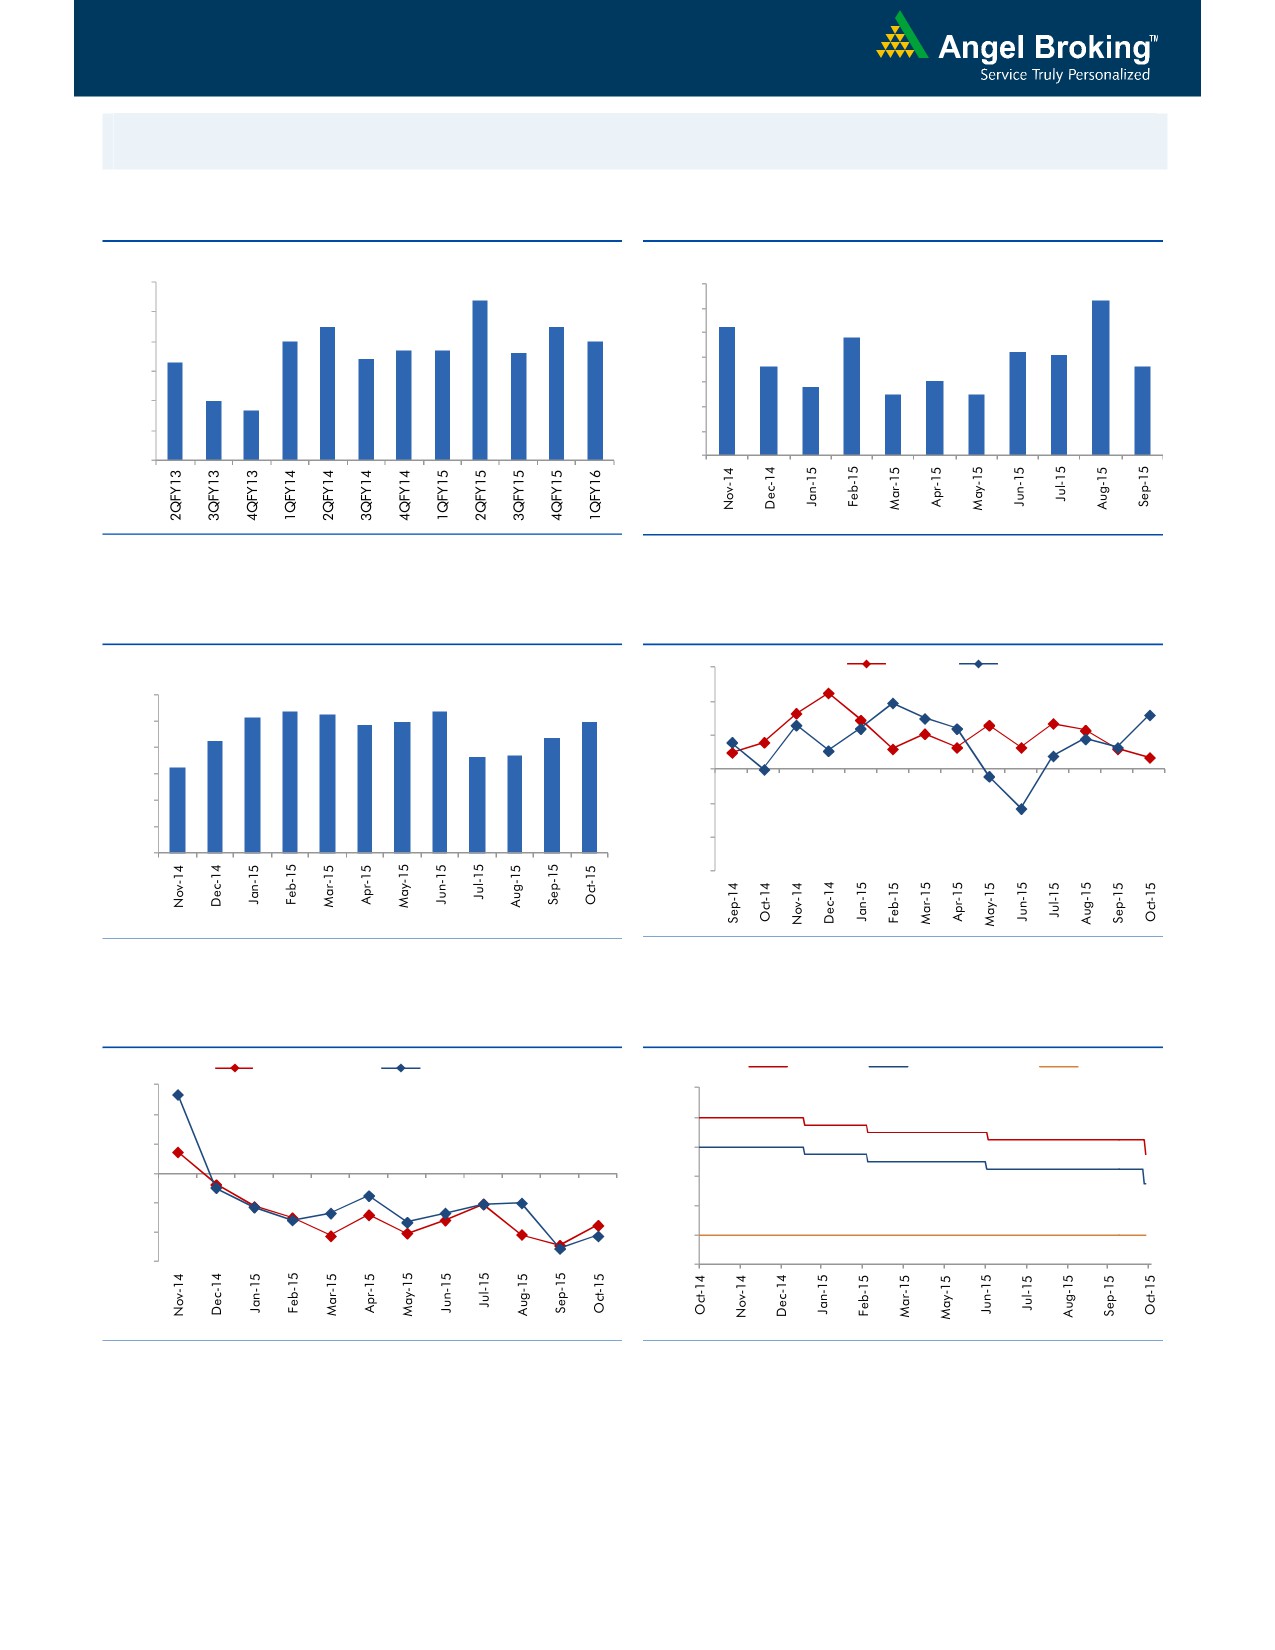
Macro watch
Exhibit 1: Quarterly GDP trends
Exhibit 2: IIP trends
(%)
(%)
9.0
8.4
7.0
6.3
8.0
7.5
7.5
6.0
5.2
7.0
7.0
4.8
6.7
6.7
5.0
4.2
7.0
6.4
6.6
4.1
6.3
3.6
3.6
4.0
6.0
2.8
3.0
2.5
2.5
5.0
3.0
4.7
5.0
2.0
4.0
1.0
3.0
-
Source: CSO, Angel Research
Source: MOSPI, Angel Research
Exhibit 3: Monthly CPI inflation trends
Exhibit 4: Manufacturing and services PMI
(%)
56.0
Mfg. PMI
Services PMI
6.0
5.2
5.4
5.3
5.4
4.9
5.0
5.0
54.0
5.0
4.3
4.4
3.7
3.7
52.0
4.0
3.3
50.0
3.0
2.0
48.0
1.0
46.0
-
44.0
Source: MOSPI, Angel Research
Source: Market, Angel Research; Note: Level above 50 indicates expansion
Exhibit 5: Exports and imports growth trends
Exhibit 6: Key policy rates
(%)
Exports yoy growth
Imports yoy growth
(%)
Repo rate
Reverse Repo rate
CRR
30.0
9.00
20.0
8.00
10.0
7.00
0.0
6.00
(10.0)
5.00
(20.0)
4.00
(30.0)
3.00
Source: Bloomberg, Angel Research
Source: RBI, Angel Research
Market Outlook
November 23, 2015
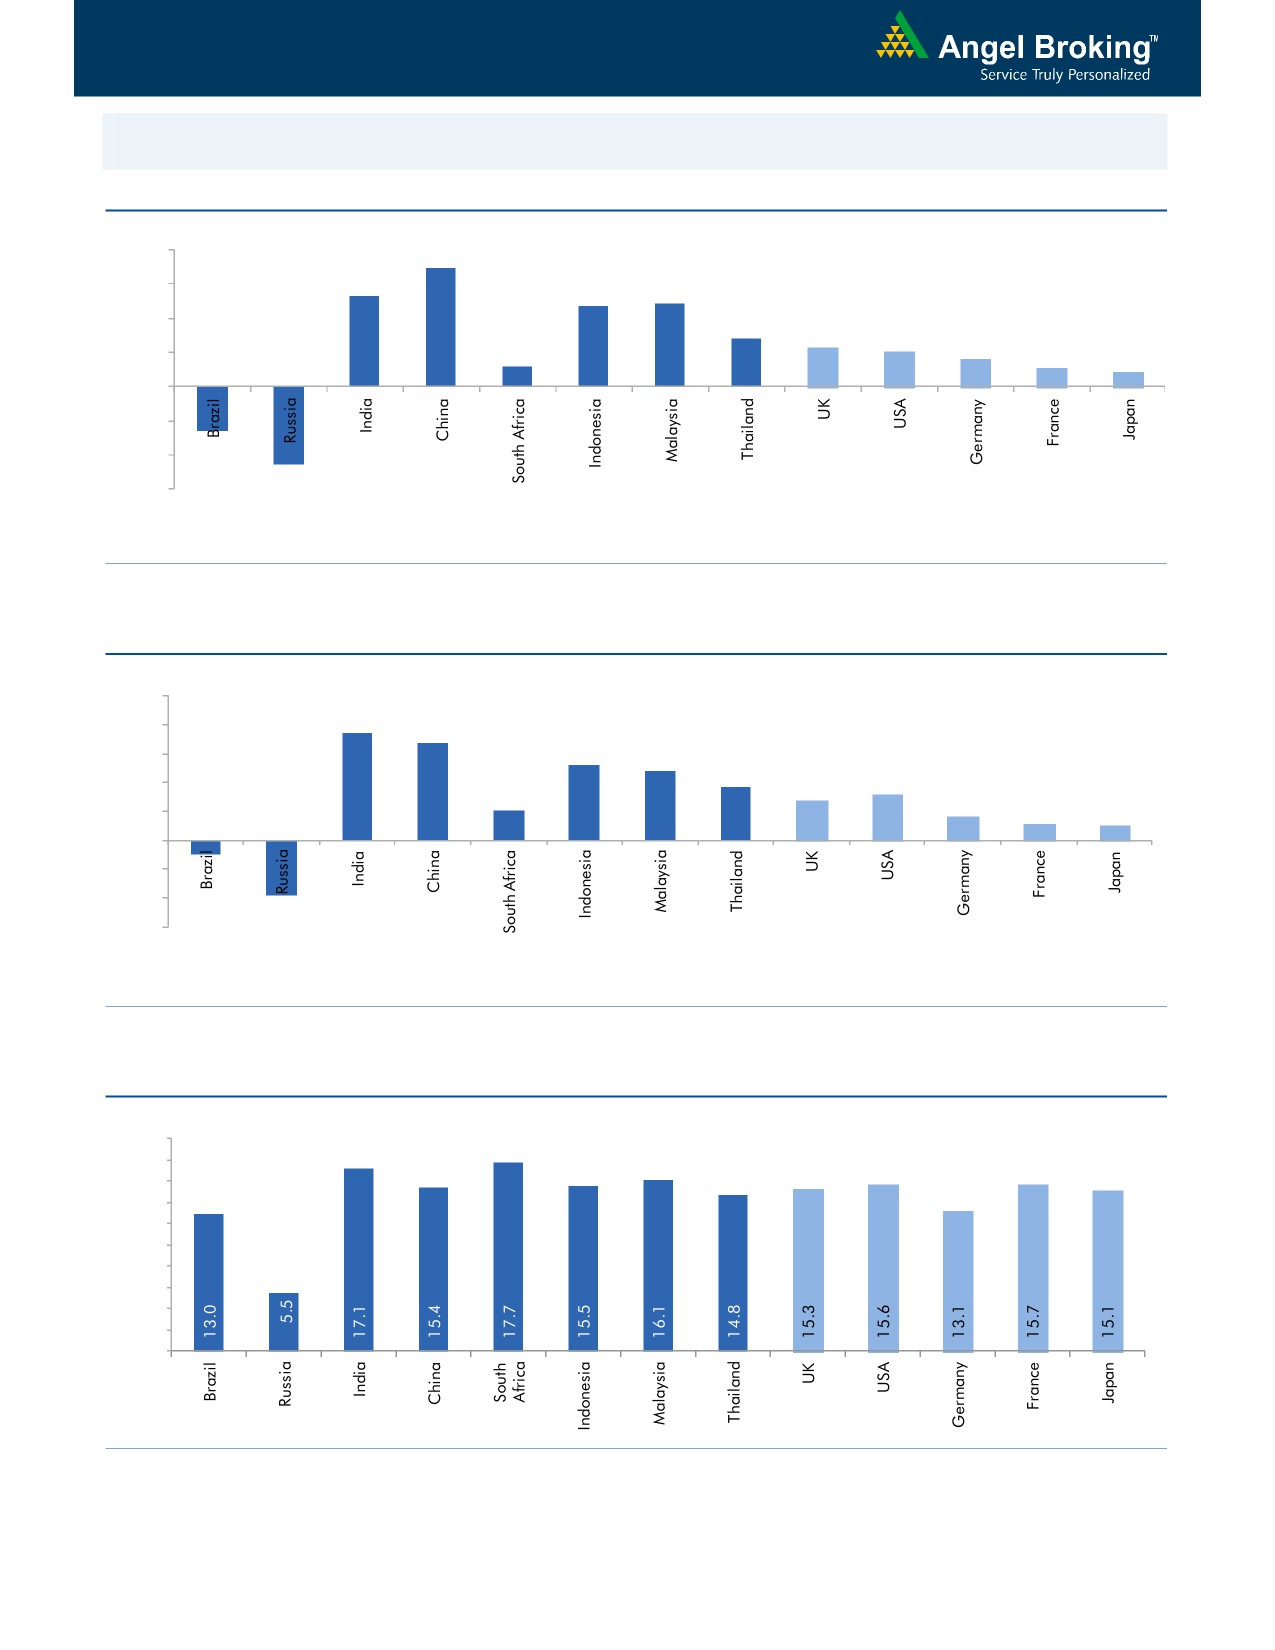
Global watch
Exhibit 1: Latest quarterly GDP Growth (%, yoy) across select developing and developed countries
(%)
8.0
6.9
6.0
5.3
4.9
4.7
4.0
2.8
2.3
2.0
1.6
2.0
1.2
1.1
0.8
(2.6)
-
(2.0)
(4.0)
(4.6)
(6.0)
Source: Bloomberg, Angel Research
Exhibit 2: 2015 GDP Growth projection by IMF (%, yoy) across select developing and developed countries
(%)
10.0
7.5
8.0
6.8
5.2
6.0
4.8
3.7
3.1
4.0
2.7
2.0
1.6
2.0
1.2
1.0
-
(2.0)
(4.0)
(1.0)
(3.8)
(6.0)
Source: IMF, Angel Research
Exhibit 3: One year forward P-E ratio across select developing and developed countries
(x)
20.0
18.0
16.0
14.0
12.0
10.0
8.0
6.0
4.0
2.0
-
Source: IMF, Angel Research
Market Outlook
November 23, 2015
Exhibit 4: Relative performance of indices across globe
Country
Name of index
Closing price
1M
1YR
Brazil
Bovespa
48,139
1.1
(14.2)
Russia
Micex
1,827
5.9
18.7
India
Nifty
7,857
(5.3)
(7.3)
China
Shanghai Composite
3,631
6.4
46.0
South Africa
Top 40
46,963
(3.8)
3.8
Mexico
Mexbol
44,895
(0.3)
0.6
Indonesia
LQ45
787
(2.2)
(10.4)
Malaysia
KLCI
1,662
(2.0)
(7.1)
Thailand
SET 50
896
(2.1)
(15.2)
USA
Dow Jones
17,824
1.0
0.1
UK
FTSE
6,335
(1.7)
(6.2)
Japan
Nikkei
19,880
5.6
14.5
Germany
DAX
11,120
3.0
14.3
France
CAC
4,911
(0.3)
13.0
Source: Bloomberg, Angel Research
Stock Watch
November 23, 2015
Company Name
Reco
CMP
Target
Mkt Cap
Sales ( Čcr )
OPM(%)
EPS (Č)
PER(x)
P/BV(x)
RoE(%)
EV/Sales(x)
(Č)
Price ( Č)
( Č cr )
FY16E FY17E
FY16E
FY17E
FY16E
FY17E
FY16E
FY17E
FY16E
FY17E
FY16E
FY17E
FY16E
FY17E
Agri / Agri Chemical
Rallis
Neutral
190
-
3,702
2,075
2,394
14.4
14.4
9.5
11.0
20.0
17.3
4.0
3.4
21.1
21.3
1.8
1.6
United Phosphorus
Accumulate
458
510
19,630
13,698
15,752
17.6
17.6
32.1
38.5
14.3
11.9
2.8
2.3
21.4
21.3
1.5
1.3
Auto & Auto Ancillary
Ashok Leyland
Buy
94
111
26,637
18,763
22,357
11.1
11.2
3.6
4.8
26.0
19.5
4.8
4.4
18.7
22.6
1.4
1.1
Bajaj Auto
Accumulate
2,469
2,672
71,430
24,115
27,600
21.3
21.0
136.8
157.2
18.0
15.7
5.8
5.0
32.2
31.5
2.5
2.2
Bharat Forge
Buy
869
1,016
20,218
8,013
9,250
20.0
20.3
35.2
43.1
24.7
20.2
4.9
4.0
21.6
21.8
2.6
2.2
Eicher Motors
Buy
16,409
19,036
44,538
15,379
16,498
15.6
16.6
473.2
574.8
34.7
28.6
12.8
9.5
36.7
33.2
2.8
2.6
Hero Motocorp
Neutral
2,564
-
51,193
28,561
31,559
14.7
14.7
151.1
163.2
17.0
15.7
6.6
5.6
38.7
35.6
1.6
1.4
L G Balakrishnan & Bros Neutral
480
-
753
1,254
1,394
11.6
11.8
35.9
41.7
13.4
11.5
1.8
1.6
13.5
13.8
0.7
0.6
Mahindra and Mahindra Accumulate
1,317
1,410
81,770
38,513
43,579
13.6
13.7
56.1
65.1
23.5
20.2
3.7
3.3
15.7
16.2
1.8
1.5
Maruti
Neutral
4,738
-
143,138
57,865
68,104
16.4
16.7
176.3
225.5
26.9
21.0
5.2
4.5
19.4
21.2
2.3
1.9
Minda Industries
Neutral
819
-
1,299
2,567
2,965
8.0
8.3
46.1
57.8
17.8
14.2
3.0
2.5
16.7
17.3
0.6
0.5
Motherson Sumi
Accumulate
284
313
37,565
39,343
45,100
8.8
9.1
10.1
12.5
28.1
22.7
8.9
7.0
35.3
34.4
1.0
0.9
Rane Brake Lining
Accumulate
332
366
263
454
511
11.1
11.4
23.8
28.1
14.0
11.8
2.0
1.8
14.2
15.3
0.7
0.7
Setco Automotive
Neutral
209
-
559
594
741
12.7
13.7
8.4
15.8
24.9
13.3
2.6
2.2
10.4
16.9
1.4
1.1
Tata Motors
Neutral
403
-
116,311
255,254
301,772
12.9
13.4
23.7
37.3
17.0
10.8
2.1
1.7
7.4
12.1
0.6
0.6
TVS Motor
Accumulate
293
313
13,941
11,845
14,040
7.2
9.0
10.4
17.4
28.2
16.9
7.1
5.4
25.1
32.0
1.2
1.0
Amara Raja Batteries
Buy
894
1,040
15,273
4,892
5,871
17.4
17.6
28.8
37.1
31.1
24.1
7.3
5.8
23.4
24.1
3.1
2.5
Exide Industries
Accumulate
149
162
12,640
6,950
7,784
14.4
14.8
6.6
7.3
22.5
20.4
2.8
2.6
12.6
12.8
1.5
1.4
Apollo Tyres
Accumulate
161
171
8,188
12,146
12,689
16.8
16.0
21.2
19.0
7.6
8.5
1.3
1.1
16.5
13.0
0.8
0.8
Ceat
Accumulate
1,040
1,119
4,208
6,041
6,597
14.1
13.7
99.5
111.9
10.5
9.3
2.1
1.7
19.6
18.5
0.8
0.7
JK Tyres
Neutral
96
-
2,182
7,446
7,669
15.2
14.0
19.6
18.4
4.9
5.2
1.2
1.0
25.2
19.5
0.7
0.6
Swaraj Engines
Neutral
928
-
1,152
552
630
14.2
14.7
44.6
54.1
20.8
17.2
4.8
4.4
23.2
25.6
1.9
1.7
Subros
Neutral
83
-
501
1,268
1,488
11.6
11.9
3.7
6.6
22.6
12.6
1.5
1.4
6.8
11.4
0.7
0.6
Indag Rubber
Neutral
203
-
533
283
329
17.0
17.2
13.0
15.4
15.7
13.2
3.4
2.8
21.8
21.6
1.6
1.3
Capital Goods
ACE
Neutral
45
-
441
660
839
4.7
8.2
1.0
3.9
44.6
11.4
1.4
1.2
3.2
11.3
0.8
0.6
BEML
Neutral
1,067
-
4,444
3,277
4,006
6.0
8.9
29.2
64.3
36.6
16.6
2.0
1.9
5.7
11.7
1.4
1.1
BGR Energy
Neutral
111
-
797
3,615
3,181
9.5
9.4
16.7
12.4
6.6
8.9
0.6
0.6
10.0
7.0
0.6
0.8
BHEL
Neutral
176
-
43,139
33,722
35,272
10.8
11.7
10.5
14.2
16.8
12.4
1.2
1.2
7.0
9.0
1.4
1.3
Blue Star
Accumulate
363
382
3,266
3,624
4,157
5.3
6.0
9.6
14.5
37.7
25.1
6.9
5.9
18.6
25.4
1.0
0.9
Stock Watch
November 23, 2015
Company Name
Reco
CMP
Target
Mkt Cap
Sales ( Čcr )
OPM(%)
EPS (Č)
PER(x)
P/BV(x)
RoE(%)
EV/Sales(x)
(Č)
Price ( Č)
( Č cr )
FY16E
FY17E
FY16E
FY17E
FY16E
FY17E
FY16E
FY17E
FY16E
FY17E
FY16E
FY17E
FY16E
FY17E
Capital Goods
Crompton Greaves
Accumulate
184
204
11,535
13,484
14,687
4.9
6.2
4.5
7.1
40.9
25.9
2.9
2.7
7.2
10.8
1.0
0.9
Inox Wind
Buy
368
505
8,161
4,980
5,943
17.0
17.5
26.6
31.6
13.8
11.6
4.1
3.0
35.0
30.0
1.8
1.4
KEC International
Neutral
154
-
3,963
8,791
9,716
6.1
6.8
5.4
8.2
28.6
18.8
2.9
2.6
10.0
14.0
0.7
0.6
Thermax
Neutral
878
-
10,464
6,413
7,525
7.4
8.5
30.5
39.3
28.8
22.3
4.4
3.9
15.0
17.0
1.6
1.3
Cement
ACC
Buy
1,340
1,630
25,163
13,151
14,757
16.4
18.3
63.9
83.4
21.0
16.1
2.7
2.5
13.3
16.1
1.8
1.5
Ambuja Cements
Buy
201
233
31,178
11,564
12,556
19.4
20.7
8.9
10.1
22.6
19.9
2.8
2.7
12.8
13.8
2.3
2.1
India Cements
Buy
82
112
2,514
4,216
4,840
18.0
19.5
4.0
9.9
20.5
8.3
0.8
0.8
4.0
9.5
0.9
0.7
JK Cement
Accumulate
661
744
4,622
3,661
4,742
10.1
15.8
18.0
61.0
36.7
10.8
2.7
2.4
7.5
22.9
1.7
1.3
J K Lakshmi Cement
Buy
345
430
4,059
2,947
3,616
16.7
19.9
11.5
27.2
30.0
12.7
2.9
2.5
9.8
20.8
1.8
1.4
Mangalam Cements
Neutral
194
-
518
1,053
1,347
10.5
13.3
8.4
26.0
23.1
7.5
1.0
0.9
4.3
12.5
0.9
0.6
Orient Cement
Accumulate
165
183
3,385
1,854
2,524
21.2
22.2
7.7
11.1
21.5
14.9
3.1
2.7
13.3
15.7
2.6
1.8
Ramco Cements
Neutral
373
-
8,886
4,036
4,545
20.8
21.3
15.1
18.8
24.7
19.9
3.0
2.7
12.9
14.3
2.7
2.3
Shree Cement^
Neutral
10,906
-
37,994
7,150
8,742
26.7
28.6
228.0
345.5
47.8
31.6
7.0
5.9
15.7
20.3
5.1
4.1
UltraTech Cement
Buy
2,775
3,282
76,152
25,021
30,023
19.1
21.6
89.0
132.0
31.2
21.0
3.6
3.1
12.2
15.9
3.1
2.6
Construction
ITNL
Neutral
91
-
3,000
7,360
8,825
34.0
35.9
1.0
5.0
91.2
18.2
0.4
0.4
0.3
1.4
3.8
3.7
KNR Constructions
Accumulate
608
673
1,710
937
1,470
14.3
14.0
33.5
38.6
18.2
15.8
2.8
2.4
15.4
15.4
1.9
1.2
Larsen & Toubro
Buy
1,366
1,646
127,142
64,148
73,241
11.5
11.7
62.0
66.0
22.0
20.7
2.3
2.1
13.4
14.0
2.2
1.9
Gujarat Pipavav Port
Neutral
167
-
8,049
629
684
51.0
52.2
6.4
5.9
26.0
28.2
3.4
3.2
15.9
12.7
12.5
11.2
MBL Infrastructures
Buy
215
285
891
2,313
2,797
12.2
14.6
19.0
20.0
11.3
10.8
1.2
1.1
11.3
10.6
1.1
1.0
Nagarjuna Const.
Neutral
79
-
4,409
7,892
8,842
8.3
9.1
2.4
5.3
33.0
15.0
1.3
1.2
4.2
8.6
0.8
0.7
PNC Infratech
Neutral
536
-
2,751
1,798
2,132
13.2
13.5
22.0
30.0
24.4
17.9
2.2
2.0
11.5
11.4
1.6
1.4
Simplex Infra
Neutral
328
-
1,620
6,241
7,008
10.4
10.7
20.0
36.0
16.4
9.1
1.3
1.2
6.8
11.1
0.8
0.7
Power Mech Projects
Neutral
608
-
3,654
1,539
1,801
12.8
12.7
59.0
72.1
10.3
8.4
2.5
2.2
18.6
16.8
2.4
2.0
Sadbhav Engineering
Neutral
315
-
2,205
3,481
4,219
10.7
10.8
8.0
12.0
39.3
26.2
1.3
1.2
10.3
13.5
0.9
0.8
National Buildings
Construction
Buy
936
1,089
7,494
7,382
9,506
7.7
8.6
39.8
54.4
23.5
17.2
3.8
3.4
26.7
29.1
0.8
0.6
Corporation
Sadbhav Infrastructure
Neutral
315
-
2,205
3,481
4,219
10.7
10.8
8.0
12.0
39.3
26.2
1.3
1.2
10.3
13.5
0.9
0.8
Project
Financials
Allahabad Bank
Neutral
74
-
4,444
8,332
9,259
2.8
2.8
21.0
25.6
3.5
2.9
0.4
0.3
9.8
10.9
-
-
Axis Bank
Buy
459
630
109,239
26,473
31,527
3.5
3.6
35.7
43.5
12.9
10.6
2.5
2.2
17.9
18.9
-
-
Bank of Baroda
Neutral
172
-
39,539
19,105
21,474
2.0
2.0
19.1
24.8
9.0
6.9
0.9
0.8
10.2
12.1
-
-
Stock Watch
November 23, 2015
Company Name
Reco
CMP
Target
Mkt Cap
Sales ( Čcr )
OPM(%)
EPS (Č)
PER(x)
P/BV(x)
RoE(%)
EV/Sales(x)
(Č)
Price ( Č)
( Č cr )
FY16E
FY17E
FY16E
FY17E
FY16E
FY17E
FY16E
FY17E
FY16E
FY17E
FY16E
FY17E
FY16E
FY17E
Financials
Bank of India
Neutral
130
-
10,263
15,972
17,271
1.9
2.0
15.3
33.4
8.5
3.9
0.4
0.3
3.6
7.6
-
-
Canara Bank
Neutral
269
-
14,604
15,251
16,725
2.0
2.0
59.3
68.6
4.5
3.9
0.5
0.4
10.1
10.7
-
-
Dena Bank
Neutral
42
-
2,362
3,440
3,840
2.1
2.3
7.3
10.0
5.8
4.2
0.4
0.4
6.1
7.9
-
-
Federal Bank
Neutral
56
-
9,672
3,477
3,999
3.0
3.0
5.0
6.2
11.2
9.0
1.1
1.0
10.6
11.9
-
-
HDFC
Neutral
1,204
-
189,945
10,358
11,852
3.3
3.3
41.1
47.0
29.3
25.6
5.6
5.1
24.7
24.9
-
-
HDFC Bank
Buy
1,069
1,262
269,170
38,309
47,302
4.3
4.3
49.3
61.1
21.7
17.5
3.8
3.2
18.5
19.7
-
-
ICICI Bank
Buy
265
357
153,787
35,168
40,517
3.4
3.4
21.4
25.2
12.4
10.5
2.1
1.8
14.7
15.2
-
-
IDBI Bank
Neutral
84
-
13,537
9,625
10,455
1.8
1.8
8.5
14.2
9.9
5.9
0.6
0.6
5.9
9.3
-
-
Indian Bank
Neutral
126
-
6,064
6,160
6,858
2.5
2.5
24.5
29.8
5.2
4.2
0.4
0.4
7.7
8.6
-
-
LIC Housing Finance
Buy
464
571
23,429
3,101
3,745
2.5
2.5
33.0
40.2
14.1
11.6
2.6
2.2
19.7
20.5
-
-
Oriental Bank
Neutral
147
-
4,421
7,643
8,373
2.4
2.4
37.2
45.4
4.0
3.3
0.4
0.3
8.2
9.4
-
-
Punjab Natl.Bank
Neutral
139
-
27,382
23,638
26,557
2.8
2.8
17.9
27.2
7.8
5.1
0.8
0.6
8.5
12.0
-
-
South Ind.Bank
Neutral
20
-
2,721
1,965
2,185
2.5
2.5
2.5
3.3
8.1
6.1
0.8
0.7
9.5
11.7
-
-
St Bk of India
Buy
243
283
188,635
82,520
93,299
2.7
2.8
20.0
24.5
12.1
9.9
1.3
1.2
11.5
12.8
-
-
Union Bank
Neutral
162
-
11,116
12,646
14,129
2.3
2.4
31.0
39.1
5.2
4.1
0.6
0.5
9.8
11.4
-
-
Vijaya Bank
Neutral
34
-
2,912
3,536
3,827
1.9
1.9
5.5
6.7
6.1
5.1
0.5
0.5
7.8
8.8
-
-
Yes Bank
Buy
732
914
30,641
7,228
9,043
3.2
3.3
57.7
69.4
12.7
10.6
2.3
1.9
19.1
19.6
-
-
FMCG
Asian Paints
Neutral
827
-
79,311
16,553
19,160
16.0
16.2
17.7
21.5
46.8
38.5
12.4
11.2
29.4
31.2
4.6
4.0
Britannia
Neutral
2,968
-
35,606
8,065
9,395
9.6
10.2
47.2
65.5
62.9
45.3
20.9
19.8
38.3
41.2
4.3
3.7
Colgate
Neutral
962
-
26,168
4,836
5,490
19.5
19.7
48.5
53.2
19.8
18.1
14.5
12.7
99.8
97.5
5.3
4.7
Dabur India
Neutral
275
-
48,269
9,370
10,265
17.1
17.2
7.3
8.1
37.5
33.9
11.3
9.2
33.7
30.6
5.1
4.6
GlaxoSmith Con*
Neutral
5,888
-
24,763
4,919
5,742
17.2
17.4
168.3
191.2
35.0
30.8
9.9
8.5
28.8
28.9
4.6
3.9
Godrej Consumer
Neutral
1,221
-
41,593
10,168
12,886
16.1
16.1
32.1
38.4
38.1
31.8
7.7
7.1
19.7
21.0
4.2
3.3
HUL
Neutral
798
-
172,677
34,940
38,957
17.5
17.7
20.8
24.7
38.4
32.3
42.7
34.1
110.5
114.2
4.7
4.2
ITC
Buy
344
409
276,432
41,068
45,068
37.8
37.4
13.9
15.9
24.8
21.7
8.3
7.3
34.1
33.8
6.4
5.8
Marico
Neutral
419
-
27,052
6,551
7,766
15.7
16.0
10.4
12.5
40.4
33.6
11.7
9.8
33.2
32.4
4.1
3.4
Nestle*
Accumulate
6,183
6,646
59,613
11,291
12,847
22.2
22.3
158.9
184.6
38.9
33.5
20.3
18.3
55.0
57.3
5.1
4.5
Tata Global
Accumulate
134
144
8,438
8,635
9,072
9.8
9.9
6.5
7.6
20.6
17.6
2.1
2.0
6.8
7.4
0.9
0.9
IT
HCL Tech^
Buy
864
1,132
121,532
42,038
47,503
23.2
23.5
55.8
62.9
15.5
13.7
3.6
2.7
23.0
19.8
2.5
2.0
Stock Watch
November 23, 2015
Company Name
Reco
CMP
Target
Mkt Cap
Sales ( Čcr )
OPM(%)
EPS (Č)
PER(x)
P/BV(x)
RoE(%)
EV/Sales(x)
(Č)
Price ( Č)
( Č cr )
FY16E FY17E
FY16E
FY17E
FY16E
FY17E
FY16E
FY17E
FY16E
FY17E
FY16E
FY17E
FY16E
FY17E
IT
Infosys
Buy
1,053
1,306
241,845
60,250
66,999
28.0
28.0
58.3
63.7
18.1
16.5
3.8
3.3
20.9
19.7
3.3
2.8
TCS
Buy
2,396
3,165
472,026
111,274
126,852
28.4
28.7
125.4
143.9
19.1
16.7
7.6
7.0
39.9
42.2
3.8
3.3
Tech Mahindra
Buy
534
646
51,401
25,566
28,890
16.0
17.0
26.3
31.9
20.3
16.8
3.7
3.1
17.9
18.6
1.8
1.5
Wipro
Buy
568
719
140,339
52,414
58,704
23.7
23.8
38.4
42.3
14.8
13.4
2.9
2.6
19.5
18.0
2.3
1.8
Media
D B Corp
Accumulate
319
356
5,865
2,241
2,495
27.8
27.9
21.8
25.6
14.7
12.5
3.8
3.4
26.7
28.5
2.6
2.3
HT Media
Neutral
76
-
1,779
2,495
2,603
11.2
11.2
7.3
8.6
10.5
8.9
0.8
0.8
7.4
8.1
0.2
0.2
Jagran Prakashan
Buy
143
169
4,676
2,170
2,355
27.0
27.6
12.8
10.3
11.1
13.9
3.1
2.9
21.8
19.4
1.9
1.6
Sun TV Network
Neutral
380
-
14,993
2,779
3,196
70.2
70.5
22.8
27.3
16.7
13.9
4.1
3.7
26.7
28.3
5.1
4.5
Hindustan Media
Neutral
273
-
2,003
920
1,031
20.0
20.0
19.2
20.9
14.2
13.1
2.3
2.0
16.4
15.3
1.7
1.5
Ventures
Metals & Mining
Coal India
Accumulate
333
380
210,556
76,167
84,130
19.9
22.3
22.4
25.8
14.9
12.9
5.4
5.2
35.5
41.0
2.1
1.9
Hind. Zinc
Buy
142
175
59,809
14,641
14,026
50.4
50.4
17.7
16.0
8.0
8.9
1.2
1.1
16.2
13.2
1.7
1.5
Hindalco
Neutral
77
-
15,962
104,356
111,186
8.7
9.5
6.7
11.1
11.5
7.0
0.4
0.4
3.5
5.9
0.7
0.6
JSW Steel
Neutral
896
-
21,646
42,308
45,147
16.4
20.7
(10.3)
49.5
18.1
1.0
1.0
(1.0)
5.6
1.6
1.5
NMDC
Neutral
92
-
36,396
8,237
10,893
46.6
44.5
10.0
11.7
9.2
7.9
1.0
0.9
12.5
13.0
4.2
3.2
SAIL
Neutral
44
-
18,358
45,915
53,954
7.2
10.5
1.5
4.4
29.5
10.2
0.4
0.4
2.3
4.1
1.0
0.9
Vedanta
Neutral
93
-
27,616
71,445
81,910
26.2
26.3
12.9
19.2
7.2
4.9
0.5
0.5
7.2
8.9
0.8
0.6
Tata Steel
Neutral
230
-
22,309
126,760
137,307
8.9
11.3
6.4
23.1
36.1
10.0
0.7
0.7
2.0
7.1
0.8
0.7
Oil & Gas
Cairn India
Neutral
137
-
25,667
11,323
12,490
49.4
51.0
20.7
20.7
6.6
6.6
0.4
0.4
6.4
6.1
1.3
0.7
GAIL
Neutral
349
-
44,244
64,856
70,933
9.1
9.6
24.0
28.9
14.6
12.1
1.2
1.2
8.8
9.6
0.9
0.8
ONGC
Neutral
234
-
199,899
154,564
167,321
36.8
37.4
28.6
32.5
8.2
7.2
1.0
1.0
12.7
13.5
1.5
1.4
Petronet LNG
Neutral
220
-
16,508
29,691
31,188
5.8
6.2
12.8
13.4
17.2
16.4
2.6
2.3
15.8
14.8
0.6
0.6
Indian Oil Corp
Accumulate
411
455
99,874
359,607
402,760
5.9
6.1
42.5
48.7
9.7
8.4
1.3
1.2
14.1
14.4
0.4
0.3
Reliance Industries
Accumulate
946
1,050
306,339
304,775
344,392
12.6
13.4
91.3
102.6
10.4
9.2
1.2
1.1
11.8
12.0
0.9
0.8
Pharmaceuticals
Alembic Pharma
Neutral
658
-
12,399
2,658
3,112
24.1
20.2
24.6
23.9
26.7
27.5
9.6
7.3
42.5
30.2
4.7
3.9
Aurobindo Pharma
Neutral
832
-
48,595
14,923
17,162
23.0
23.0
38.2
43.6
21.8
19.1
6.7
5.1
36.0
30.2
3.6
3.1
Aventis*
Neutral
4,456
-
10,262
2,082
2,371
17.4
20.8
118.2
151.5
37.7
29.4
5.5
4.4
19.9
25.5
4.6
3.8
Cadila Healthcare
Neutral
417
-
42,721
10,224
11,840
21.0
22.0
14.6
17.6
28.6
23.7
7.8
6.1
30.8
29.0
4.2
3.6
Cipla
Neutral
646
-
51,877
14,211
16,611
20.6
19.0
27.0
28.9
23.9
22.4
4.1
3.5
18.4
16.8
3.6
3.0
Dr Reddy's
Buy
3,349
3,933
57,107
16,838
19,575
25.0
23.1
167.5
178.8
20.0
18.7
4.2
3.5
23.1
20.4
3.3
2.8
Stock Watch
November 23, 2015
Company Name
Reco
CMP
Target
Mkt Cap
Sales ( Čcr )
OPM(%)
EPS (Č)
PER(x)
P/BV(x)
RoE(%)
EV/Sales(x)
(Č)
Price ( Č)
( Č cr )
FY16E FY17E
FY16E
FY17E
FY16E
FY17E
FY16E
FY17E
FY16E
FY17E
FY16E
FY17E
FY16E
FY17E
Pharmaceuticals
Dishman Pharma
Neutral
330
-
2,660
1,733
1,906
21.5
21.5
17.0
19.9
19.4
16.6
2.0
1.8
10.5
11.2
2.1
1.8
GSK Pharma*
Neutral
3,193
-
27,048
2,870
3,158
20.0
22.1
59.5
68.3
53.7
46.8
15.8
16.3
28.5
34.3
8.9
8.2
Indoco Remedies
Neutral
300
-
2,768
1,033
1,199
15.9
18.2
9.4
13.6
32.0
22.1
4.7
4.0
15.7
19.7
2.8
2.4
Ipca labs
Buy
767
900
9,676
3,363
3,909
12.9
18.6
13.4
28.0
57.2
27.4
7.5
6.0
7.4
14.0
3.2
2.7
Lupin
Neutral
1,814
-
81,663
13,092
16,561
25.0
27.0
50.4
68.3
36.0
26.6
7.4
5.9
22.8
24.7
6.0
4.6
Sun Pharma
Buy
727
950
174,828
28,163
32,610
25.8
30.7
17.4
26.9
41.8
27.0
4.0
3.4
13.0
16.6
5.7
4.7
Power
Tata Power
Neutral
67
-
17,999
35,923
37,402
22.6
22.8
4.1
5.2
16.4
12.9
1.3
1.2
7.5
9.3
1.5
1.3
NTPC
Buy
134
157
110,572
87,064
98,846
23.5
23.5
11.7
13.2
11.5
10.2
1.3
1.2
11.4
12.1
2.3
2.0
Power Grid
Buy
131
170
68,325
20,702
23,361
86.7
86.4
12.1
13.2
10.8
9.9
1.6
1.4
15.6
15.1
8.2
7.7
Telecom
Bharti Airtel
Neutral
340
-
135,972
101,748
109,191
32.1
31.7
12.0
12.5
28.4
27.2
2.0
1.8
6.9
6.7
2.0
1.8
Idea Cellular
Neutral
136
-
48,883
34,282
36,941
32.0
31.5
5.9
6.2
23.0
21.9
2.1
1.9
9.9
9.3
2.0
1.9
zOthers
Abbott India
Neutral
5,200
-
11,050
2,715
3,153
14.5
14.1
134.3
152.2
38.7
34.2
9.7
8.0
27.4
25.6
3.8
3.2
Bajaj Electricals
Buy
229
341
2,310
4,719
5,287
5.2
5.8
8.6
12.7
26.8
18.1
3.1
2.7
11.4
14.8
0.5
0.4
Finolex Cables
Neutral
265
-
4,048
2,520
2,883
12.2
12.0
12.7
14.2
20.9
18.6
2.8
2.5
13.6
13.5
1.4
1.1
Goodyear India*
Accumulate
559
622
1,288
1,888
1,680
12.1
11.9
62.2
56.6
9.0
9.9
2.1
1.8
25.9
19.7
0.5
0.5
Hitachi
Neutral
1,353
-
3,680
1,779
2,081
7.8
8.8
21.8
33.4
62.1
40.5
10.0
8.1
17.4
22.1
2.1
1.8
Jyothy Laboratories
Neutral
300
-
5,426
1,620
1,847
11.5
11.5
7.3
8.5
41.1
35.4
5.3
4.9
13.3
14.4
3.2
2.7
MRF
Buy
39,359
45,575
16,693
20,316
14,488
21.4
21.1
5,488.0
3,798.0
7.2
10.4
2.5
2.0
41.1
21.2
0.8
1.0
Page Industries
Neutral
13,121
-
14,634
1,929
2,450
19.8
20.1
229.9
299.0
57.1
43.9
25.2
17.5
52.1
47.1
7.6
6.0
Relaxo Footwears
Neutral
498
-
5,980
1,767
2,152
12.3
12.5
19.3
25.1
25.9
19.9
6.4
4.9
27.7
27.8
3.4
2.8
Siyaram Silk Mills
Buy
945
1,145
885
1,636
1,815
11.5
11.5
89.9
104.1
10.5
9.1
1.7
1.5
17.9
17.8
0.7
0.6
Styrolution ABS India*
Neutral
729
-
1,282
1,271
1,440
8.6
9.2
32.0
41.1
22.8
17.8
2.3
2.1
10.7
12.4
1.0
0.8
Tree House
Buy
222
314
941
256
315
57.2
57.5
16.5
21.0
13.5
10.6
1.3
1.2
9.6
10.9
3.8
3.2
TVS Srichakra
Buy
2,737
3,240
2,095
2,101
2,338
15.7
15.0
248.6
270.0
11.0
10.1
4.8
3.5
43.6
34.0
1.0
0.9
HSIL
Neutral
289
-
2,089
2,123
2,384
16.1
16.5
15.0
18.9
19.2
15.3
1.5
1.4
8.0
9.4
1.3
1.2
Kirloskar Engines India
Neutral
265
-
3,837
2,471
2,826
8.8
10.4
9.1
13.3
29.1
19.9
2.8
2.6
9.7
13.4
1.2
1.0
Ltd
M M Forgings
Buy
513
614
619
511
615
21.7
21.6
43.1
55.8
11.9
9.2
2.2
1.8
19.9
21.2
1.4
1.1
Banco Products (India)
Neutral
127
-
911
1,208
1,353
11.0
12.3
10.8
14.5
11.8
8.8
1.4
1.2
11.9
14.5
0.7
0.6
Competent Automobiles Neutral
139
-
86
1,040
1,137
3.2
3.1
25.7
28.0
5.4
5.0
0.8
0.7
15.0
14.3
0.1
0.1
Stock Watch
November 23, 2015
Company Name
Reco
CMP
Target Mkt Cap
Sales ( Čcr )
OPM(%)
EPS (Č)
PER(x)
P/BV(x)
RoE(%)
EV/Sales(x)
(Č)
Price ( Č)
( Č cr )
FY16E FY17E FY16E FY17E FY16E FY17E FY16E FY17E FY16E FY17E FY16E FY17E FY16E FY17E
zOthers
Nilkamal
Neutral
991
-
1,478
1,910
2,083
10.5
10.3
63.3
69.2
15.6
14.3
2.6
2.2
17.6
16.5
0.8
0.7
Visaka Industries
Buy
118
144
187
1,086
1,197
9.9
10.3
21.5
28.8
5.5
4.1
0.5
0.5
9.6
11.6
0.4
0.3
Transport Corporation of
Neutral
302
-
2,294
2,830
3,350
8.8
9.0
14.4
18.3
21.0
16.5
3.2
2.8
15.4
17.1
0.9
0.8
India
Elecon Engineering
Neutral
83
-
906
1,369
1,533
13.7
14.9
3.3
6.1
25.1
13.7
1.6
1.5
6.6
11.4
1.0
0.9
Surya Roshni
Buy
131
183
575
2,992
3,223
8.1
8.4
14.7
18.3
8.9
7.2
0.8
0.8
9.7
11.0
0.5
0.4
MT Educare
Buy
132
169
524
286
366
18.3
17.7
7.7
9.4
17.0
14.0
3.6
3.1
20.2
21.1
1.7
1.3
Radico Khaitan
Buy
123
156
1,636
1,565
1,687
12.2
13.0
5.7
7.1
21.6
17.3
1.8
1.7
8.3
9.6
1.5
1.4
Garware Wall Ropes
Buy
349
423
763
861
967
10.9
10.9
24.0
28.2
14.5
12.4
2.1
1.8
14.6
14.9
0.9
0.8
Wonderla Holidays
Neutral
391
-
2,207
206
308
44.0
43.6
9.0
12.9
43.4
30.3
5.9
5.4
13.7
17.8
10.6
7.1
Linc Pen & Plastics
Accumulate
171
185
252
340
371
8.3
8.9
10.8
13.2
15.8
12.9
2.5
2.2
16.0
17.1
0.8
0.7
The Byke Hospitality
Accumulate
168
181
672
222
287
20.5
20.5
5.6
7.6
29.7
22.2
5.6
4.6
18.9
20.8
3.1
2.4
Interglobe Aviation
Neutral
1,104
-
39,787
17,022
21,122
20.7
14.5
63.9
53.7
17.3
20.6
25.9
21.2
149.9
103.2
2.4
1.9
Navneet Education
Accumulate
86
97
432
998
1,062
24.1
24.0
5.8
6.1
15.0
14.2
3.3
2.9
22.0
20.6
0.5
0.5
Source: Company, Angel Research; Note: *December year end; #September year end; &October year end; Price as on November 20, 2015
Market Outlook
November 23, 2015
Research Team Tel: 022 - 39357800
DISCLAIMER
Angel Broking Private Limited (hereinafter referred to as “Angel”) is a registered Member of National Stock Exchange of India Limited,
Bombay Stock Exchange Limited and Metropolitian Stock Exchange of India Limited. It is also registered as a Depository Participant with
CDSL and Portfolio Manager with SEBI. It also has registration with AMFI as a Mutual Fund Distributor. Angel Broking Private Limited is a
registered entity with SEBI for Research Analyst in terms of SEBI (Research Analyst) Regulations, 2014 vide registration number
INH000000164. Angel or its associates has not been debarred/ suspended by SEBI or any other regulatory authority for accessing
/dealing in securities Market. Angel or its associates including its relatives/analyst do not hold any financial interest/beneficial ownership
of more than 1% in the company covered by Analyst. Angel or its associates/analyst has not received any compensation / managed or co
-managed public offering of securities of the company covered by Analyst during the past twelve months. Angel/analyst has not served as
an officer, director or employee of company covered by Analyst and has not been engaged in market making activity of the company
covered by Analyst.
This document is solely for the personal information of the recipient, and must not be singularly used as the basis of any investment
decision. Nothing in this document should be construed as investment or financial advice. Each recipient of this document should make
such investigations as they deem necessary to arrive at an independent evaluation of an investment in the securities of the companies
referred to in this document (including the merits and risks involved), and should consult their own advisors to determine the merits and
risks of such an investment.
Reports based on technical and derivative analysis center on studying charts of a stock's price movement, outstanding positions and
trading volume, as opposed to focusing on a company's fundamentals and, as such, may not match with a report on a company's
fundamentals.
The information in this document has been printed on the basis of publicly available information, internal data and other reliable sources
believed to be true, but we do not represent that it is accurate or complete and it should not be relied on as such, as this document is for
general guidance only. Angel Broking Pvt. Limited or any of its affiliates/ group companies shall not be in any way responsible for any
loss or damage that may arise to any person from any inadvertent error in the information contained in this report. Angel Broking Pvt.
Limited has not independently verified all the information contained within this document. Accordingly, we cannot testify, nor make any
representation or warranty, express or implied, to the accuracy, contents or data contained within this document. While Angel Broking
Pvt. Limited endeavors to update on a reasonable basis the information discussed in this material, there may be regulatory, compliance,
or other reasons that prevent us from doing so.
This document is being supplied to you solely for your information, and its contents, information or data may not be reproduced,
redistributed or passed on, directly or indirectly.
Neither Angel Broking Pvt. Limited, nor its directors, employees or affiliates shall be liable for any loss or damage that may arise from or
in connection with the use of this information.
Note: Please refer to the important ‘Stock Holding Disclosure' report on the Angel website (Research Section). Also, please refer to the
latest update on respective stocks for the disclosure status in respect of those stocks. Angel Broking Pvt. Limited and its affiliates may have
investment positions in the stocks recommended in this report.