Market Outlook
September 23, 2015
Dealer’s Diary
Domestic Indices
Chg (%)
(Pts)
(Close)
BSE Sensex
(2.1)
(541)
25,652
Indian markets are expected to open in the red tracking the SGX Nifty and mixed
Nifty
(2.1)
(165)
7,812
Asian cues.
MID CAP
(1.6)
(168)
10,525
US markets closed in the red led by ongoing uncertainty about the outlook for U.S.
SMALL CAP
(1.2)
(132)
10,803
monetary policy. Weakness in the European markets also weighed on U.S. stocks,
BSE HC
(0.5)
(80)
17,365
with the major averages in the region all pulling back sharply.
BSE PSU
(2.5)
(171)
6,670
European markets finished in the red as auto stocks came under severe pressure
BANKEX
(3.0)
(612)
19,502
after Volkswagen admitted to manipulating emission tests norms for diesel cars in
AUTO
(1.7)
(305)
17,297
the United States. Drug companies were also down on the news that Hillary Clinton
METAL
(4.2)
(309)
6,977
will unveil a plan to take on check pricing in the specialty drug market. Mining and
OIL & GAS
(1.3)
(111)
8,615
resource companies were also weak, due to falling commodity prices.
BSE IT
(0.2)
(24)
11,206
Indian markets tumbled in the second half led by negative cues from European
Global Indices
Chg (%)
(Pts)
(Close)
markets and U.S. index futures. Increased volatility ahead of the expiry of September
Dow Jones
(1.1)
(180)
16,330
series F&O contracts also prompted investors to book some profits at higher levels.
NASDAQ
(1.5)
(72.2)
4,757
FTSE
(2.8)
(173)
5,936
News & Result Analysis
Nikkei
(2.0)
(362)
18,070
UltraTech commissions 1.6 MTPA grinding unit in Haryana
Hang Seng
0.2
40
21,797
Global steel production fell by 3% in August 2015, lead by China
Refer detailed news analysis on the following page
Straits Times
(0.5)
(14)
2,868
Shanghai Com
0.9
29
3,186
Markets Today
The trend deciding level for the day is 25,854 / 7,874 levels. If NIFTY trades above
this level during the first half-an-hour of trade then we may witness a further rally up
Indian ADR
Chg (%)
(Pts)
(Close)
to 26,137 - 26,622 / 7,960 - 8,108 levels. However, if NIFTY trades below
INFY
(0.6)
(0.1)
$17.8
25,854 / 7,874 levels for the first half-an-hour of trade then it may correct towards
WIT
(2.8)
(0.3)
$11.8
26,369 - 25,086 / 7,726 - 7,640 levels.
IBN
(3.0)
(0.2)
$8.4
Indices
S2
S1
PIVOT
R1
R2
HDB
(1.8)
(1.1)
$58.4
SENSEX
25,086
25,369
25,854
26,137
26,622
Advances / Declines
BSE
NSE
NIFTY
7,640
7,726
7,874
7,960
8,108
Advances
971
1,040
Declines
1,710
454
Net Inflows (September 21, 2015)
` cr
Purch
Sales
Net
MTD
YTD
Unchanged
108
69
FII
3,848
3,402
446
(1,790)
121,971
Volumes (` cr)
MFs
724
639
85
5,110
75,758
BSE
2,279
FII Derivatives (September 22, 2015)
NSE
17,370
` cr
Purch
Sales
Net
Open Interest
Index Futures
9,695
10,392
(697)
31,444
Stock Futures
16,834
15,586
1,248
49,830
Gainers / Losers
Gainer
Loser
Company
Price (`)
chg (%)
Company
Price (`)
chg (%)
INDHOTEL
91
4.3
AMTEKAUTO
46
(11.5)
JUSTDIAL
1,470
3.8
MOTHERSUMI
242
(7.7)
NCC
70
3.3
VEDL
92
(6.3)
INFRATEL
414
3.3
HINDALCO
73
(6.2)
RAJESHEXPO
429
2.4
JPPOWER
6
(6.2)
Market Outlook
September 23, 2015
UltraTech commissions 1.6 MTPA grinding unit in Haryana
UltraTech Cement has commissioned its grinding unit with a capacity of 1.6
million tonnes per annum (MTPA) in Jhajjar, Haryana, aimed at increasing the
firm's slice in the north region -- that accounts for a lion's share of India's cement
market -particularly the National Capital Region (NCR) and Haryana. With
commissioning of the firm's 13th unit, UltraTech's total cement capacity has
reached 63.1 MTPA.
North region accounts for 35% of the cement demand in the country and is
expected to grow at around 8%. The commissioning of this plant will help Ultratech
in capturing the growing demand for cement in the northern region with timely
and effective supplies to customers. We retain our Buy rating on the stock.
Global steel production fell by 3% in August 2015, lead by China
Global steel production fell by 3% in August 2015, its biggest fall this year led by
decline in China's steel production. India however reported a 2.8% growth in steel
output during the month compared to same month last year. World steel
production went down to 132MT last month, as China registered a 3.5% drop in
steel output to 66.9MT. Despite the threat of imports, India produced 7.66MT in
August 2015 compared to 7.45MT in August 2014, according to the World Steel
Association (WSA). Crude steel capacity utilisation ratio for 65 countries in August
2015 was 68%. This was 3.6 percentage points lower than August 2014 and 0.4
percentage points lower than July 2015.
Economic and Political News
Centre may start auction of 80-90 identified mine blocks by November
Hotel occupancy in India surpassed 60% for the first time in four years
Engineering exports plunge on slowdown in China demand: EEPC
Corporate News
MindTree to invest `125cr for Bhubaneswar campus expansion
Pidilite eyes `900cr from construction chemical division
Indraprastha Gas Ltd provided 100,000 new piped gas connections in FY15
Market Outlook
September 23, 2015
Top Picks
Large Cap
Market Cap
CMP
Target
Upside
Company
Sector
Rating
(` Cr)
(`)
(`)
(%)
Aurobindo
Pharma
41,806
Buy
716
872
21.8
Axis Bank
Financials
1,21,030
Buy
509
701
37.7
ICICI Bank
Financials
1,57,176
Buy
271
370
36.7
Infosys
IT
2,53,927
Buy
1,106
1,306
18.1
Capital
Inox Wind
8,066
Buy
363
505
38.9
Goods
LIC HFL
Financials
21,971
Buy
435
570
30.9
Power Grid
Power
68,455
Buy
131
170
29.9
TCS
IT
4,94,843
Buy
2,526
3,168
25.4
Tech Mahindra IT
53,643
Buy
558
646
15.9
Yes Bank
Financials
30,691
Buy
733
953
30.0
Sun Pharma
Pharma
2,16,808 Accumulate
901
950
5.4
Source: Angel Research, Bloomberg
Mid Cap
Market Cap (`
CMP
Target
Upside
Company
Sector
Rating
Cr)
(`)
(`)
(%)
Bajaj Electricals
Others
2,524
Buy
250
341
36.3
Garware Wall
Others
692
Buy
316
390
23.4
MBL Infra
Construction
1,017
Buy
245
360
46.7
Minda Industries
Auto Ancillary
820
Buy
517
652
26.2
MT Educare
Others
502
Buy
126
169
34.0
Radico Khaitan
Others
1,122
Buy
84
112
32.8
Surya Roshni
Others
540
Buy
123
183
48.7
Tree House
Others
1,498
Buy
354
449
26.9
Source: Angel Research, Bloomberg
Market Outlook
September 23, 2015
Global economic events release calendar
Date
Time
Country
Event Description
Unit
Period
Bloomberg Data
Last Reported Estimated
September 23, 2015
1:00PM
Germany PMI Services
Value
Sep P
54.90
54.50
1:00PM
Germany PMI Manufacturing
Value
Sep P
53.30
52.60
September 24, 2015
6:00PM
US
Initial Jobless claims
Thousands
Sep 19
264.00
272.00
7:30PM
US
New home sales
Thousands
Aug
507.00
515.00
September 25, 2015
6:00PM
US
GDP Qoq (Annualised)
% Change
2Q T
3.70
3.70
September 29, 2015
7:30PM
US
Consumer Confidence
S.A./ 1985=100
Sep
101.54
97.00
11:00AM
India
RBI Reverse Repo rate
%
Sep 29
6.25
6.00
11:00AM
India
RBI Repo rate
%
Sep 29
7.25
7.00
11:00AM
India
RBI Cash Reserve ratio
%
Sep 29
4.00
4.00
September 30, 2015
1:25PM
Germany Unemployment change (000's)
Thousands
Sep
(7.00)
--
2:00PM
UK
GDP (YoY)
% Change
2Q F
2.60
--
October 1, 2015
6:30AM
China
PMI Manufacturing
Value
Sep
49.70
--
2:00PM
UK
PMI Manufacturing
Value
Sep
51.50
--
October 2, 2015
6:00PM
US
Change in Nonfarm payrolls
Thousands
Sep
173.00
200.00
6:00PM
US
Unnemployment rate
%
Sep
5.10
5.10
October 7, 2015
2:00PM
UK
Industrial Production (YoY)
% Change
Aug
0.80
--
October 8, 2015
4:30PM
UK
BOE Announces rates
% Ratio
Oct 8
0.50
0.50
October 9, 2015
India
Imports YoY%
% Change
Sep
(9.95)
--
India
Exports YoY%
% Change
Sep
(20.66)
--
October 12, 2015
5:30PM
India
Industrial Production YoY
% Change
Aug
4.20
--
October 13, 2015
2:00PM
UK
CPI (YoY)
% Change
Sep
--
--
China
Exports YoY%
% Change
Sep
(5.50)
--
October 14, 2015
2:00PM
UK
Jobless claims change
% Change
Sep
1.20
--
12:00PM
India
Monthly Wholesale Prices YoY%
% Change
Sep
(4.95)
--
7:00AM
China
Consumer Price Index (YoY)
% Change
Sep
2.00
--
October 15, 2015
6:00PM
US
Consumer price index (mom)
% Change
Sep
(0.10)
--
October 16, 2015
6:45PM
US
Industrial Production
%
Sep
(0.38)
--
2:30PM
Euro Zone Euro-Zone CPI (YoY)
%
Sep F
0.10
--
October 19, 2015
7:30AM
China
Industrial Production (YoY)
% Change
Sep
6.10
--
7:30AM
China
Real GDP (YoY)
% Change
3Q
7.00
--
Source: Bloomberg, Angel Research
Market Outlook
September 23, 2015
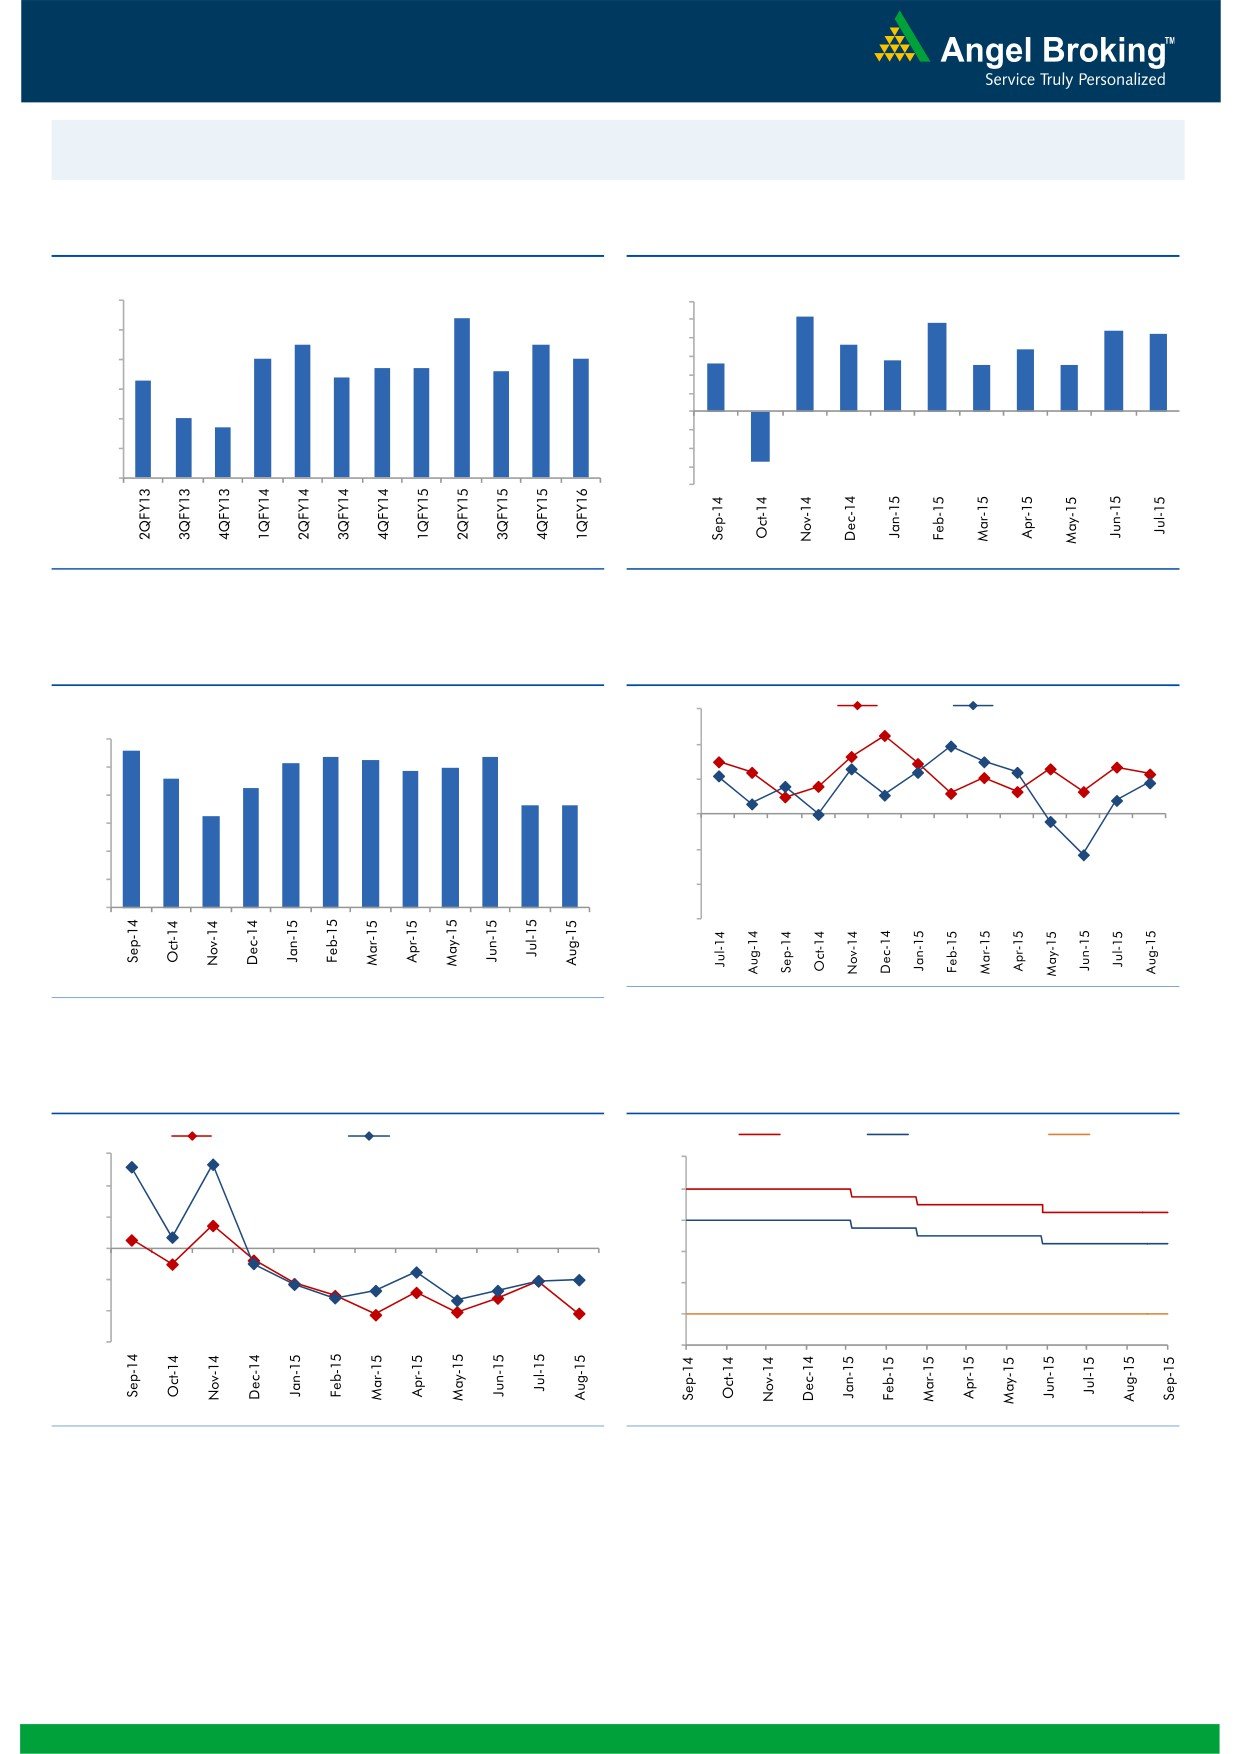
Macro watch
Exhibit 1: Quarterly GDP trends
Exhibit 2: IIP trends
(%)
(%)
9.0
8.4
6.0
5.2
4.8
4.4
4.2
5.0
8.0
7.5
7.5
3.6
3.4
7.0
7.0
4.0
2.6
2.8
2.5
2.5
6.7
6.7
6.6
3.0
7.0
6.3
6.4
2.0
6.0
1.0
5.0
4.7
-
5.0
(1.0)
4.0
(2.0)
(3.0)
3.0
(2.7)
(4.0)
Source: CSO, Angel Research
Source: MOSPI, Angel Research
Exhibit 3: Monthly CPI inflation trends
Exhibit 4: Manufacturing and services PMI
(%)
56.0
Mfg. PMI
Services PMI
5.6
6.0
5.4
5.3
5.4
54.0
5.2
5.0
4.9
4.6
5.0
4.3
52.0
3.7
3.7
4.0
3.3
50.0
3.0
2.0
48.0
1.0
46.0
-
44.0
Source: Market, Angel Research; Note: Level above 50 indicates expansion
Source: MOSPI, Angel Research
Exhibit 5: Exports and imports growth trends
Exhibit 6: Key policy rates
(%)
Exports yoy growth
Imports yoy growth
(%)
Repo rate
Reverse Repo rate
CRR
30.0
9.00
20.0
8.00
10.0
7.00
0.0
6.00
(10.0)
5.00
(20.0)
4.00
(30.0)
3.00
Source: Bloomberg, Angel Research
Source: RBI, Angel Research
Market Outlook
September 23, 2015
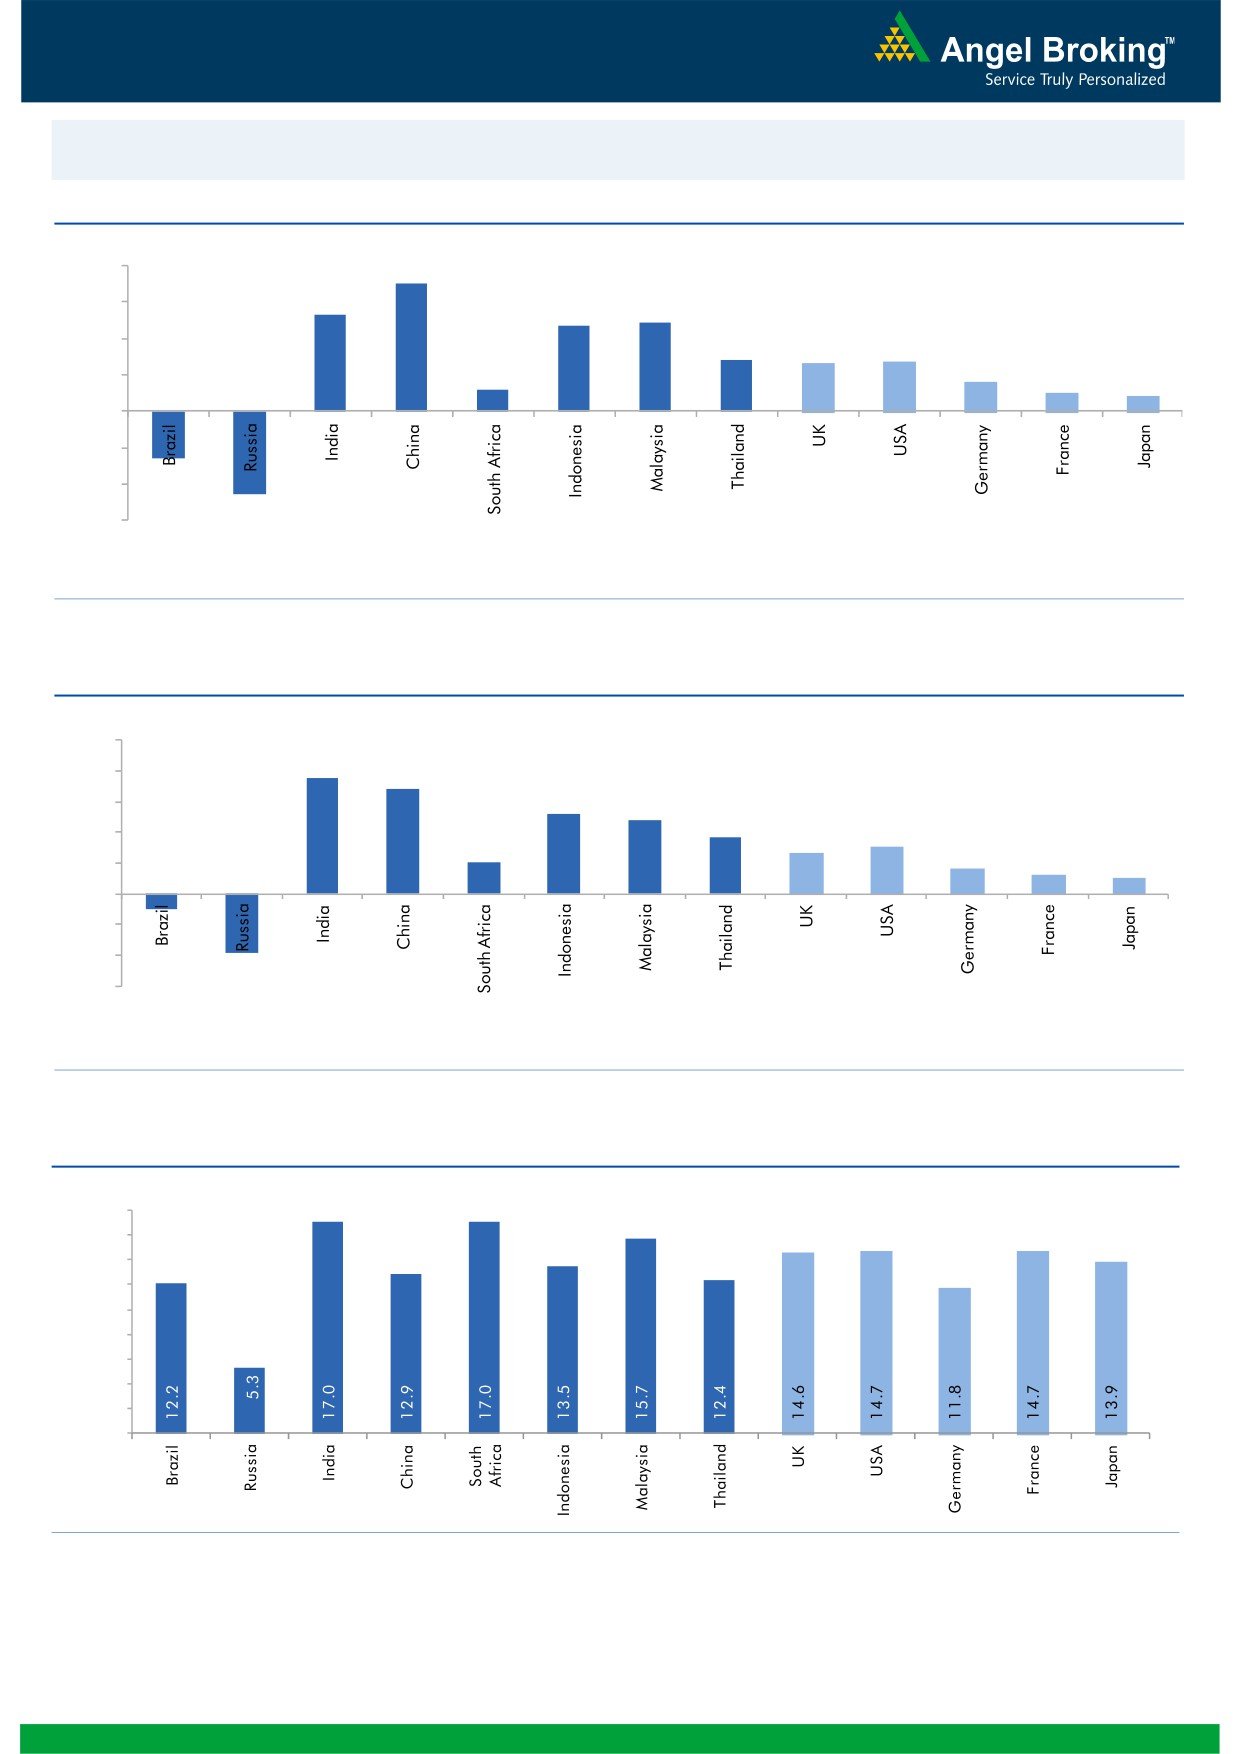
Global watch
Exhibit 1: Latest quarterly GDP Growth (%, yoy) across select developing and developed countries
(%)
8.0
7.0
5.3
6.0
4.9
4.7
4.0
2.8
2.6
2.7
1.6
2.0
1.2
1.0
0.8
(4.6)
(2.6)
-
(2.0)
(4.0)
(6.0)
Source: Bloomberg, Angel Research
Exhibit 2: 2015 GDP Growth projection by IMF (%, yoy) across select developing and developed countries
(%)
10.0
7.5
8.0
6.8
5.2
6.0
4.8
3.7
3.1
4.0
2.7
2.0
1.6
1.2
2.0
1.0
(3.8)
(1.0)
-
(2.0)
(4.0)
(6.0)
Source: IMF, Angel Research
Exhibit 3: One year forward P-E ratio across select developing and developed countries
(x)
18.0
16.0
14.0
12.0
10.0
8.0
6.0
4.0
2.0
-
Source: Bloomberg, Angel Research
Market Outlook
September 23, 2015
Exhibit 4: Relative performance of indices across globe
Returns (%)
Country
Name of index
Closing price
1M
3M
1YR
Brazil
Bovespa
46,265
1.2
(12.9)
(18.6)
Russia
Micex
1,664
0.1
3.3
16.4
India
Nifty
7,977
(6.1)
(4.5)
(1.6)
China
Shanghai Composite
3,152
(10.2)
(34.0)
36.5
South Africa
Top 40
44,524
2.6
(2.6)
(0.8)
Mexico
Mexbol
43,232
2.5
(3.1)
(4.0)
Indonesia
LQ45
730
0.4
(11.6)
(17.4)
Malaysia
KLCI
1,616
2.6
(4.6)
(12.2)
Thailand
SET 50
894
1.0
(8.6)
(15.8)
USA
Dow Jones
16,330
(0.8)
(9.6)
(4.9)
UK
FTSE
5,936
(4.1)
(10.5)
(11.1)
Japan
Nikkei
18,070
(7.0)
(10.4)
10.7
Germany
DAX
9,571
(4.5)
(14.0)
3.8
France
CAC
4,429
(4.4)
(9.2)
1.6
Source: Bloomberg, Angel Research
Market Outlook
September 23, 2015
Stock Watch
Company Name
Reco
CMP
Target
Mkt Cap
Sales ( Čcr )
OPM(%)
EPS (Č)
PER(x)
P/BV(x)
RoE(%)
EV/Sales(x)
(Č)
Price ( Č)
( Č cr )
FY16E FY17E
FY16E
FY17E
FY16E
FY17E
FY16E
FY17E
FY16E
FY17E
FY16E
FY17E
FY16E
FY17E
Agri / Agri Chemical
Rallis
Neutral
218
-
4,233
2,075
2,394
14.4
14.4
9.5
11.0
22.9
19.8
4.6
3.9
21.1
21.3
2.1
1.8
United Phosphorus
Accumulate
462
510
19,819
13,698
15,752
17.6
17.6
32.1
38.5
14.4
12.0
2.8
2.3
21.4
21.3
1.5
1.3
Auto & Auto Ancillary
Ashok Leyland
Accumulate
89
97
25,286
18,186
21,529
10.8
11.2
3.3
4.5
26.9
19.7
4.6
4.2
17.3
21.6
1.3
1.1
Bajaj Auto
Accumulate
2,258
2,438
65,343
23,544
27,245
19.8
19.8
127.0
143.4
17.8
15.8
5.4
4.6
30.3
29.4
2.3
2.0
Eicher Motors
Buy
18,335
22,859
49,765
11,681
15,550
15.3
16.9
358.5
564.3
51.1
32.5
15.4
11.4
29.8
34.9
4.1
3.1
Hero Motocorp
Accumulate
2,386
2,672
47,647
28,500
32,764
14.1
14.3
146.9
167.0
16.2
14.3
6.1
5.2
37.8
36.5
1.5
1.3
L G Balakrishnan & Bros Neutral
441
-
692
1,254
1,394
11.6
11.8
35.9
41.7
12.3
10.6
1.7
1.5
13.5
13.8
0.7
0.6
Mahindra and Mahindra Buy
1,187
1,383
73,711
38,337
43,069
13.0
13.4
52.9
63.5
22.4
18.7
3.4
3.0
15.0
15.9
1.6
1.3
Maruti
Accumulate
4,471
4,735
135,059
58,102
68,587
16.7
16.9
182.0
225.5
24.6
19.8
4.9
4.2
19.9
21.0
2.1
1.7
Minda Industries
Buy
517
652
820
2,567
2,965
7.3
8.0
38.8
54.3
13.3
9.5
1.9
1.6
14.4
16.8
0.4
0.4
Rane Brake Lining
Buy
282
366
224
454
511
11.1
11.4
23.8
28.1
11.9
10.1
1.7
1.5
14.2
15.3
0.6
0.6
Setco Automotive
Neutral
231
-
616
594
741
12.7
13.7
8.4
15.8
27.4
14.6
2.9
2.5
10.4
16.9
1.5
1.2
Tata Motors
Neutral
316
-
91,135
264,038
297,882
13.8
13.9
34.5
38.9
9.2
8.1
1.5
1.3
17.6
16.8
0.5
0.5
TVS Motor
Neutral
230
-
10,920
11,702
13,713
6.8
7.7
10.1
14.5
22.8
15.9
5.6
4.5
24.5
28.3
0.9
0.8
Amara Raja Batteries
Neutral
989
-
16,900
5,101
6,224
17.8
17.6
31.1
39.2
31.8
25.2
7.9
6.3
24.8
24.8
3.3
2.6
Exide Industries
Neutral
153
-
12,992
7,363
8,247
13.7
14.5
6.6
7.7
23.2
19.9
2.9
2.7
12.6
13.3
1.5
1.3
Apollo Tyres
Neutral
183
-
9,336
12,576
12,978
16.8
16.1
22.3
19.9
8.2
9.2
1.4
1.2
17.2
13.4
0.8
0.9
Ceat
Neutral
1,246
-
5,040
6,041
6,597
14.3
14.2
101.5
116.6
12.3
10.7
2.5
2.0
20.0
19.1
1.0
0.8
JK Tyres
Neutral
102
-
2,318
7,446
7,669
15.2
14.0
19.6
18.4
5.2
5.6
1.3
1.1
25.2
19.5
0.7
0.6
Swaraj Engines
Neutral
875
-
1,087
593
677
14.5
14.8
51.2
60.8
17.1
14.4
4.0
3.6
23.3
24.8
1.7
1.4
Subros
Neutral
79
-
474
1,268
1,488
11.6
11.9
3.7
6.6
21.4
12.0
1.4
1.3
6.8
11.4
0.7
0.6
Indag Rubber
Neutral
173
-
455
283
329
17.0
17.2
13.0
15.4
13.4
11.2
2.9
2.4
21.8
21.6
1.3
1.1
Capital Goods
ACE
Neutral
38
-
377
660
839
4.7
8.2
1.0
3.9
38.2
9.8
1.2
1.1
3.2
11.3
0.7
0.6
BEML
Neutral
1,234
-
5,139
3,277
4,006
6.0
8.9
29.2
64.3
42.3
19.2
2.4
2.1
5.7
11.7
1.7
1.3
BGR Energy
Neutral
106
-
764
3,615
3,181
9.5
9.4
16.7
12.4
6.3
8.5
0.6
0.6
10.0
7.0
0.6
0.8
BHEL
Neutral
202
-
49,356
33,722
35,272
10.8
11.7
10.5
14.2
19.2
14.2
1.4
1.3
7.0
9.0
1.5
1.5
Blue Star
Buy
331
387
2,979
3,649
4,209
5.0
5.9
9.2
14.7
36.2
22.5
6.5
6.2
9.1
17.5
0.9
0.8
Crompton Greaves
Buy
175
204
10,943
13,484
14,687
4.9
6.2
4.5
7.1
38.8
24.6
2.7
2.6
7.2
10.8
0.9
0.9
Inox Wind
Buy
363
505
8,066
4,980
5,943
17.0
17.5
26.6
31.6
13.7
11.5
4.1
3.0
35.0
30.0
1.8
1.4
Market Outlook
September 23, 2015
Stock Watch
Company Name
Reco
CMP
Target
Mkt Cap
Sales ( Čcr )
OPM(%)
EPS (Č)
PER(x)
P/BV(x)
RoE(%)
EV/Sales(x)
(Č)
Price ( Č)
( Č cr )
FY16E
FY17E
FY16E
FY17E
FY16E
FY17E
FY16E
FY17E
FY16E
FY17E
FY16E
FY17E
FY16E
FY17E
Capital Goods
KEC International
Neutral
144
-
3,693
8,791
9,716
6.1
6.8
5.4
8.2
26.6
17.5
2.7
2.4
10.0
14.0
0.6
0.6
Thermax
Neutral
897
-
10,687
6,413
7,525
7.4
8.5
30.5
39.3
29.4
22.8
4.5
3.9
15.0
17.0
1.6
1.4
Cement
ACC
Accumulate
1,353
1,548
25,406
11,856
14,092
14.5
17.8
47.6
76.1
28.4
17.8
2.9
2.7
10.6
15.7
2.0
1.6
Ambuja Cements
Accumulate
208
233
32,248
10,569
12,022
20.7
22.2
8.7
10.7
23.9
19.4
3.0
2.9
13.0
15.2
2.7
2.3
India Cements
Buy
74
112
2,287
4,716
5,133
15.9
16.9
3.7
7.5
20.1
9.9
0.7
0.7
3.8
7.3
0.8
0.7
JK Cement
Buy
611
767
4,272
4,056
4,748
14.5
17.0
22.6
41.1
27.0
14.9
2.4
2.2
9.3
15.3
1.5
1.2
J K Lakshmi Cement
Buy
371
430
4,368
2,947
3,616
16.7
19.9
11.5
27.2
32.3
13.7
3.1
2.6
9.8
20.8
1.9
1.5
Mangalam Cements
Neutral
232
-
618
1,053
1,347
10.5
13.3
8.4
26.0
27.6
8.9
1.2
1.1
4.3
12.5
1.0
0.7
Orient Cement
Buy
155
183
3,172
1,854
2,524
21.2
22.2
7.7
11.1
20.1
14.0
2.9
2.5
13.3
15.7
2.5
1.7
Ramco Cements
Accumulate
320
350
7,617
4,036
4,545
20.8
21.3
15.1
18.8
21.2
17.0
2.6
2.3
12.9
14.3
2.4
2.1
Shree Cement^
Neutral
11,966
-
41,685
7,150
8,742
26.7
28.6
228.0
345.5
52.5
34.6
7.7
6.5
15.7
20.3
5.6
4.5
UltraTech Cement
Buy
2,811
3,282
77,134
27,562
31,548
20.4
22.3
111.9
143.3
25.1
19.6
3.6
3.1
15.2
16.8
2.9
2.5
Construction
ITNL
Neutral
96
-
2,373
7,360
8,825
34.0
35.9
1.0
5.0
96.2
19.2
0.4
0.4
0.3
1.4
3.8
3.7
KNR Constructions
Neutral
546
-
1,535
915
1,479
14.3
13.9
20.3
37.2
26.9
14.7
2.5
2.1
9.6
15.6
1.8
1.1
Larsen & Toubro
Buy
1,484
2,013
138,147
68,920
82,446
10.9
11.5
57.0
73.0
26.0
20.3
2.4
2.2
13.6
15.5
2.2
1.8
Gujarat Pipavav Port
Neutral
178
-
8,610
721
784
53.1
53.6
8.2
9.1
21.7
19.6
3.5
2.8
20.0
18.3
11.5
10.2
MBL Infrastructures
Buy
245
360
1,017
2,313
2,797
12.2
14.6
19.0
20.0
12.9
12.3
1.3
1.2
11.3
10.6
1.1
1.0
Nagarjuna Const.
Neutral
70
-
3,917
7,892
8,842
8.3
9.1
2.4
5.3
29.4
13.3
1.2
1.1
4.2
8.6
0.7
0.6
PNC Infratech
Neutral
474
-
2,430
1,798
2,132
13.2
13.5
22.0
30.0
21.5
15.8
1.9
1.7
11.5
11.4
1.5
1.2
Simplex Infra
Neutral
272
-
1,348
6,241
7,008
10.4
10.7
20.0
36.0
13.6
7.6
1.1
1.0
6.8
11.1
0.7
0.6
Financials
Allahabad Bank
Neutral
76
-
4,334
8,438
9,521
2.8
2.8
21.9
27.0
3.5
2.8
0.4
0.3
10.2
11.5
-
-
Axis Bank
Buy
509
701
121,030
26,941
32,298
3.5
3.6
37.4
46.4
13.6
11.0
2.8
2.4
18.7
20.0
-
-
Bank of Baroda
Neutral
187
-
41,300
19,027
21,737
1.9
2.0
16.9
24.5
11.1
7.6
1.0
0.9
9.1
12.1
-
-
Bank of India
Neutral
137
-
9,096
16,438
18,706
1.9
2.0
19.2
40.9
7.1
3.3
0.4
0.3
4.5
9.1
-
-
Canara Bank
Neutral
274
-
14,124
15,491
17,269
2.0
2.0
61.6
70.9
4.5
3.9
0.5
0.4
10.5
11.1
-
-
Dena Bank
Neutral
39
-
2,188
3,498
3,977
2.1
2.3
7.8
10.7
5.0
3.7
0.4
0.3
6.5
8.4
-
-
Federal Bank
Neutral
64
-
10,910
3,527
4,135
3.0
3.1
5.2
6.7
12.2
9.5
1.3
1.2
10.8
12.7
-
-
HDFC
Neutral
1,168
-
184,098
10,883
12,799
3.5
3.4
43.0
50.6
27.2
23.1
5.4
4.9
25.9
26.7
-
-
HDFC Bank
Buy
1,028
1,255
258,653
38,059
46,851
4.4
4.5
50.0
62.7
20.6
16.4
3.6
3.1
18.8
20.2
-
-
Market Outlook
September 23, 2015
Stock Watch
Company Name
Reco
CMP
Target
Mkt Cap
Sales ( Čcr )
OPM(%)
EPS (Č)
PER(x)
P/BV(x)
RoE(%)
EV/Sales(x)
(Č)
Price ( Č)
( Č cr )
FY16E
FY17E
FY16E
FY17E
FY16E
FY17E
FY16E
FY17E
FY16E
FY17E
FY16E
FY17E
FY16E
FY17E
Financials
ICICI Bank
Buy
271
370
157,176
35,810
41,871
3.4
3.5
22.0
26.2
12.3
10.3
2.2
1.8
15.0
15.6
-
-
IDBI Bank
Neutral
67
-
10,730
9,860
10,978
1.8
1.9
9.3
15.6
7.2
4.3
0.5
0.4
6.4
10.1
-
-
Indian Bank
Neutral
135
-
6,501
6,267
7,171
2.4
2.5
25.4
32.1
5.3
4.2
0.4
0.4
8.0
9.3
-
-
LIC Housing Finance
Buy
435
570
21,971
2,934
3,511
2.3
2.3
30.9
36.8
14.1
11.8
2.3
2.0
16.8
17.5
-
-
Oriental Bank
Neutral
131
-
3,927
7,730
8,595
2.4
2.5
38.8
47.4
3.4
2.8
0.3
0.3
8.6
9.8
-
-
Punjab Natl.Bank
Neutral
135
-
24,953
23,446
26,624
2.8
2.9
17.8
27.5
7.6
4.9
0.8
0.6
8.5
12.1
-
-
South Ind.Bank
Neutral
21
-
2,829
1,930
2,215
2.4
2.4
2.6
3.6
8.1
5.8
0.8
0.7
9.9
12.5
-
-
St Bk of India
Buy
238
307
180,000
83,847
96,307
2.8
2.8
20.1
25.1
11.8
9.5
1.3
1.1
11.5
13.1
-
-
Union Bank
Neutral
173
-
11,002
12,755
14,439
2.3
2.4
31.5
39.9
5.5
4.3
0.6
0.5
9.9
11.6
-
-
Vijaya Bank
Neutral
34
-
2,951
3,594
3,969
1.8
1.9
5.8
7.1
5.9
4.9
0.5
0.5
8.2
9.3
-
-
Yes Bank
Buy
733
953
30,691
7,204
9,078
3.2
3.2
57.8
69.5
12.7
10.6
2.3
1.9
19.6
22.6
-
-
FMCG
Asian Paints
Neutral
804
-
77,120
16,553
19,160
16.0
16.2
17.7
21.5
45.5
37.4
12.1
10.9
29.4
31.2
4.5
3.9
Britannia
Neutral
2,901
-
34,804
8,065
9,395
9.6
10.2
47.2
65.5
61.4
44.3
20.4
19.3
38.3
41.2
4.2
3.6
Colgate
Accumulate
1,924
2,022
26,170
4,836
5,490
19.5
19.7
48.5
53.2
39.7
36.2
29.1
25.3
99.8
97.5
5.3
4.7
Dabur India
Neutral
278
-
48,822
9,370
10,265
17.1
17.2
7.3
8.1
37.9
34.3
11.4
9.3
33.7
30.6
5.1
4.7
GlaxoSmith Con*
Neutral
5,994
-
25,207
4,919
5,742
17.2
17.4
168.3
191.2
35.6
31.4
10.1
8.6
28.8
28.9
4.7
4.0
Godrej Consumer
Neutral
1,175
-
40,018
10,168
12,886
16.1
16.1
32.1
38.4
36.6
30.6
7.4
6.9
19.7
21.0
4.0
3.2
HUL
Neutral
786
-
170,101
34,940
38,957
17.5
17.7
20.8
24.7
37.8
31.8
42.0
33.6
110.5
114.2
4.7
4.2
ITC
Buy
312
409
250,371
41,068
45,068
37.8
37.4
13.9
15.9
22.4
19.6
7.5
6.6
34.1
33.8
5.7
5.2
Marico
Neutral
395
-
25,452
6,551
7,766
15.7
16.0
10.4
12.5
38.0
31.6
11.0
9.2
33.2
32.4
3.8
3.2
Nestle*
Accumulate
6,141
6,646
59,204
11,291
12,847
22.2
22.3
158.9
184.6
38.6
33.3
20.2
18.2
55.0
57.3
5.1
4.4
Tata Global
Buy
124
152
7,813
8,635
9,072
9.8
9.9
6.5
7.6
19.1
16.3
1.9
1.8
6.8
7.4
0.8
0.8
IT
HCL Tech^
Buy
942
1,132
132,458
42,038
47,503
23.5
23.5
56.4
62.9
16.7
15.0
3.9
3.0
23.2
19.8
2.8
2.2
Infosys
Buy
1,106
1,306
253,927
60,250
66,999
28.0
28.0
58.3
63.7
19.0
17.4
4.0
3.4
20.9
19.7
3.5
3.0
TCS
Buy
2,526
3,168
494,843
108,420
123,559
28.8
28.7
127.2
143.9
19.9
17.6
7.9
7.3
39.9
41.8
4.2
3.6
Tech Mahindra
Buy
558
646
53,643
25,566
28,890
16.0
17.0
26.3
31.9
21.2
17.5
3.8
3.3
17.9
18.6
1.9
1.6
Wipro
Buy
595
719
146,864
52,414
58,704
23.7
23.8
38.4
42.3
15.5
14.1
3.0
2.7
19.5
18.0
2.4
2.0
Media
D B Corp
Accumulate
314
356
5,766
2,241
2,495
27.8
27.9
21.8
25.6
14.4
12.3
3.8
3.3
26.7
28.5
2.5
2.3
HT Media
Neutral
81
-
1,888
2,495
2,603
11.2
11.2
7.3
8.6
11.1
9.4
0.9
0.8
7.4
8.1
0.3
0.2
Market Outlook
September 23, 2015
Stock Watch
Company Name
Reco
CMP
Target
Mkt Cap
Sales ( Čcr )
OPM(%)
EPS (Č)
PER(x)
P/BV(x)
RoE(%)
EV/Sales(x)
(Č)
Price ( Č)
( Č cr )
FY16E FY17E
FY16E
FY17E
FY16E
FY17E
FY16E
FY17E
FY16E
FY17E
FY16E
FY17E
FY16E
FY17E
Media
Jagran Prakashan
Accumulate
136
156
4,456
1,939
2,122
26.0
26.0
8.3
9.2
16.4
14.8
2.8
2.5
17.5
17.1
2.3
2.0
Sun TV Network
Neutral
360
-
14,185
2,779
3,196
70.2
70.5
22.8
27.3
15.8
13.2
3.9
3.5
26.7
28.3
4.9
4.2
Hindustan Media
Buy
223
292
1,639
920
1,031
20.0
20.0
19.2
20.9
11.6
10.7
1.9
1.6
16.4
15.3
1.3
1.2
Ventures
Metals & Mining
Coal India
Buy
324
400
204,555
72,015
78,415
21.2
21.5
21.7
25.3
14.9
12.8
5.1
5.0
33.1
39.1
2.1
1.9
Hind. Zinc
Neutral
134
-
56,662
15,258
16,495
44.2
45.6
17.6
19.2
7.6
7.0
1.2
1.1
15.9
15.3
1.4
1.0
Hindalco
Neutral
73
-
15,105
104,356
111,186
8.7
9.5
6.7
11.1
10.9
6.6
0.4
0.4
3.5
5.9
0.7
0.6
JSW Steel
Neutral
911
-
22,021
48,125
53,595
18.8
21.0
46.9
97.5
19.4
9.3
0.9
0.9
4.4
9.5
1.3
1.1
NMDC
Neutral
102
-
40,519
8,237
10,893
46.6
44.5
10.0
11.7
10.3
8.8
1.1
1.0
12.5
13.0
4.7
3.6
SAIL
Neutral
51
-
20,940
45,915
53,954
7.2
10.5
1.5
4.4
33.7
11.6
0.5
0.5
2.3
4.1
1.1
1.0
Vedanta
Neutral
92
-
27,379
71,445
81,910
26.2
26.3
12.9
19.2
7.2
4.8
0.5
0.4
7.2
8.9
0.8
0.6
Tata Steel
Neutral
220
-
21,367
136,805
149,228
11.3
11.9
26.4
36.8
8.3
6.0
0.7
0.6
6.0
8.0
0.7
0.6
Oil & Gas
Cairn India
Neutral
142
-
26,539
11,323
12,490
49.4
51.0
20.7
20.7
6.8
6.9
0.4
0.4
6.4
6.1
1.4
0.8
GAIL
Neutral
290
-
36,754
64,856
70,933
9.1
9.6
24.0
28.9
12.1
10.0
1.0
1.0
8.8
9.6
0.8
0.7
ONGC
Neutral
235
-
200,626
154,564
167,321
36.8
37.4
28.6
32.5
8.2
7.2
1.0
1.0
12.7
13.5
1.5
1.4
Petronet LNG
Buy
176
210
13,196
39,007
40,785
3.8
4.2
9.2
11.0
19.2
16.0
2.1
2.0
11.6
12.7
0.4
0.4
Indian Oil Corp
Buy
391
455
94,848
359,607
402,760
5.9
6.1
42.5
48.7
9.2
8.0
1.2
1.1
14.1
14.4
0.4
0.3
Reliance Industries
Accumulate
847
930
274,441
313,085
362,904
13.1
13.8
78.4
92.9
10.8
9.1
1.1
1.0
10.8
11.6
1.3
1.2
Pharmaceuticals
Alembic Pharma
Neutral
680
-
12,818
2,601
3,115
21.2
20.2
20.8
23.9
32.7
28.5
10.5
7.9
37.2
31.8
5.0
4.1
Aurobindo Pharma
Buy
716
872
41,806
14,923
17,162
23.0
23.0
38.2
43.6
18.7
16.4
5.8
4.3
36.0
30.2
3.1
2.7
Aventis*
Neutral
4,217
-
9,711
2,156
2,455
15.1
16.8
109.7
133.9
38.4
31.5
5.3
4.3
18.4
22.5
4.2
3.5
Cadila Healthcare
Neutral
1,937
-
39,663
10,224
11,840
20.0
21.0
71.0
85.6
27.3
22.6
7.3
5.8
30.1
28.5
3.9
3.3
Cipla
Neutral
643
-
51,652
14,359
16,884
21.3
19.7
28.4
30.5
22.7
21.1
4.0
3.4
19.3
17.5
3.6
3.0
Dr Reddy's
Accumulate
3,929
4,169
66,988
17,903
20,842
22.7
22.8
160.5
189.5
24.5
20.7
5.0
4.1
22.2
21.7
3.7
3.1
Dishman Pharma
Accumulate
264
290
2,131
1,716
1,888
20.2
20.2
16.3
21.6
16.2
12.2
1.5
1.4
9.7
11.7
1.4
1.2
GSK Pharma*
Neutral
3,353
-
28,403
2,870
3,158
20.0
22.1
59.5
68.3
56.4
49.1
16.6
17.1
28.5
34.3
9.4
8.6
Indoco Remedies
Neutral
328
-
3,023
1,088
1,262
18.2
18.2
13.1
15.5
25.0
21.2
4.9
4.1
21.2
21.1
2.8
2.5
Ipca labs
Accumulate
746
800
9,418
3,507
4,078
17.6
18.6
25.8
32.0
28.9
23.3
3.7
3.2
13.8
14.9
2.9
2.5
Lupin
Neutral
1,868
-
84,093
14,864
17,244
26.9
26.9
62.1
71.1
30.1
26.3
7.3
5.8
27.4
24.6
5.4
4.5
Sun Pharma
Accumulate
901
950
216,808
28,163
32,610
25.8
30.7
17.4
26.9
51.8
33.5
4.9
4.3
13.0
16.6
7.2
6.0
Market Outlook
September 23, 2015
Stock Watch
Company Name
Reco
CMP
Target
Mkt Cap
Sales ( Čcr )
OPM(%)
EPS (Č)
PER(x)
P/BV(x)
RoE(%)
EV/Sales(x)
(Č)
Price ( Č)
( Č cr )
FY16E FY17E
FY16E
FY17E
FY16E
FY17E
FY16E
FY17E
FY16E
FY17E
FY16E
FY17E
FY16E
FY17E
Power
Tata Power
Neutral
63
-
16,999
35,923
37,402
22.6
22.8
4.1
5.2
15.5
12.2
1.2
1.1
7.5
9.3
1.4
1.3
NTPC
Buy
121
157
99,605
87,064
98,846
23.5
23.5
11.7
13.2
10.3
9.2
1.2
1.1
11.4
12.1
2.2
1.9
Power Grid
Buy
131
170
68,455
20,702
23,361
86.7
86.4
12.1
13.2
10.8
9.9
1.6
1.4
15.6
15.1
8.2
7.7
Telecom
Bharti Airtel
Neutral
343
-
137,191
101,748
109,191
32.1
31.7
12.0
12.5
28.6
27.5
2.0
1.8
6.9
6.7
2.0
1.8
Idea Cellular
Neutral
143
-
51,561
34,282
36,941
32.0
31.5
5.9
6.2
24.3
23.1
2.2
2.0
9.9
9.3
2.1
2.0
zOthers
Abbott India
Neutral
5,829
-
12,386
2,715
3,153
14.5
14.1
134.3
152.2
43.4
38.3
10.8
8.9
27.4
25.6
4.3
3.6
Bajaj Electricals
Buy
250
341
2,524
4,719
5,287
5.2
5.8
8.6
12.7
29.2
19.8
3.3
2.9
11.4
14.8
0.5
0.5
Finolex Cables
Neutral
232
-
3,545
2,728
3,036
10.8
11.0
14.4
16.8
16.1
13.8
2.5
2.1
15.2
15.3
1.0
0.9
Goodyear India*
Buy
550
655
1,268
1,953
1,766
12.4
12.0
67.4
59.6
8.2
9.2
2.0
1.7
27.7
20.2
0.4
0.4
Hitachi
Neutral
1,318
-
3,584
1,806
2,112
9.0
9.2
28.6
29.1
46.1
45.3
11.5
9.2
28.1
22.6
2.1
1.8
Jyothy Laboratories
Neutral
313
-
5,673
1,620
1,847
11.5
11.5
7.3
8.5
43.0
37.0
5.6
5.2
13.3
14.4
3.4
2.9
MRF
Neutral
41,501
-
17,601
20,727
14,841
19.3
18.6
4,905.8
3,351.9
8.5
12.4
2.7
2.2
37.6
19.6
0.8
1.1
Page Industries
Neutral
12,988
-
14,486
1,929
2,450
19.8
20.1
229.9
299.0
56.5
43.4
24.9
17.3
52.1
47.1
7.5
5.9
Relaxo Footwears
Neutral
535
-
6,424
1,767
2,152
12.3
12.5
19.3
25.1
27.8
21.4
6.8
5.2
27.7
27.8
3.7
3.0
Siyaram Silk Mills
Buy
993
1,221
931
1,653
1,873
11.7
12.2
99.3
122.1
10.0
8.1
1.8
1.5
19.5
20.2
0.7
0.6
Styrolution ABS India*
Neutral
744
-
1,308
1,271
1,440
8.6
9.2
32.0
41.1
23.2
18.1
2.4
2.1
10.7
12.4
1.0
0.9
Tree House
Buy
354
449
1,498
259
324
56.8
56.8
17.0
21.7
20.8
16.3
2.1
1.9
10.1
11.5
5.7
4.7
TVS Srichakra
Buy
2,703
3,210
2,069
2,127
2,388
15.2
14.9
237.7
267.5
11.4
10.1
4.8
3.4
51.7
39.8
1.0
0.9
HSIL
Accumulate
265
302
1,914
2,182
2,404
16.3
16.5
15.8
18.9
16.8
14.0
1.4
1.3
8.4
9.4
1.2
1.1
Kirloskar Engines India
Neutral
305
-
4,406
2,634
3,252
10.1
12.0
10.9
17.4
27.9
17.5
3.1
2.8
11.4
16.8
1.3
1.0
Ltd
M M Forgings
Buy
559
797
674
563
671
22.1
22.9
51.0
66.5
11.0
8.4
2.3
1.8
23.1
24.1
1.4
1.1
Banco Products (India)
Neutral
119
-
848
1,208
1,353
11.0
12.3
10.8
14.5
11.0
8.2
1.3
1.1
11.9
14.5
0.7
0.6
Competent Automobiles Neutral
147
-
90
1,007
1,114
3.1
3.1
23.7
28.2
6.2
5.2
0.9
0.8
13.9
14.6
0.1
0.1
Nilkamal
Accumulate
934
1,005
1,394
1,948
2,147
10.6
10.3
60.0
67.0
15.6
13.9
2.4
2.1
16.8
16.1
0.8
0.7
Visaka Industries
Buy
126
166
199
1,158
1,272
8.6
9.5
23.7
32.7
5.3
3.8
0.5
0.5
10.1
12.5
0.3
0.3
Transport Corporation of
Buy
240
293
1,829
2,830
3,350
8.8
9.0
14.4
18.3
16.7
13.1
2.6
2.2
15.4
17.1
0.8
0.7
India
Elecon Engineering
Buy
69
87
754
1,452
1,596
14.0
14.7
4.4
6.2
15.7
11.1
1.3
1.2
8.6
11.2
0.8
0.7
Surya Roshni
Buy
123
183
540
2,992
3,223
8.3
8.5
14.7
18.3
8.4
6.7
0.8
0.7
9.8
11.0
0.5
0.4
MT Educare
Buy
126
169
502
286
366
18.3
17.7
7.7
9.4
16.3
13.5
3.4
3.0
20.2
21.1
1.7
1.2
Market Outlook
September 23, 2015
Stock Watch
Company Name
Reco
CMP
Target Mkt Cap
Sales ( Čcr )
OPM(%)
EPS (Č)
PER(x)
P/BV(x)
RoE(%)
EV/Sales(x)
(Č)
Price ( Č)
( Č cr )
FY16E FY17E FY16E FY17E FY16E FY17E FY16E FY17E FY16E FY17E FY16E FY17E FY16E FY17E
zOthers
Radico Khaitan
Buy
84
112
1,122
1,565
1,687
11.9
12.4
5.4
6.6
15.6
12.8
1.3
1.2
8.0
9.0
1.2
1.2
Garware Wall Ropes
Buy
316
390
692
875
983
10.4
10.6
23.1
27.8
13.7
11.4
1.9
1.7
14.1
14.8
0.8
0.7
Wonderla Holidays
Buy
278
322
1,571
206
308
44.0
43.6
9.0
12.9
30.9
21.6
4.2
3.8
13.7
17.8
7.5
5.0
Linc Pen & Plastics
Buy
152
185
224
340
371
8.3
8.9
10.8
13.2
14.0
11.5
2.2
2.0
16.0
17.1
0.7
0.6
The Byke Hospitality
Accumulate
159
181
639
222
287
20.5
20.5
5.6
7.6
28.3
21.1
5.3
4.4
18.9
20.8
2.9
2.2
Source: Company, Angel Research; Note: *December year end; #September year end; &October year end; Price as on September 22, 2015
Market Outlook
September 23, 2015
Research Team Tel: 022 - 39357800
DISCLAIMER
Angel Broking Private Limited (hereinafter referred to as “Angel”) is a registered Member of National Stock Exchange of India Limited,
Bombay Stock Exchange Limited and MCX Stock Exchange Limited. It is also registered as a Depository Participant with CDSL and
Portfolio Manager with SEBI. It also has registration with AMFI as a Mutual Fund Distributor. Angel Broking Private Limited is a registered
entity with SEBI for Research Analyst in terms of SEBI (Research Analyst) Regulations, 2014 vide registration number INH000000164.
Angel or its associates has not been debarred/ suspended by SEBI or any other regulatory authority for accessing /dealing in securities
Market. Angel or its associates including its relatives/analyst do not hold any financial interest/beneficial ownership of more than 1% in
the company covered by Analyst. Angel or its associates/analyst has not received any compensation / managed or co-managed public
offering of securities of the company covered by Analyst during the past twelve months. Angel/analyst has not served as an officer,
director or employee of company covered by Analyst and has not been engaged in market making activity of the company covered by
Analyst.
This document is solely for the personal information of the recipient, and must not be singularly used as the basis of any investment
decision. Nothing in this document should be construed as investment or financial advice. Each recipient of this document should make
such investigations as they deem necessary to arrive at an independent evaluation of an investment in the securities of the companies
referred to in this document (including the merits and risks involved), and should consult their own advisors to determine the merits and
risks of such an investment.
Reports based on technical and derivative analysis center on studying charts of a stock's price movement, outstanding positions and
trading volume, as opposed to focusing on a company's fundamentals and, as such, may not match with a report on a company's
fundamentals.
The information in this document has been printed on the basis of publicly available information, internal data and other reliable sources
believed to be true, but we do not represent that it is accurate or complete and it should not be relied on as such, as this document is for
general guidance only. Angel Broking Pvt. Limited or any of its affiliates/ group companies shall not be in any way responsible for any
loss or damage that may arise to any person from any inadvertent error in the information contained in this report. Angel Broking Pvt.
Limited has not independently verified all the information contained within this document. Accordingly, we cannot testify, nor make any
representation or warranty, express or implied, to the accuracy, contents or data contained within this document. While Angel Broking
Pvt. Limited endeavors to update on a reasonable basis the information discussed in this material, there may be regulatory, compliance,
or other reasons that prevent us from doing so.
This document is being supplied to you solely for your information, and its contents, information or data may not be reproduced,
redistributed or passed on, directly or indirectly.
Neither Angel Broking Pvt. Limited, nor its directors, employees or affiliates shall be liable for any loss or damage that may arise from or
in connection with the use of this information.
Note: Please refer to the important ‘Stock Holding Disclosure' report on the Angel website (Research Section). Also, please refer to the
latest update on respective stocks for the disclosure status in respect of those stocks. Angel Broking Pvt. Limited and its affiliates may have
investment positions in the stocks recommended in this report.